

marchmeena29/iStock via Getty Images
Written by Nick Ackerman. This article was originally published to members of Cash Builder Opportunities on March 23rd, 2022.
Hercules Capital (NYSE:HTGC) is one of the more prevalent business development companies out there today. One of the reasons for this isn’t just because it is one of the larger offerings in the BDC space but has also been delivering results to shareholders over the years. They have total assets under management of around $2.6 billion. Today is my initial dive into this fund, and on the surface, it looks like it has a lot of promise to go on the watchlist.
One of the hesitations is the current premium to the NAV per share. Despite this name regularly trading above its underlying value, it seems elevated at this time.
HTGC Premium/Discount Chart (CEFData)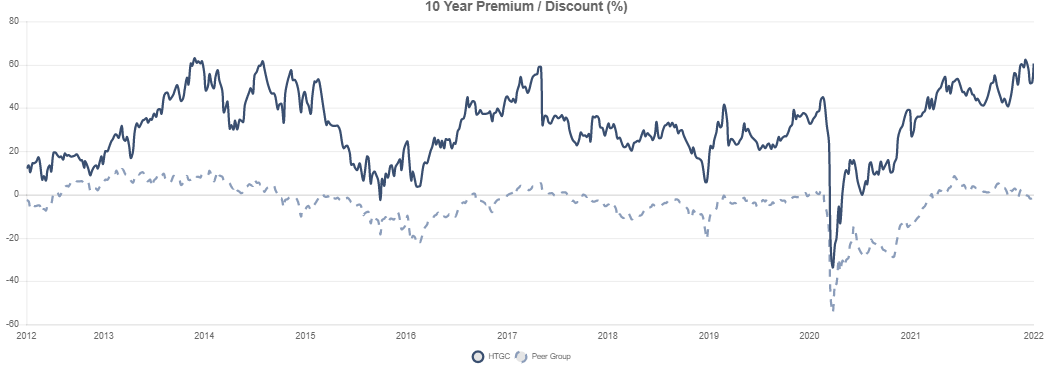
HTGC has upped its regular quarterly distribution at the end of 2021. However, they don’t have a perfect track record and had cut its regular dividend in 2010. That being said, it wasn’t alone. Main Street Capital (MAIN) is the only BDC I know that was launched pre-2008 that had not cut its dividend through that period. So that doesn’t necessarily make it a bad BDC to consider. Since these types of investments are often more sensitive to economic conditions, this only makes sense.
Why Consider BDCs At This Time
BDCs could be set to perform well on the interest rate risk front in the current environment. This is because they often borrow at fixed rates and put capital to work in floating-rate loans. HTGC is no different. With the latest presentation, we see the majority of their portfolio is in floating rate investments.
HTGC Investment Portfolio (Hercules Capital)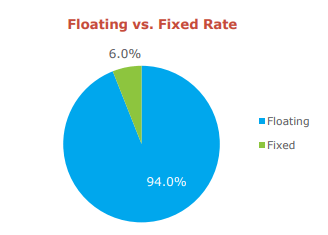
At the same time, the bulk of their borrowings is in fixed-rate notes. However, there are some smaller liabilities in floating rate credit facilities.
HTGC Funding (Hercules Capital)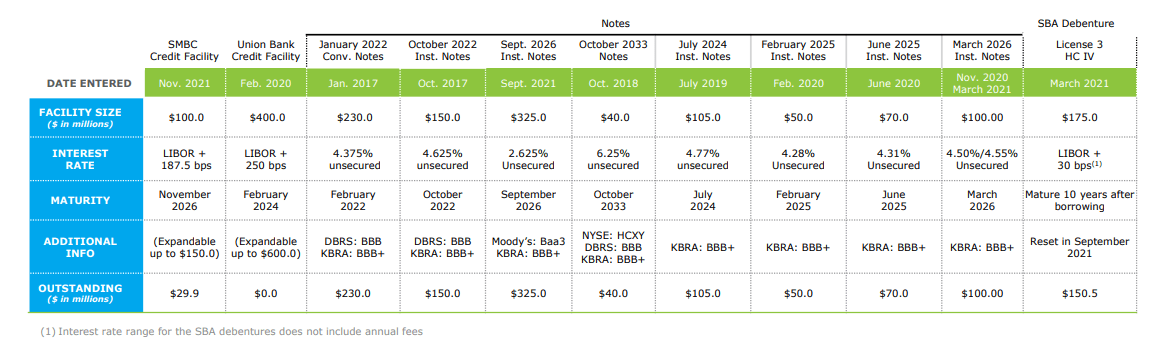
At the end of Q4 2021, they had a total of $1,250.4 billion in leverage. $180.4 million of this was based on LIBOR plus a spread, working out to 14.43% of the leverage they are utilizing.
Another critical point is that if you are concerned about leverage, then BDCs probably aren’t right for you even if they should do well. The reason being (if it isn’t apparent yet) is the high amount of leverage they employ. As we mentioned, HTGC has total assets of $2.6 billion, but $1.250 billion+ is leverage. That works out to a total leverage figure of around 48%.
A Bit About Hercules Capital And Some Comparisons
HTGC is self-described as “the leading and largest specialty finance company focused on providing senior secured venture growth loans to high-growth, innovative venture capital-backed companies in a broad variety of technology, life science and sustainable and renewable technology industries.”
They have an inception going back to December 2003, and they boast “more than $13 billion to over 560 companies and is the lender of choice for entrepreneurs and venture capital firms seeking growth capital financing.”
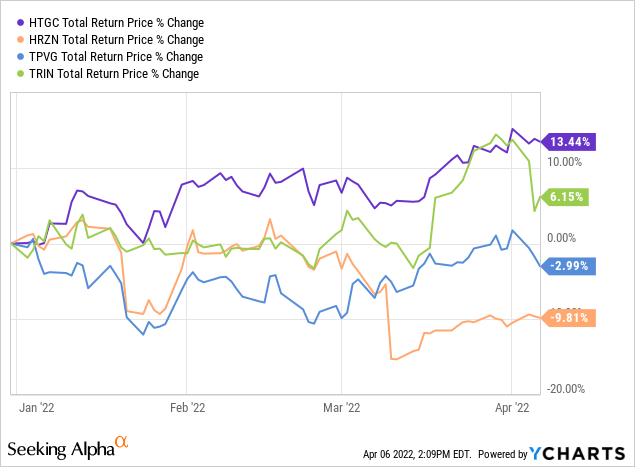
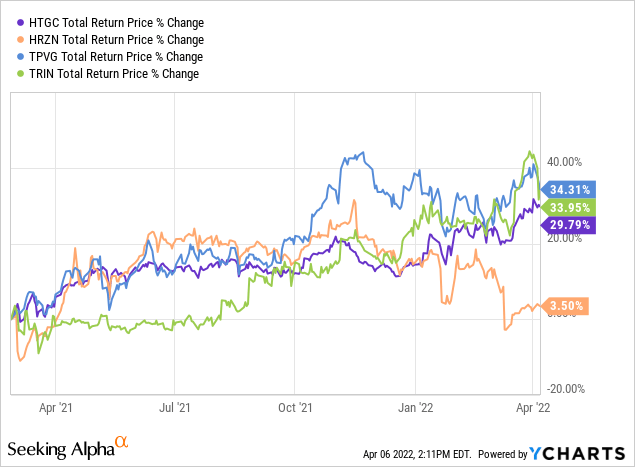
The orientation towards a more tech heavier portfolio could make it comparable to Horizon Technology Finance (HRZN), which I own. It could also be relatively comparable to TriplePoint Venture Growth BDC (TPVG). Additionally, Trinity Capital (TRIN) is another comparable BDC – which is another one that I had picked up.
To compare the YTD total returns of these basket of BDCs, HTGC has easily come out on top. TRIN had a sharp decline recently due to a secondary offering. HRZN also conducted a secondary offering rather recently.
One of the reasons for this could have been the expanding premium to NAV that we have been experiencing. HTGC has gone from a premium of around 44.5% to 60.52% as of March 23rd, 2022. The NAV for BDCs is reported quarterly, so we are a bit in the dark about where it could shake out next – that’s true for any of these names. On the other hand, HRZN’s premium has fallen quite precipitously from around a 38% premium to the 20.33% at this time. This was on the back of a secondary offering. That can explain some of the divergences on a YTD basis.
TRIN only became publicly traded back in February 2021. So if we compare the four names here, we are a bit limited. However, we once again see that HRZN has come in at the bottom of the performance.
A portion of this is again associated with the recent rapid decline due to the secondary offering. In this longer time frame, which mostly is just showing 2021’s performances, it shows us TPVG coming out on top. TRIN was slow to bloom, but eventually, investors caught on. Right in time for them to sell shares at a higher price.
Dropping TRIN from the comparison, we can assess a more extended period with these other three. I think what we see is quite interesting. TPVG comes out on top, HTGC comes out in the middle, and HRZN is once again the laggard. HRZN hung right with HTGC until that secondary offering. We can see that it was the best performing of this trio for a period, too. That seems to be related to its premium expansion prior to the secondary offering.
YCharts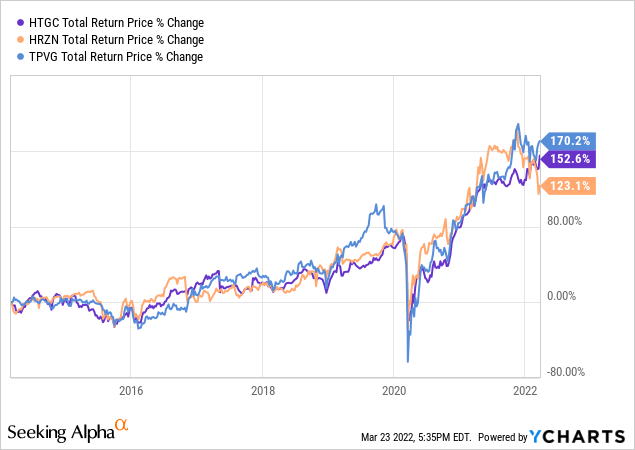
TPVG has also enjoyed trading at premiums fairly consistently over the last couple of years. Before that, discounts were the more common trading level. What is interesting to note is that HTGC and TRIN are internally managed. HRZN and TPVG are externally managed. Internally managed BDCs are generally favored and have performed better historically due to lower operating expenses. That is one of the reasons why they often trade at higher premiums.
According to CEFData, the expense ratio excluding leverage for HTGC came to 5.54%. That worked out to 9.75% for HRZN, 8.03% for TPVG and 7.93% for TRIN. In this case, HTGC shows the lowest expense ratio, and I think that is one more positive for this BDC.
Dividend Confusion
As an income investor, one of my main focuses is on the dividend and if it seems sustainable. This is also a significant point of investing in BDCs in the first place.
What has made HTGC stand out a bit more from peers has been the number of supplemental distributions that they’ve been paying out. The supplemental has been so consistent though, it appears that some of the data aggregators can’t keep this straight. As an example, Seeking Alpha shows a Q4 2021 dividend paid of $0.40 and a $0.07 “Other.” What it should be showing is $0.33 and a supplemental $0.07. The $0.33 was actually an increase from the $0.32 that it paid in the previous quarter.
HTGC Distribution History (Hercules Capital)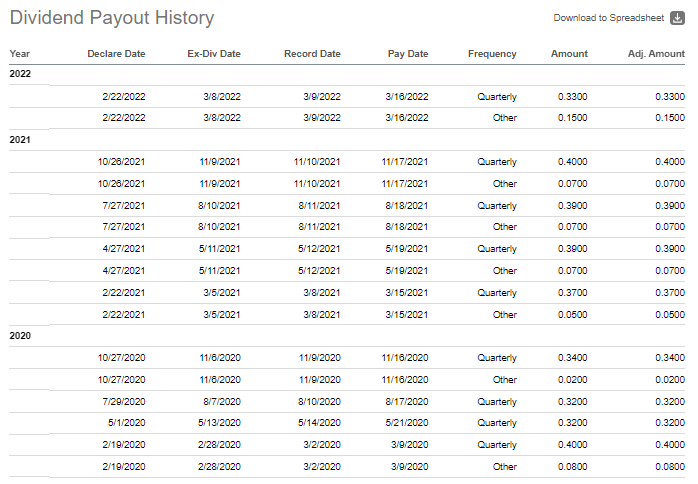
It isn’t just Seeking Alpha, though; the Nasdaq website doesn’t break out supplemental payouts from the regular at all. That is another popular site that often comes up when searching for dividend history. That makes it appear that the quarterly distribution is all over the place. Which is one thing that some income investors don’t like to see.
Sometimes, it is just best to go directly to the source, especially if you are seriously considering an investment. A website such as Seeking Alpha can be fantastic to give an initial look, but ultimately more due diligence is needed to at least confirm the data we are seeing.
When you go to the HTGC website, it all becomes clear what is going on.
HTGC Distribution History (Hercules Capital)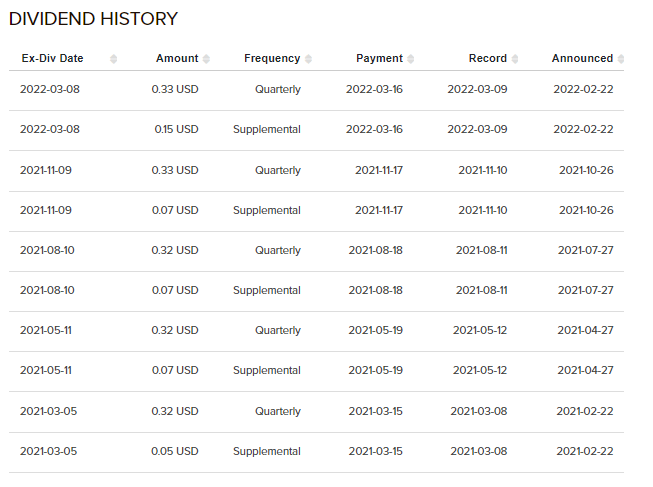
So far, there has been a supplemental distribution alongside the regular quarterly dividend going back to 2020. It varies but comes between $0.02 and the latest being the highest at $0.15. In 2020, Q1 had a supplemental along with several being paid out in 2019. This indicates that the BDC has seemingly been operating successfully.
The reason for supplemental or extra payouts is because, as regulated investment companies, they are required to pay out almost their entire income and gains that they have coming in. The income often funds the regular quarterly dividend, and the supplementals take care of the capital gains side of the equation.
If we were to only calculate the regular $0.33 quarterly payout, it would work out to around a 7.2% yield at this time. Certainly an attractive yield for income investors. That being said, the $0.15 is also expected to remain in place over the next 4 quarters as well. Which means a “supplemental” that will become quite regular, at least for the shorter term. They discussed more of these details in the call.
For the year 2021, inclusive of Q4, we have declared $1.66 of distributions to our shareholders, which is a 23% increase over the same period last year. Given the positive outlook that we have on our business, in combination with our record undistributed earnings spillover of approximately $192.1 million or $1.65 per share, our Board of Directors have approved a new supplemental cash distribution program of $0.60 for the next 4 quarters, payable $0.15 per quarter beginning with Q4 2021, which was previously $0.07 per quarter. The undistributed earnings spillover continues to provide us with added flexibility with respect to our shareholder distributions going forward and the ability to continue to invest in our team and platform.
Therefore, it doesn’t come as a surprise when we go over the latest earnings. We see that net investment income came to $0.35 per share or a 106% coverage of base distribution. We also see the latest quarter provided $6,277 million in realized gains. For the full 2021 year, they achieved $20,876 million in realized gains.
From the share remarks above, the management team is expecting continued positive results through 2022. However, those remarks were before the geopolitical risks fully entered the equation. In my opinion, BDCs shouldn’t struggle too much as long as the fallout over the Russia/Ukraine situation stays mostly in Europe. On the other hand, rapid inflation could hurt a lot of U.S. companies.
Inflation is only set to ramp up if the costs of energy move sharply high. That’s why despite the focus of small and mid-sized businesses in the U.S., we could see some bleed over weakness. I think this is something that should be considered, especially if thinking about adding a highly leveraged investment in one’s portfolio.
HTGC’s Portfolio
Above we showed the portion of the portfolio that was floating vs. fixed rate. However, I think a few other things in the portfolio are important to take a look at too. One of those is the credit rating that can show us how the underlying investments are performing at the end of 2021.
HTGC Credit Grading (Hercules Capital)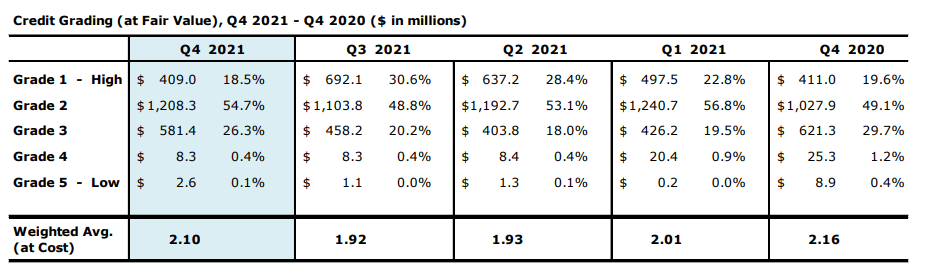
In this case, the portfolio is tilted towards a higher quality weighting in the grade 2 category. A rating of 1 would be considered the highest rating. Over the last year, this has stayed relatively flat in their assessment.
For some context, TRIN had assigned its own portfolio at a weighting of 3. However, their scale is the reverse of HTGC’s grading. They use a 1 through 5, with 5 being the highest rated or “very strong performance,” as they identify it. So essentially, they are designating each of their underlying investments at about equal ratings.
However, what might be more critical to watch is the lowest grade or non-accruals. For HTGC, they had noted that three debt investments with an investment cost of $23.9 million or a fair value cost of $10.1 million were in this category. That works out to 1 and 0.4%, respectively, for HTGC’s total investment portfolio.
That represents only a small portion of their portfolio and means they are in a fairly strong position.
In their latest presentation, they also listed several specific items of “what we don’t do.” That included;
- no direct oil and gas exposure
- no CLO exposure
- no CMBS or RMBS exposure
- no metals or mineral exposure
The above tend to be generally more sensitive investments that can be even more reliant on a strong economy. That’s why it could be worthwhile for them to note that they avoid those areas when investing.
In total, they noted 92 companies with debt investments, 97 warrant holdings and 75 equity holdings in companies. For a BDC, that is a fair number of different positions. Due to the significant size of HTGC, I suspect that’s why they hold a relatively higher number of total positions. HRZN, for example, is a smaller BDC. They held a total of 76 warrant and equity positions, along with 45 debt investments.
Their emphasis is on venture-growth tech and science investments. This is represented by the underlying industry breakdown, with the most significant being in the drug discovery and development category. This is followed by software and internet consumer and business services.
HTGC’s Industry Breakout (Hercules Capital)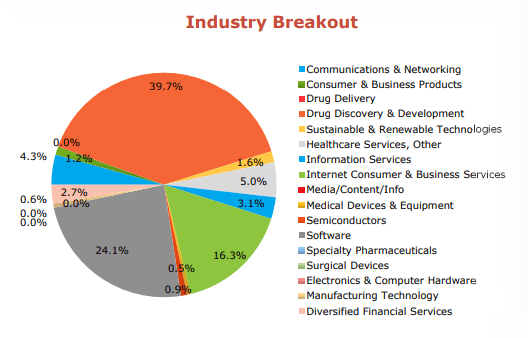
Finally, looking at a geographic breakdown of their portfolio shows that they have their primary exposure in each of the coastal regions. This isn’t all that overly surprising either. That is primarily where most of the pushes into tech and science are happening.
HTGC’s Geographic Weightings (Hercules Capital)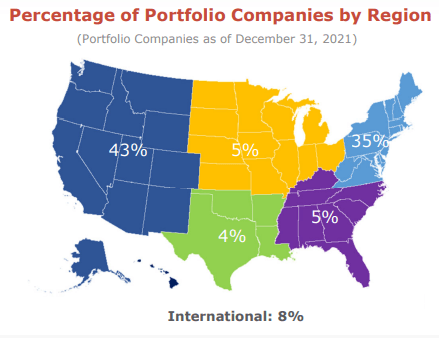
Although, a downside here could be argued that it isn’t diversified geographically. Then again, it isn’t designed to be a diversified BDC in the first place with their heavier emphasis on tech and science in the first place. If one was looking for a diversified BDC, something like MAIN could be more appropriate.
Conclusion
This was my initial dive into HTGC. I think there is a lot of appeal here. My initial thought was perhaps replacing HRZN with HTGC. However, after taking into consideration the declines after the secondary offering – which I suspect to be temporary – I think I would add HTGC to my portfolio but not take another position out of my portfolio.
For an income investor, HTGC has a lot to offer at this time. The regular dividend has been boosted, and the supplemental is intended to be rather regular over the next year. Even before the regular being boosted, they had paid out a generous and consistent payout except for after 2008/09. Given their history of successfully navigating their portfolio, it could be even mean we see supplementals for longer than what has been projected so far.
On a more cautious note, the current premium above the last reported NAV could be concerning for some investors hoping to get a great deal. HTGC has been performing well and should continue to perform well given the current environment – it would appear investors have already caught on to that trend.
Be the first to comment