

alexsl
Dear Investors,
The Headwaters Capital portfolio declined -20.5% compared to a -16.9% decline for the Russell Mid Cap index in Q2 2022. A brief discussion of the performance and trading activity during the quarter is presented below.
|
Headwaters Capital Returns |
|||
|
Q2 ’22 |
YTD ’22 |
Since Inception (1/4/2021) |
|
|
Headwaters Capital (Gross) |
-20.5% |
-29.2% |
-16.5% |
|
Headwaters Capital ((Net)) |
-20.7% |
-29.5% |
-17.5% |
|
Russell Mid Cap Index |
-16.9% |
-21.6% |
-3.9% |
|
*Performance for the Headwaters Capital portfolio has been calculated by Liccar Fund Services for the period presented above. **Individual SMA performance may differ from the results The composite performance (“portfolio” or “strategy”) is calculated using the return of a representative portfolio invested in accordance with Headwaters Capital’s fully discretionary accounts under management opened and funded prior to January 1, 2021. The performance data was calculated on a total return basis, including reinvestments of dividends and interest, accrued income, and realized and unrealized gains or losses. The returns also reflect a deduction of advisory fees, commissions charged on transactions, and fees for related services. |
Q2 ’22 Performance Review
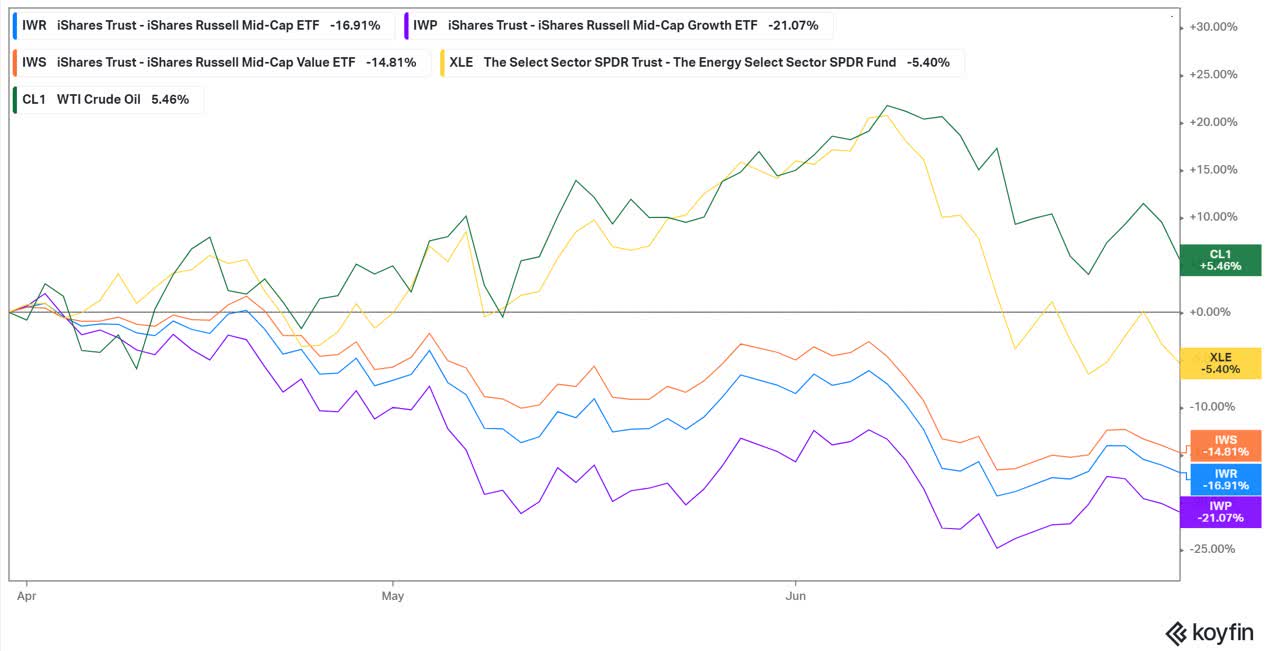
Second quarter performance was very similar to that of Q1, specifically that there was no place to hide other than in commodities. Oil prices rose by +5% during the quarter as a result of continued supply disruptions caused by the Russian invasion of Ukraine, although energy equities still declined by -5% during the quarter. The performance of energy equities continued to support the outperformance of value indices versus growth indices given that the value indices contain a greater weighting of energy companies.
The increase in commodity prices added to the already broad inflationary pressures seen throughout the global economy. The persistence of this elevated inflation caused an abrupt policy shift by the Fed, who after a prolonged period of easy monetary policy, is now focused on aggressively raising interest rates in a deliberate effort to slow growth and bring inflation back to more palatable levels.
The policy shift resulted in a selloff in bonds (higher interest rates), which pressured valuations across equities and other asset classes. Growth stocks continued to be acutely pressured by the rise in interest rates given that in a period of higher growth and higher interest rates, longer-term cash flows are less valuable.
As the data below shows, 80% of global stocks have posted negative returns YTD, with almost 90% of small caps posting negative returns YTD (and this was as of 5/17/22, before the small cap index declined another 7% through the end of the quarter). Even more incredible, the AVERAGE peak to trough decline for small caps YTD has been 42% (Source: Charles Schwab).
Source: Charles Schwab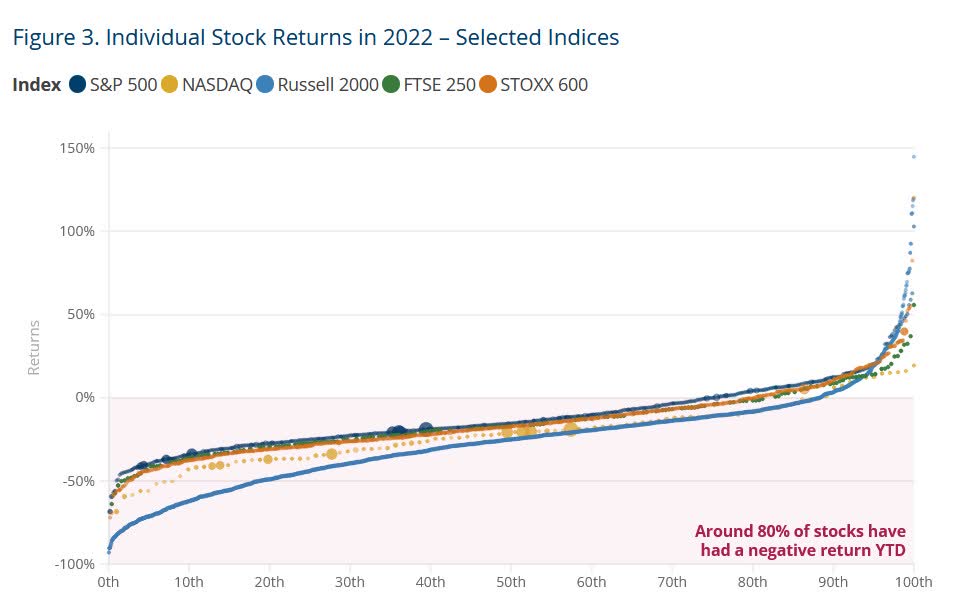
Looking Forward
As we sit here today, it’s hard not to see a slowdown in economic growth on the horizon. The Fed has been exceedingly transparent that they intend to raise rates in an effort to deliberately slow economic growth. Inflation is eating into consumer budgets, which is leading to a reduction in discretionary spend (albeit from elevated levels that were unsustainable). On the margin front, inflation is also likely to pressure corporate profits. As a result, there appear to be dual headwinds to corporate earnings going forward: slowing economic growth and margin pressure driven by cost inflation.
Despite these headwinds, there are reasons to be optimistic about future returns for the market. Consumers are still in a relatively healthy position as unemployment remains at record low levels, excess savings continue to be maintained for all income brackets (Appendix: Chart A) and balance sheets remain under-levered compared to previous economic cycles (Appendix: Chart B). Corporate balance sheets are also relatively healthy as debt service ratios remain well above prior cycle lows.
On the inflation front, there have been early signs that CPI is at or near a peak and could decline over the next year. Valuations have also suffered a significant correction and are not only below long-term averages, but are approaching historic lows (Appendix: Chart C) implying that the market is already pricing in some of the risks described above.
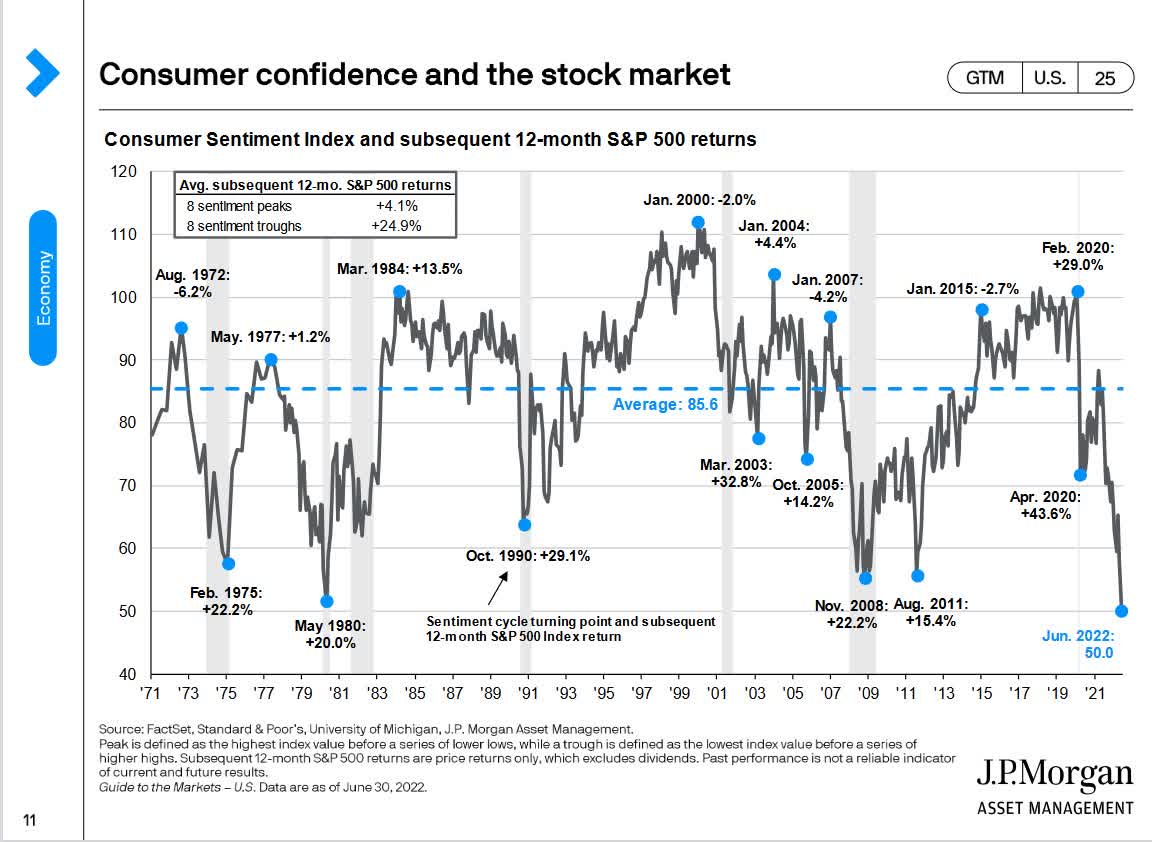
While the market is likely to be volatile in the short-term given the magnitude and speed of monetary tightening, it is important to remember that calling a bottom in the market is nearly impossible. I don’t know where the market will bottom, but I am certain that the market is forward looking and will reach a trough well before there is any data to suggest the economy is improving. Sentiment will feel terrible at this point (Appendix: Chart D).
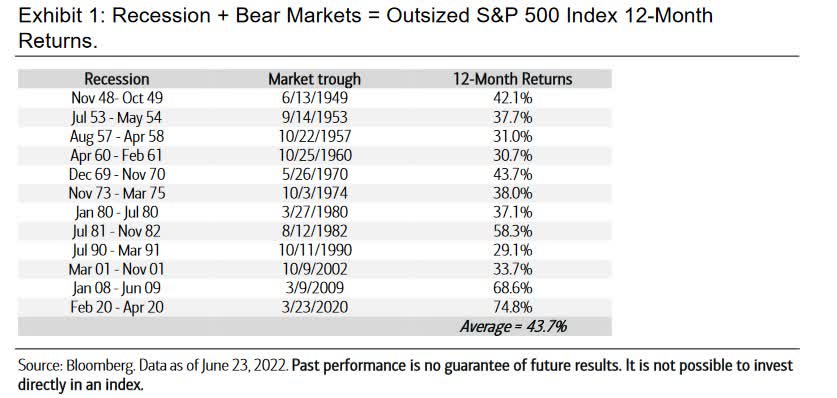
It is at these points in time when the market starts to price in all of this negative data and begins to look forward, posting strong gains off the bottom. As the chart below shows, the average 1 year return from the market trough is 44%.
What the analysis above ignores is that is nearly impossible to know when the market has troughed and the psychology of investing around these troughs makes capturing these returns even more difficult. Given that most investors in this portfolio are long-term investors, I thought it would be useful to use the periods above and compare how returns differed 2 years after the market trough based on whether you had invested before or after the market bottom.
I compared returns based on whether an investor had invested one year before the market trough (T-12), 6 months before the market trough (T-6), 6 months after the market trough (T+6) and one year after the market trough (T+12).
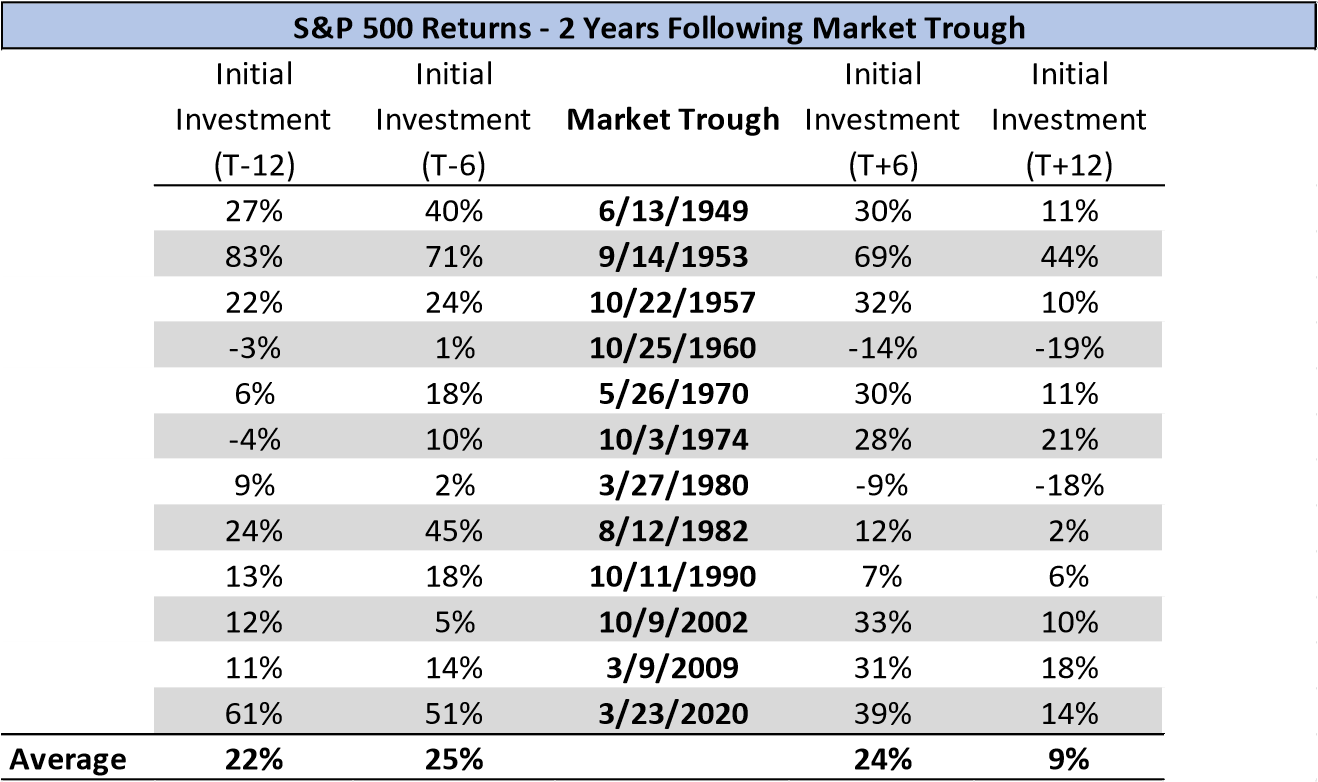
Interestingly, average returns 2 years after the market trough are largely the same whether you invested 12 months or 6 months prior to a market bottom or 6 months after a market bottom. However, notice how average returns decline dramatically if you invest one year following the trough. It is counterintuitive, but the data above demonstrates that remaining invested in the market is far more important than trying to time the bottom as missing out on the quick market rebound following a bottom can be detrimental to long-term returns.
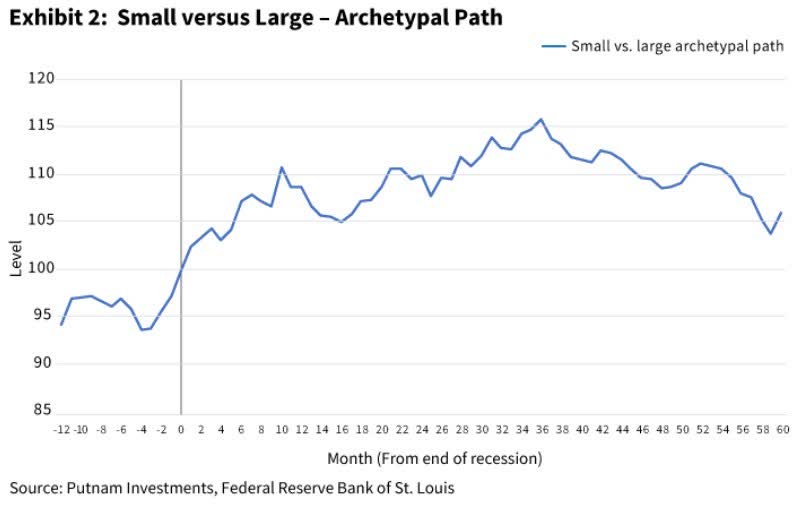
More importantly for this portfolio, small cap stocks tend to lead the market lower heading into a recession but lead the market higher coming out of a recession. Using data from the 5 recessions between 1980-2009 (data was compiled before COVID 2020 recession and is not as extensive as S&P 500 data pre-1980), Putnam investments shows that on average small caps lag large cap stock performance for the year leading up to a recession and then outperform for the 3 years following a recession.
If we are indeed entering a recession in 2022 or 2023, the relative small cap performance during this period has been no different as small caps have lagged large caps for the last 15 months.
It is periods like we experienced during the 1H of 2022 that reinforce the investment philosophy and portfolio construction underlying the Headwaters Capital strategy. The portfolio is comprised of competitively advantaged businesses with durable revenue and earnings growth potential that can weather whatever economic environment is ahead of us.
While the stock prices for most of our companies have declined, the long-term earnings power of these businesses remains largely the same. It is the long-term compounding of the earnings of our companies that will ultimately drive long-term share price performance and, as a result, I continue to believe the portfolio is well positioned for the future.
Q2 ’22 Portfolio Review
Top Contributor: American Financial Group (AFG) +1%. AFG returned +1% (inclusive of an $8 special dividend paid during the quarter). Underwriting returns continue to be strong across almost all of the company’s specialty lines of business. Returns from the company’s investment portfolio, specifically investments in real estate funds, have also been very strong. Going forward, AFG’s investment portfolio should benefit from higher interest rates as it has strategically repositioned its fixed income portfolio into shorter duration assets over the last year.
Top Detractor: Inotiv (NOTV) -63%. Inotiv’s share price was the poster child for volatility during the quarter. Shares initially sold off due to concerns around slowing biotech funding, which could negatively impact future growth for NOTV. Shares then rebounded sharply by +58% following the Q1 earnings report that showed accelerating momentum in both segments of NOTV’s preclinical CRO business, validating the roll-up strategy that NOTV is pursuing.
One week later, shares dropped by ~30% when the DOJ announced that it was pursuing legal action against a facility that NOTV acquired last year, citing non-compliance with regulatory standards.NOTV and the DOJ quickly settled the case with no fines or penalties and the facility is in the process of being closed. NOTV has noted that the facility accounted for less than 1% of the company’s revenue and was unprofitable. Taking a conservative estimate of facility closing costs and legal costs, I estimate that the total loss to NOTV could be ~$10mm.
This modest cost compares to ~$220mm of market cap lost following the DOJ announcement. Needless to say, I view the sell-off as extreme and does not reflect the ultimate impact to NOTV’s business and long-term earnings power. As of publication of this letter, NOTV shares have recovered +70% in Q3 as the market digests the limited impact of the closed DOJ investigation.
Trading Activity
Sells: SPS Commerce (SPSC). After beginning to trim the SPS position in Q1 following the Q4 ’21 earnings release, I fully exited the position in early Q2. New customer additions for the company showed early signs of deceleration in Q4 ’21 and I am concerned that broader weakness in retail spending will ultimately lead to slower growth than the company has forecast. Commentary from adjacent peers in the supply chain management industry also suggest that competition in SPS’ core EDI business may be increasing.
Additionally, part of the original thesis centered around the company’s shares trading at a discount to other high quality software peers. Given broader weakness in the software universe combined with share price appreciation for SPSC, that valuation discount is no longer present. The combination of slowing growth, increased competition and the potential for multiple compression drove the sell decision.
Buys: N/A. Similar to Q1 ’22, proceeds from the sale of SPSC were opportunistically deployed to add to existing holdings that presented attractive buying opportunities.
Given that there were no new positions added during the quarter and in an effort to provide transparency into the portfolio, a discussion of the portfolio’s largest position, Qualys, is presented below. Qualys has been held in the portfolio since inception.
Qualys (QLYS) – Cybersecurity Leader w/ Renewed Product Development Focus and Growing Sales Capacity
Summary Thesis
- Cybersecurity software portfolio that is critical to cyber defense and well positioned to take advantage of an increasingly open architecture IT network.
- Revenue growth acceleration from the rollout of new products combined with increased investment in sales and marketing.
- Overall cybersecurity industry tailwinds from a heightened threat environment.
- Multiple expansion in-line with peers as revenue growth accelerates. Multiple support from private equity appetite if revenue growth fails to accelerate.
Company Overview
QLYS was founded in 1999 and provides vulnerability management software to both SMBs and enterprise customers. Vulnerability management software provides a continuous view of security and compliance across all of a company’s assets including on-premise, end-points, cloud and mobile. The easiest way to think about QLYS’s original VM solution is that it provided a dashboard that monitored all potential threats to a network and helped IT departments prioritize which vulnerabilities were the highest risk.
QLYS was a pioneer in the industry as they were one of the first companies to offer a cloud-based software as a service (SAAS) solution as opposed to the traditional license offerings that proliferated at the time. While QLYS’ VM software has always provided an industry leading dashboard to monitor weaknesses, it provided limited functionality to respond to these vulnerabilities. More recently, QLYS has increased the functionality of its software through the rollout of Detection and Response capabilities (VMDR) and extended detection and response (XDR) capabilities in late 2021.
Source: QLYS Investor Day Presentation (6-13-18)
Cybersecurity Industry Overview
The cybersecurity space has been marked by a preference of customers for point solution expertise as opposed to a winner take all solution. This market structure is driven by the complex nature of assets that need protection, the dynamic nature of security threats and the critical nature of cybersecurity, which leads to a customer preference for quality over cost. Historically, cybersecurity was best served by firewalls, which provided a ring fence around assets that were physically located on a network.
Firewalls are increasingly becoming obsolete in the cybersecurity world as the network perimeter has effectively disappeared due to the growing adoption of SaaS solutions and new connected devices that connect to the network from multiple new endpoints. This trend has only accelerated following COVID. As more devices and software tools connect from outside of the traditional firewall perimeter, the importance of security monitoring tools such as VM, VMDR and XDR has increased.
In many ways, vulnerability management is the foundation of cybersecurity as it provides the dashboard for monitoring all potential security gaps. QLYS’ software can provide critical data about which assets are exposed to specific threats and can increasingly help IT departments prioritize and remediate these vulnerabilities.
Revenue Growth Acceleration
Understanding QLYS’s history is important to gaining confidence in QLYS’ ability to maintain revenue growth going forward. QLYS was almost perfectly positioned earlier this decade to take advantage of both the transition in the software market from license to SaaS solutions as well as the cybersecurity trend away from firewalls as devices increasingly moved beyond a physical perimeter. Given the large TAM, industry tailwinds and a market leading product, QLYS was able to growth revenues at a +20% CAGR from 2012-2018.
Even more impressive, QLYS was able to accomplish this growth with limited investment in R&D or its sales force. R&D as a percentage of revenues declined from 22% in 2012 to 16% in 2018 while S&M declined from 40% in 2012 to 22% in 2018. Consequently, QLYS operates with one of the highest EBITDA margins in the industry at 45%. The ability for QLYS to post such consistent revenue growth despite under-investing in product development and sales is evidence of the strong competitive positioning of QLYS’ software and the critical nature of the product.
However, QLYS’ focus on profitability eventually caught up with the company as revenue growth decelerated to 15% in 2019 and 13% in 2020. Over time, the cybersecurity market was becoming more competitive. QLYS saw increased competition from its top 2 competitors as Tenable (TENB) made a transition to a SaaS solution and Rapid7 (RPD) used IPO proceeds to aggressively pursue growth.
Additionally, customers began to expect a more comprehensive security offering beyond just vulnerability management as this solution was reaching maturity. It was no longer sufficient to only offer a dashboard of potential vulnerabilities, customers now expected products that detected, prioritized and responded to these threats.
QLYS’s VM product continued to be well positioned in the market, it just needed to be enhanced with detection and response capabilities (VMDR). QLYS also recognized the need to offer an extended detection and response (XDR), which ingests data from all of QLYS’ endpoints to provide better analytics for network threat prevention. QLYS began re-investing in R&D in 2019 and R&D as a percentage of sales has increased from 16% in 2018 to a projected 18% in 2022.
QLYS’ VMDR solution was rolled out in early 2020 and the XDR solution was introduced at the end of 2021. With new products being added to the portfolio, QLYS had plans to invest heavily in growing its sales force in 2020. However, COVID delayed this investment, yet to company remains focused on growing its sales force in 2021 and 2022.
With product development complete and sales force investment ramping, QLYS’ revenue growth has accelerated from +13% in 2020 to a projected +18% in 2022. QLYS should be able to maintain at least a mid-teens growth rate as a broader product portfolio enables cross-selling into existing customers and investment in sales and marketing supports new customer wins.
QLYS also maintains a net cash balance and continues to generate strong free cash flow given industry leading margins and minimal CAPEX. Historically, management has not been aggressive with capital deployment, but there are signs that this is changing. QLYS’ new CEO made his first acquisition in Q3 2021 and has stated that he intends to make more targeted acquisitions going forward. Inorganic growth can serve as another tool to help accelerate revenue growth as the company can acquire companies with additional functionalities that can be sold on top of the core VMDR solution.
Valuation
I expect QLYS to grow FCF at a low teens rate over the next 5 years as revenue growth is partially offset by margin compression due to the investments discussed above. Given QLYS’ healthy cash balance and strong free cash flow generation, FCF/share growth could exceed this rate if management utilizes cash for acquisitions or share repurchases (buyback also provides a nice backstop for shares during any market weakness).
I believe QLYS should trade at a 10% premium to the market given its competitively positioned product and attractive growth outlook. Based on these assumptions, QLYS should compound investor capital at a +14% CAGR over the next 5 years.
To the extent that my expectations for growth at QLYS are overstated, a healthy appetite from private equity for software assets with strong cash flow could provide an alternative way for shareholders to benefit. Thoma Bravo’s acquisition of Proofpoint in April 2021 provides an almost perfect comp for QLYS and the potential private equity bid. PFPT provides email security software and, like QLYS, saw its stock price lag the broader tech sector as revenue growth slowed and its multiple compressed as the market viewed email security as a mature industry.
Assuming similar multiples for QLYS implies a private equity bid that could represent 70% upside. I don’t expect QLYS to pursue a private equity transaction in the near term as I believe management is confident in the revenue growth acceleration from new products and sales force investments. However, the private equity appetite does provide good downside protection.
Investment Summary
QLYS sells a competitively advantaged cybersecurity offering that can continue to maintain market leadership given the company’s renewed focus on R&D. When combined with growing investment in the company’s sales force, revenue growth should sustain in the mid-teens range. Additionally, the company’s cybersecurity end market should see continued strong growth as corporations prioritize cybersecurity spend in an increasingly hostile threat environment.
FCF is expected to grow at a +12% CAGR over the next 5 years as revenue growth acceleration is offset by investments in sales and marketing. A fortress balance sheet with a large cash balance provides optionality for M&A and/or share repurchases to grow FCF/share at an even faster rate. Unlike many other software companies that trade on revenue multiples, QLYS has valuation support based on both public and private market free cash flow multiples. To the extent that revenue growth does not materialize as expected, an active appetite from private equity for software assets could provide an attractive exit for shareholders.
As always, if you have any questions, please do not hesitate to contact me.
Christopher Godfrey
Appendix
A: Household Savings Balances: Today v. Pre-Covid
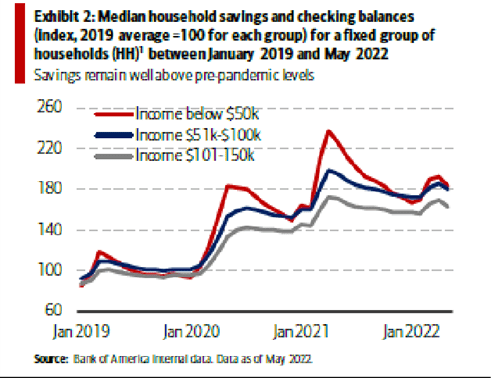
Chart B: Consumer Debt
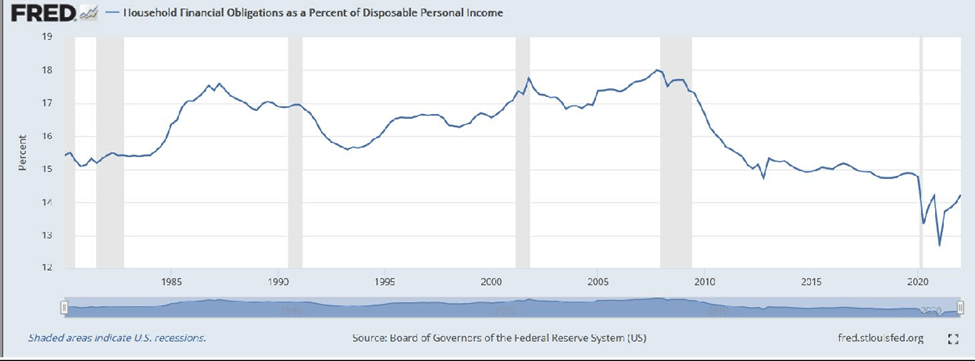
Chart C: Forward P/E Multiples
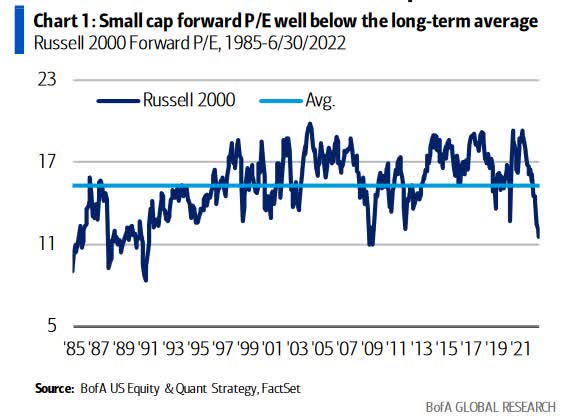
Chart D: Consumer Confidence and Stock Market Returns
Editor’s Note: The summary bullets for this article were chosen by Seeking Alpha editors.
Be the first to comment