

HDFC Bank – Indian Bank VJ
HDFC Bank Limited (NYSE:HDB) engages in the provision of banking and financial services, including commercial banking and treasury operations. The firm also provides financial services to upper- and middle-income individuals and corporations in India. Besides its country of origin, HDB also has major operations in the Middle East and Hong Kong. It is a subsidiary of Housing Development Finance Corporation.
As the following analysis will show, HDB maintains consistently high shareholder returns by having sustainable interest margins and operational efficiency. It has also shown prudency towards risk. Therefore, it can be expected that HDB’s returns will persist into the future. A buy or hold investment decision is thus suggested.
Profitability
Return on equity [ROE] is a primary indicator of a bank’s profitability and efficiency in utilizing shareholder capital. Figure 1 shows that HDB’s ROE has remained within the ranges of 17-16%. While this range is narrow, it is considerably higher than that of its primary rival. Additionally, it is also higher than the industry median in India (3.2%). The implication is that HDB’s shareholders obtained higher returns for their investment compared to those who invested in other financial institutions in India. Additionally, and as will be discussed in subsequent sections, HDB was operationally more efficient and more risk prudent compared to the average bank in India.
Finbox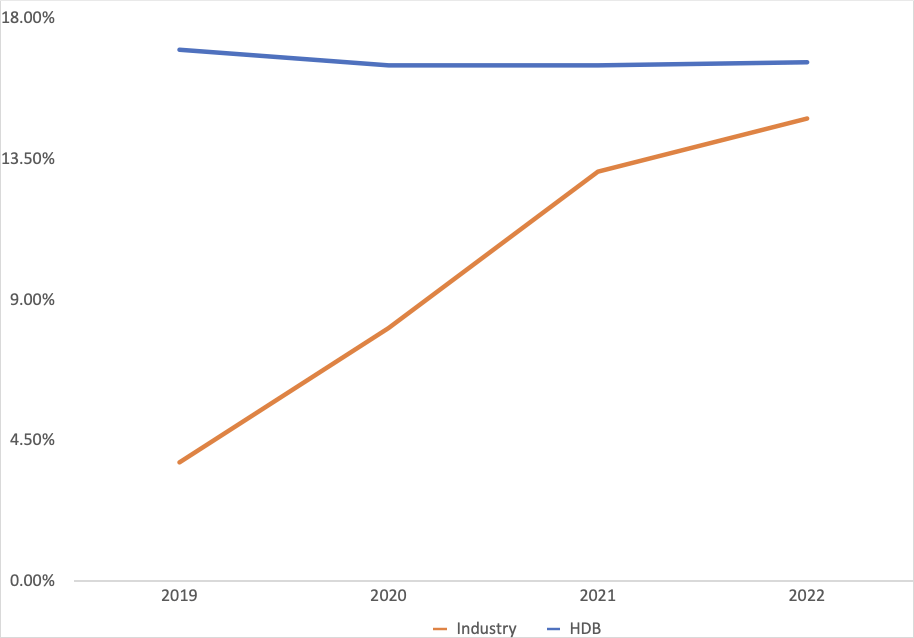
Figure 1: ROE trends
HDB’s primary activity is lending for a profit. Therefore, its performance on this front is of critical importance. One of the core measures useful in assessing HDB’s performance with regard to profitability is net interest margin [NIM]. This is the ratio between a bank’s net interest income and its total earning assets.
As Figure 2 shows, HDB’s NIM has been on a slight decline over the last four years. This outcome can be attributed to a general downward trend in interest rates charged by the Reserve Bank of India [RBI]. Specifically, the RBI had reduced the rate at which it lends money to commercial banks to record lows to ease the economic repercussions of the COVID-19 pandemic. This rate is an indicator of eventual commercial lending rates and suggests that HDB moved towards lowering its customer rates. Additionally, there has been consistent growth in earning assets during the four years. Nevertheless, HDB earned higher than average NIM compared to its rivals during this period.
hdfcbank.com ; icicibank.com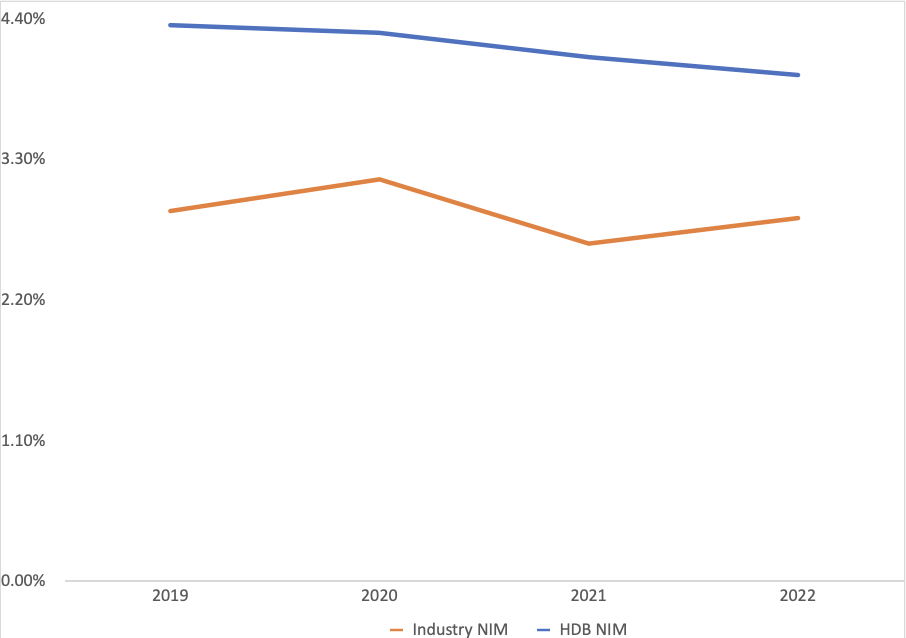
Figure 2: NIM trends
Against this background of low interest margins, banks in India have the option of focusing revenue generation through noninterest sources. However, Figure 3 shows this avenue’s importance in the revenue mix has grown steadily for HDB over the four years ending 2022. However, noninterest income has a limit in that in a nearly perfect market where customers primarily seek out commercial banks for services related to lending, excessive banking fees are likely to drive clients to a rival. It is likely that this realization is what led HDB’s rival into reducing the role played by noninterest income in its revenue mix and as seen in Figure 3.
hdfcbank.com;icicibank.com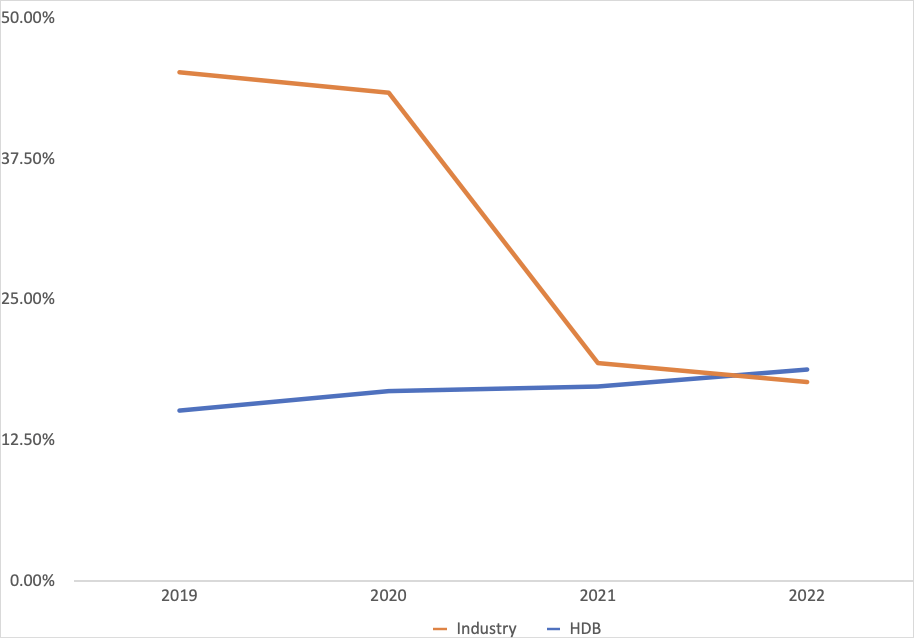
Figure 3: Non-interest income to gross revenue ratio trends
Besides having superior NIM performance, HDB also had above-average asset efficiency. This is assessed by the return on assets [ROA] ratio which measures how efficient a bank is at utilizing scarce resources in deriving profits. HDB’s superior asset returns are shown in Figure 4. However, it is necessary to note that HDB’s ROA is on a near plateau at around 2%, while that of its main competitor has seen a sharp rise over the last four years. While this does not cast doubt on HDB’s above-average performance, it suggests that the bank could learn from its rivals on ways to improve its asset utilization.
hdfcbank.com;icicibank.com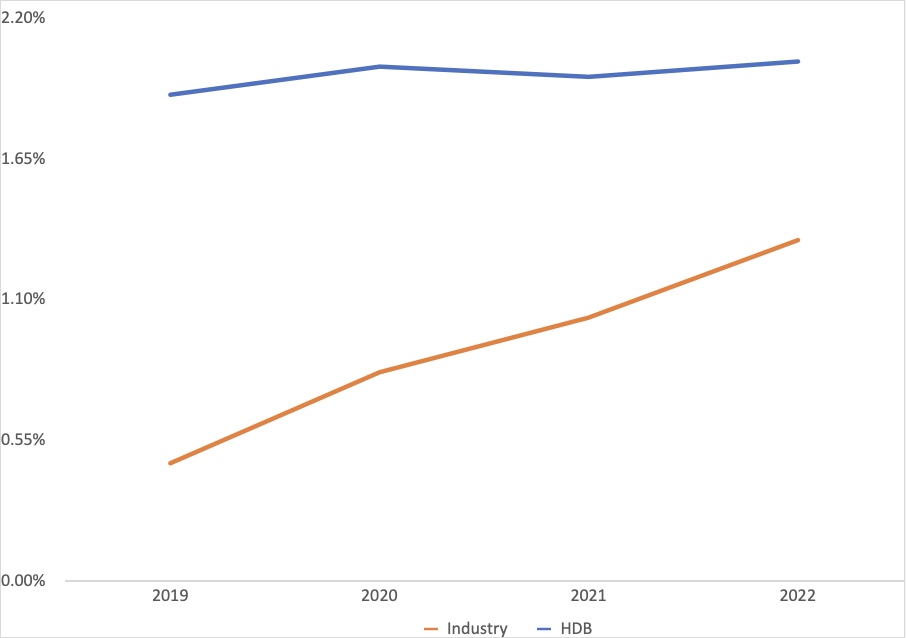
Figure 4: ROA trends
In a market characterized by low interest margins, as denoted in Figure 2, it is imperative that banks have stringent control over their operating costs if they are to derive residual profits. To assess management’s efficiency on this front, the ratio of operating costs to gross revenues is applied. Figure 5 shows that HDB has maintained a significantly lower operational efficiency ratio compared to its rival. This outcome has been attained despite HDB being larger than its competitors with respect to employee numbers. It is necessary to note that employee compensation often accounts for a considerable portion of operating costs in the banking industry. A subsequent inference is that HDB at the very least derived higher revenues per employee compared to its competitor. This is a major contributor to the bank’s net income as evidenced in the ROA discussed earlier, which is also a profitability indicator.
hdfcbank.com;icicibank.com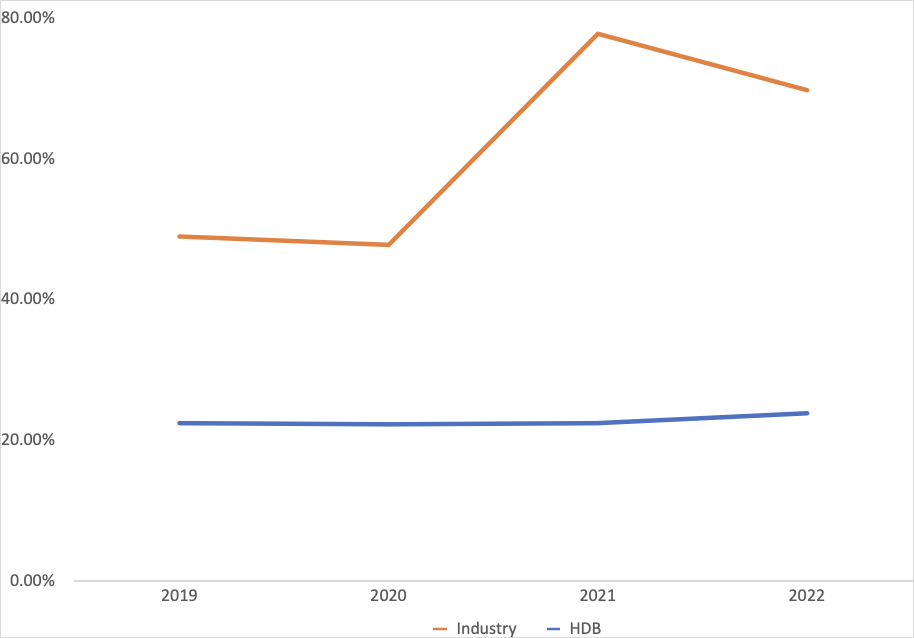
Figure 5: Cost to income ratio trends
Risk Analysis
Besides a consideration of profit, a risk analysis is also paramount in the banking industry. As entities that lend money with uncertain chances of repayment, nonperforming assets are a key indicator as these represent that portion of loans that are considered overdue and have little chance of repayment. Furthermore, low nonperforming assets [NPAs] suggests a stringent lending culture that provides greater repayment assurance. Therefore, the NPA performance shown in Figure 6 is reflective of these considerations. Namely, HDB has a lower risk outlook and better lending practices compared to its rival.
Hdfcbank.com;icicibank.com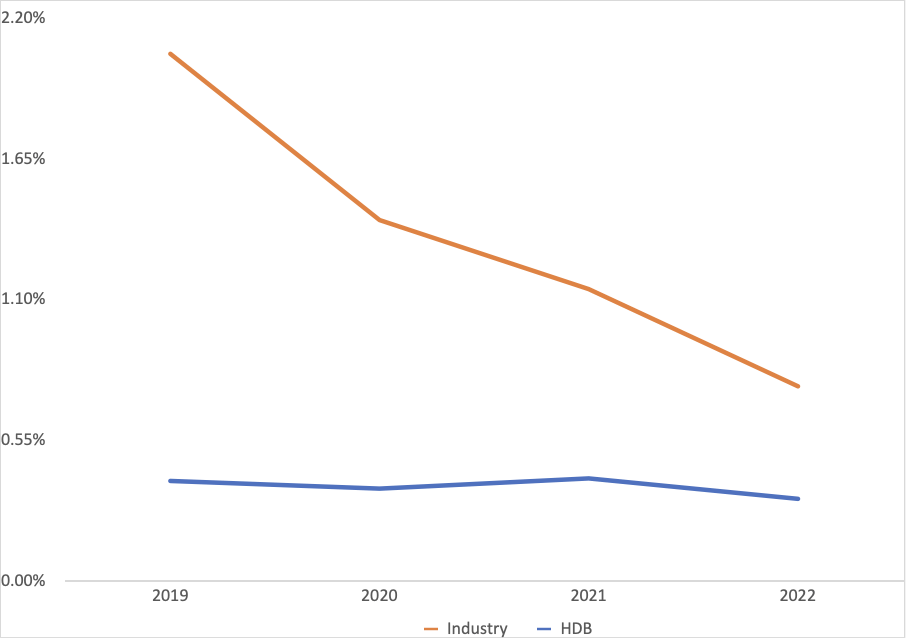
Figure 6: NPA to gross loans trend
Investment Suggestion
HDB has consistently maintained a positive ROE that is also significantly above the industry average over the four years ending 2022. This outcome is attributable to the bank focusing on its core business, as evidenced by it retaining a sustainable revenue mix that is not overly reliant on noninterest income. Moreover, the bank has demonstrated a lower operational cost to revenue ratio that further exemplifies its ability to earn shareholder returns.
Finally, HDB shows a prudent lending culture that is seen in the ratio of NPAs to gross loans. Consequently, a hold or buy investment decision is suggested with regard to HDB.
Be the first to comment