

Thinkhubstudio
Dear Partners and Friends,
Our portfolio remained volatile the last few months. The market prices of investments were generally stable in the first two months of the quarter, but a weaker September led the market & our portfolio to decline towards the end of the period. As mentioned in our last email update to partners, this was particularly acute among our newer positions established earlier this year.
|
Time Period |
Hayden ((Net)) 1 |
S&P 500 (SPXTR) |
MSCI World (ACWI) |
|
20142 |
(4.9%) |
1.3% |
(0.9%) |
|
2015 |
17.2% |
1.4% |
(2.2%) |
|
2016 |
3.9% |
12.0% |
8.4% |
|
2017 |
28.2% |
21.8% |
24.4% |
|
2018 |
(15.4%) |
(4.4%) |
(9.2%) |
|
2019 |
41.0% |
31.5% |
26.6% |
|
2020 |
222.4% |
18.4% |
16.3% |
|
2021 |
(15.8%) |
28.7% |
18.7% |
|
1st Quarter |
(39.2%) |
(4.6%) |
(5.7%) |
|
2nd Quarter |
(40.3%) |
(16.1%) |
(15.1%) |
|
3rd Quarter |
(18.9%) |
(4.9%) |
(7.2%) |
|
2022 |
(70.6%) |
(23.9%) |
(25.7%) |
|
Annualized Return |
4.5% |
9.5% |
5.6% |
|
Total Return |
|||
|
1 Year |
(78.4%) |
(16.5%) |
(21.1%) |
|
5 Years |
7.27% |
55.6% |
24.7% |
|
Since Inception |
41.5% |
104.3% |
54.0% |
However, we’re growing cautiously optimistic, as it feels like we’re getting closer to the end of this difficult period. From our perspective, valuation compression seems to be mostly finished within our investment universe. Markets have repriced share prices sufficiently (and sometimes overly so, as we’ll illustrate below), to account for the substantial interest rates increase this year + an expected recession in 2023.
Going forward, it’s going to be up to our companies to execute and prove to investors that their future earnings trajectories remain strong. As such, the future direction of our portfolio values should be more within our & our companies’ control, versus when we experienced broad-based valuation-driven selling earlier in the year3.
This doesn’t mean we’re out of the woods just yet. Markets will likely remain volatile over the next year, until the macro picture stabilizes. We’re still seeing high volatility even in the last few weeks. For example, Chinese ADRs experienced a one-day -20% drop on October 24th after China’s National Congress, as foreign capital flooded out of the market. One of our investments, Pinduoduo (PDD, which we plan to publish our write-up on in the near future), dropped – 35% that day, only to rebound +80% three weeks later. Sea Limited (SE) reported earnings last week, after which the share price rebounded +36% in a single day.
These types of price moves aren’t normal – they’re symptomatic of a market that remains “on edge” and is struggling to price these shares accurately given the mixed hurricane of macro and company-specific datapoints4. It’s an interesting time in the markets, and we will try to tactically take advantage of this volatility where we can.
Geographic Allocation % As of September 30, 2022

Our portfolio declined by -18.9% in the third quarter of 2022, versus -4.9% for the S&P 500 and -7.2% for the MSCI World indices. This brings our annualized return since inception to +4.5%.
We ended the quarter with ~46% of our assets invested in Asia, ~39% in North America, and the remainder in cash.
Reflections of 2022
Given the losses in the portfolio, I’m sure our partners have some questions as to what went wrong this year, and what we might take away from the period. We’ve had many one-on-one conversations with partners over the last few months (if you’re a partner and would like to chat, please reach out at any time). But I’m sure our other partners have similar questions too.
Typically, I usually don’t like to draw conclusions or lessons from an event, until we’ve definitively closed the chapter, and I’ve had some time to collect our thoughts and have all the data available on the table. I’m often afraid that if we start drawing conclusions pre-maturely, we might learn the wrong lessons – especially on specific positions we’re still actively managing through.
But in light of this atypical year, I thought it’d be helpful to list some general thoughts from this period earlier than usual5. Because of this, you’ll notice that there are more questions I’m asking myself, than actual answers. Some of the below were recurring questions, while others are questions that might not have been vocalized, but are questions that I myself would be asking if I were on the other side of the table.
The most obvious question that comes to mind, is why didn’t we sell more last year, when prices were still high? The truth is that we did sell a significant amount, but in hindsight obviously wish we were more aggressive with the sales.
For example, we owned the peak number of shares of Sea Ltd in Q1 2020, and steadily trimmed over the next two years. From Q1 2020 to Q1 2022, we trimmed ~39% of our shares over that period. However, the issue was that the investment continued to grow as a percentage of the overall portfolio, since the share price appreciated much faster than our sales (+620% from 1Q20 to 3Q21). This was a similar case for our other long-tenured positions as well.
So why didn’t we trim more aggressively and just hold cash? The answer is that at its core, I believe that holding cash is implicitly a market timing call. I certainly didn’t foresee a likely recession on the horizon so quickly after the turbulence of Covid already had on the economy. Even in late 2021, after it was clear interest rates would start rising, we were still operating under the assumption that rates would cause valuations to compress, but likely wouldn’t have an impact on the overall earnings trajectory. Given our expectations for strong earnings growth, we thought this could more than offset the valuation compression over time, and would still generate strong IRRs over a 3 – 5 year timeframe.
However, I was wrong on these assumptions. The Fed ultimately raised interest rates both higher & at a quicker pace than I was expecting. This caused multiples across our sectors to compress by 60 – 80% or more this year – which is impossible for almost any company to compensate for with earnings growth.
The bigger miss though, was the degree & pace these interest rates had on slowing global consumer demand – so much so, that it looks like we’ll likely be in a recession next year. This has an impact on our expectations for earnings, since a recession certainly lowers growth expectations.
The effect is that our original 2025 earnings estimates have been pushed out to 2027, for example, which impacts the stock price even further6. Especially for the types of companies in our portfolio, who rely upon this top-line growth to spread their fixed costs over, in order to reach unit economic profitability. This combination of lower valuations and lower near-term earnings expectations is what caused the magnitude of drawdowns this year.
Not recognizing that the degree of rate increases would ultimately drive the global economy into a recession, further compounded mistakes this year. With the capital from trimming the core positions, we under-wrote a couple of our new positions this Spring. However, these were underwritten under the “valuation compression, but no recession” scenario. While these companies are still likely to exhibit more earnings resilience than your average company, given their business models, it still remains to be seen the exact impact on their earnings next year. If anything, we probably would have been better off waiting for clearer evidence of economic impact, and been more patient in deploying this capital.
I’ve always tended to ask questions first, wait for hard-evidence, and then make decisions based upon those data-points. But given the murky macro & fast-moving environment earlier this year, perhaps the lesson is that we should adjust this strategy during such uncertain times. Perhaps we need to lean more conservatively when we don’t have clear answers / datapoints during these periods, and to trim positions proactively (assuming the worst, even if there isn’t evidence yet), and to be more patient in deploying new capital.
Second, were we too concentrated in our top positions over the last few years? While the question is valid (and still up for debate), I’d argue that the evidence from the last few years doesn’t necessarily support it.
For context, we’ve always had a “soft-rule” of contributing no more than 15% at cost when building a position. However, we’ve refrained from having a hard-limit on absolute position size – especially under our strategy, where early-stage companies often appreciate in price because the business models themselves are getting stronger7. As these young companies exhibit larger and more predictable earnings power, often as a result of them winning within a “winner-take-most” market and gaining scale advantages associated with that, they may deserve be a larger portion of the portfolio over time. As long as 3 – 5 year IRRs are attractive, and the business model resilience has improved, we’re often comfortable to hold them as they compound.
The reason that I say that the jury is still out on this issue, is that if we look at the drawdowns across our portfolio, our earlier-stage (i.e. younger) businesses in the portfolio declined just as much, if not more than our core positions8. If we had limited the position size, would we have redeployed this excess capital into the earlier-stage portion of the portfolio or into new investments, which would have exhibited similar declines? I don’t know. But we do know that simply equal weighting the portfolio for example, wouldn’t have helped improve performance this year. We’ve grappled with this issue for years now, and I still think there isn’t a “right” answer here (see our Q1 2018, Q3 2018, and Q4 2019 letters, for example). But it’s a topic that’s going to continue to be top of mind for us, for the foreseeable future.
Third, should we have more mature or “stable” companies at the top of our portfolio? Would doing so help mitigate volatility in the future and help act as an “anchor” in the portfolio? I’m sure if we owned mega-caps in our portfolio, it would have helped to stem some of the portfolio losses this year. Companies such as Microsoft (MSFT) or Apple (AAPL) have remained relatively resilient this year (albeit Amazon (AMZN) and Salesforce (CRM) are both still down over -50% from their highs). These companies’ business models are well-proven, and the market doesn’t have any concerns regarding their ability to survive this period. As such, the market has continued to reward them with stable valuation multiples, declining only -10 – 30% over this period.
The question is, while holding such mega-cap companies would benefit us during a recessionary period, is it the right decision to hold them throughout a full economic cycle? Especially since the timing of such recessions are difficult to predict beforehand? Would doing so help us generate higher returns over a 10-year period than otherwise?
We seek returns via two sources: earnings growth, and valuation expansion as the market appreciates the business model over time9. From our perspective, these mega-caps are relatively mature in their business lifecycles, and so earnings will likely compound at a slower rate in the future. Meanwhile, the businesses models are well-appreciated by the market, so there’s very little chance of mis-valuation / significant valuation expansion, besides increasing simply due to a lower interest rate environment. In other words, I’m just not sure what our edge is.
As such, we’ve always leaned towards optimizing the portfolio for what we believe would produce the highest returns over a full economic cycle, rather than just a downturn. Obviously if these mega-caps were to become so mis-valued, as to produce a similar IRR as our more nascent businesses, while having more proven models (and thus less risk), we’ll take a swing at them10.
But for the most part, I believe if our partners wished to own these mega-caps, it might be better for them to do so in other parts of their portfolio. In our Q4 2021 letter, I described our model as a “pill manufacturer”. I wrote:
“We solve an (investment) disease in a specific manner, and we (hopefully) do it well… We’re certainly not a general practitioner doctor, who can diagnose & refers a patient to multiple specialists, with the goal of managing their overall financial health (in our industry, that’s a job left to the wealth managers and institutional CIOs).
It’s why I actively encourage our partners to diversify the majority of their own portfolios away from Hayden. Not only is this healthy for our partner’s financial health, but in turn makes our partners more resilient to the bumps in investing, which selfishly benefits Hayden with stable relationships as well.
In investing, it’s inevitable that you’re going to face periods of poor performance. This is especially true for our portfolio, which is not only highly concentrated in a handful of businesses, but also have many characteristics in common – internet-based, early-stage business models, within the ecommerce or fintech sectors, etc.”
It wouldn’t be intellectually honest for these types of companies to be a structural part of our portfolio, when our skill-set leans towards businesses earlier in their life cycles. Our partners would be better suited by finding other “specialists”, who would likely do a better job in this space than us.
Admittedly, one way that having structural “anchor” positions could increase returns over a full- market cycle, is if we were able to utilize these positions as a source of cash during drawdowns. If we could get the timing correct, maybe we could use this cash source to reinvest into other stocks that have declined much more.
However, these types of opportunities only come around once every ten years or so. Is the additional return worth it, at the expense of potentially lower portfolio IRRs the other nine years? Also if we were to have “anchor” positions within the portfolio with the goal of lowered volatility, but at the expense of lower returns, perhaps we would probably be better off just holding cash itself?
I’m not sure the answer yet. But at the very least, we have a high tolerance for volatility, so that itself isn’t a large benefit to our model. Hopefully given our prior communications, we’ve conveyed this sufficiently, so our partners who are onboard should be aligned this as well.
Lastly, the question I’ve been thinking a lot about, is actually related to the business-side of Hayden. We’ve rapidly expanded over the last few years, and have been fortunate to have many like-minded partners join us. We’ve expanded our research resources, attended more industry conferences, conducted more public interviews, expanded our network of relationships, and gained access to investments / insights that we wouldn’t have otherwise.
However this has undoubtedly caused us to spend incremental time away from the portfolio itself. While expansion (and more AUM) is great, it’s never been our end-goal. Others might want to grow for growth’s sake – viewing AUM size or headcount as a badge of legitimacy / industry respect. But that’s never been the “KPI” we managed towards. In fact, we’re already “at scale”, so any incremental dollar we’ve generated actually goes towards reinvesting back into improving our research and breadth of available data.
I enjoy meeting new people and having conversations with others (it’s the best way I learn and generate new ideas). In a typical year, we’ll have hundreds of conversations, for example.
However, investing is also a creative endeavor – it requires free time to let the mind wander and synthesize thoughts. Some of my most productive days are those with empty calendars, which gives the freedom to research and “pull the thread” on early inklings of what might turn out to be important insights.
With a packed calendar the last couple years, I realize I’ve neglected this aspect of the process. Having the mental space to explore, discover new insights that others might not realize, and have that “ah-hah” moment, is what brings me joy in this business. It’s that internal fulfillment that gets me excited about running Hayden, rather than the external fulfillment or business-building that seems to drive many others in our industry. Our goal is to simply 1) compound our & our partners’ capital for the longest period of time possible, and 2) enjoying the process while doing it. We’re not in a rush, since our timeframe is in decades.
As such, I’ve been thinking whether it would be better for our process (and in turn our partners & performance), if I were to consciously slow down our metabolism. Over the years, I’ve realized that outside of redemptions / not reaching scale (which luckily hasn’t been an issue for our business), most funds shut down because either the founders burn-out or the stress of managing the business itself outweighs the joys of investing. If our goal is to compound for as long as possible, perhaps it would be better for us to dial-back the intensity to say 70%, but in return gain the mental energy to keep running for decades longer.
I’m still experimenting with this, and trying to find the right balance. Going forward, partners may see a lower public profile from us, and I’ll probably say “no” to more events / meetings (unless I believe these will ultimately have a direct positive impact on our performance and partners). Hopefully if we get this balance right, we’ll lengthen our runway and compound alongside our partners for a few decades longer.
PORTFOLIO REVIEW
Sea Limited (SE)
We’ve been investors in Sea Ltd for exactly 4 years now, as of this quarter. Over that time we’ve watched the evolution of a company from predominantly a republisher of mobile games, which just happened to be reinvesting all its profits into a fledgling ecommerce business – to one that now is the leading ecommerce platform across all of the Southeast Asia region with over 50% market share, in addition to self-developing one of the top grossing games of the past two years.
During this time, the company’s stock has had some equally dramatic changes as well. When we originally invested in the company 4 years ago, the market was essentially only valuing the gaming business (with zero value ascribed to Shopee), which equated to ~$4.5BN / $13 per share. Over the next few years, as Shopee started to gain traction and eventually became the dominant regional ecommerce platform, the stock price rallied to north of $370.
The company was experiencing high double / triple-digit GMV growth – 150% in 2018, 71% in 2019, 101% in 2020, and 77% in 2021. Just as GMV growth was normalizing at the end of 2019, the company received an extra shot in the arm, as Covid lockdowns forced residents to stay indoors and rely upon ecommerce for their daily needs (and resulting in many people’s first experience shopping online). Combined, this resulted in a 15x increase in the amount of goods sold on the platform, in just 4 years11.
However, this year has been a dramatic turn for Sea Ltd’s stock price, with its value declining – 80% this year, and has caused over half of our negative performance this year. As such, it’s crucial we reevaluate what happened with this investment.
2022 has been tough for the company, with the entire region now reopened after Covid restrictions the past few years. This means consumers are spending more time inside brick & mortar retail, while record global inflation has been a drag on household budgets as well. We can see via alternative data providers, that these macro factors are hurting competitors (Lazada, LZDA, and Tokopedia) as well, with some even exhibiting negative year-over-year growth in some months.
On its recent September Quarter 2022 earnings call, Alibaba (BABA) even confirmed this decline, stating: “In Southeast Asia, other order volume declined 6% year-on-year as COVID-related restrictions were lifted and offline shopping resumed.”
Meanwhile, Shopee is facing these headwinds as well, but managing to hold its own and is performing better (orders grew +18% y/y in 3Q 2022). It now offers fewer discounts than peers, while still maintaining stronger user retention and order growth. It seems that despite the industry headwinds, Shopee is still growing its market position, and is proving out the stickiness of its user base (which was a big debate among investors just a few years ago).
However, Shopee is also facing some company specific headwinds as well. The capital market environment has changed drastically over the past year, and the company is being forced to reach profitability several years before it originally intended (which I’ll discuss this in more detail below).
This means that the company had to cut multiple experimental projects this year (essentially call options in the business), such as:
- Testing whether the Shopee method of shopping would work in Europe (whether the low AOV, discovery-based method of ecommerce works in middle income Western markets);
- Closing down local operations in certain Latin American markets (except for Brazil, which was much further along in development), and transitioning to a cross-border model. In this case, I don’t believe it’s because the business model didn’t work (unlike Europe), but rather because going after so many markets at once would have used up too much capital. I wouldn’t be surprised to see Shopee re-enter these markets once the core business is sustainably profitable in a couple years, and is likely why Shopee didn’t fully shut down in these countries, but rather kept a cross-border “beachhead” to leave this option open.
- Laid-off hundreds of staff at its Garena office in Shanghai. This happened in September, just two months after Phoenix Labs announced that they have 10 new games under development. Partners will remember that Sea acquired Phoenix Labs, the maker of Dauntless in January 2020 (see our Q4 2019 for more details;). Reading between the lines, my guess is that Garena is shrinking its Shanghai team and shifting it to Phoenix instead, which has a more proven track record in game development.
- The company has also laid-off ~10% of its staff in its Singapore, Indonesia, Philippines and Shenzhen offices. The move is aimed at improving general efficiency, as it’s likely some positions have become redundant with the slower growth in the business this year and having hired ahead of expected higher growth last year12.
Some investors might question why Sea decided to expand so aggressively in the first place, and whether this is a largely sign of mismanagement. However, I’d actually argue the opposite, as given the facts that we had at the time, it’s what I personally would have done if I were in management’s shoes as well. It’s always easy to find fault in hindsight, but it’s better to judge past actions by trying to remember back to only the facts available at the time.
Two years ago, it looked as if ecommerce in might be experiencing a step-function shift in adoption, especially in emerging markets (we spoke about at length this in our Q2 2022 letter). Pre-covid, Shopee was just starting to show signs of winning the market, in a competitive ecommerce industry.
However ecommerce penetration was still in the single-digits, and the majority of the region’s population had never gotten into the habit of shopping online yet. While these existing customers were sticky (given the high order frequencies), Covid forced a wave of “new customers” onto the internet, creating a brand new cohort of over a hundred of million of people who have no loyalty to the incumbent platforms, up for grabs13. In addition, it wasn’t clear whether ecommerce demand would re-base at a higher level even after Covid ended (pulling forward ecommerce adoption by several years), or whether that demand would prove temporary and revert back to prior trend-lines.
If you’re Shopee, you had two options:
- Spend aggressively on new customer acquisition to capture as much of this new “wave” of customers, knowing that once captured, these customers tend to exhibit relatively high retention on the platform (based on historical cohorts). If you can retain the #1 position, it will not only grow the user base, but also create even stronger incentives / retention for your existing customers. More merchants will be attracted to your platform given you have the largest pool of demand, and thus you’ll be able to offer a wider selection than competitors, while more merchant competition also ensures lower prices & greater willingness for merchants to spend on high-margin advertising / commissions. Additionally structural profitability could be pulled forward, since fixed businesses costs could also be subsidized across a larger number of orders. Even variable costs, such as logistics, would decrease. Higher order volumes makes the 3PL industry more efficient, and thus structurally lowers per parcel delivery costs.
- Or you could spend more conservatively, despite having well-funded competitors (Lazada being backed by Alibaba, and Tokopedia merging with Go-Jek and soon IPO’ing on the IDX). In this scenario, you’re greatly at risk of losing the market leadership position, and thus weakening the flywheel dynamics described above. In ecommerce, the “rule of thumb” is that the #1 player makes 80% of the industry’s profits, #2 gets 20%, and #3 is break-even and constantly at risk of attack by new entrants. By giving conceding the leadership position, your own terminal value is at risk, since once these new customers build loyalty elsewhere, it’s much more expensive to get them back and subject to adverse selection (if you can lure away users from your competitors with promos, those are probably low value-customers to begin with, and your competitor will also be in a stronger position to fight back, than they would be otherwise given their larger revenue pool).
So with these two options, Shopee chose the first. Especially with Garena providing a gusher of cash flow that had an uncertain expiration date, it was time to press the advantage while they had it. Sea doesn’t disclose how many Monthly Active Buyers they have, but we estimate the output of this decision, is that they successfully grew MAUs by ~3.5x from pre-Covid to over 100M monthly shoppers today14.
In addition, we can see this in the order count growth, from ~440M orders per quarter in Q4 2019 to ~1.8BN orders per quarter today (~4x increase) in SE Asia. We also know they successfully gained market share during this period, with both Lazada and Tokopedia reporting slower GMV growth and resulting in Shopee capturing over 50% of market share by the end.
So while the core business decisions seem sound, what about those “call options” listed above? Wasn’t that just a waste of resources? I’d also disagree with the notion, as I think it was the right move to make with the information available at the time.
The primary example of wasted capital I hear from shareholders, is Shopee’s expansion into Europe, India and Latam (in that order). Sea had been testing a cross-border initiative in Brazil since 2019, when the stock price was even lower than it is today (we talked about this in our Q4 2019 letter). I wrote back then:
“This is the first test for the ecommerce marketplace outside of its Southeast Asia home base. Will the platform’s fun and addicting features overcome a lack of local knowledge and presence? It’s hard to predict consumer behavior and how accepting users will be to a platform – especially one that’s a foreign culture and 10,000 miles away. The only way to know is to experiment and watch the results closely.
Empirically though, it seems that what consumers find entertaining in Asia, generally translates well to Brazil (and Shopee really is as much an entertainment platform, as an ecommerce one).
For example, just look at the top 10 free apps in Brazil. Two are utility messaging apps, so we’ll ignore those (WhatsApp and Facebook Messenger). But among the remaining eight apps, they’re all entertainment based and overwhelmingly Asian. Four are from China (Kwai, TikTok, VStatus, TikTok Lite), two from Singapore (Free Fire and Shopee, both Sea Ltd apps), and one from the US (Instagram). The commonality is that all these apps are experts at creating addictive habits, as evidenced by their personalized recommendations, avg usage time, number of logins per day per user, etc.”
That experiment in Brazil worked, and led Shopee to start thinking maybe the mobile-first, low- AOV, high frequency, shopping-as-entertainment model doesn’t just resonate with Asian consumers, but perhaps is applicable to other emerging markets as well. Especially since the early cohort data the company was getting, was starting to track even higher than Shopee’s core Asian markets. So clearly, something was resonating.
Shopee started to experiment in different markets (especially where it could leverage its consumer data from the Garena / Free Fire division), to see where the boundaries of this shopping model would be. It started experimenting in other Latam countries, then India, then Eastern Europe, and eventually Western Europe in the last two years.
But like most experiments, to find the one big winner, there’s also going to be a lot of failures. The European experiments just didn’t gain the same traction (except for Poland, where it still has a cross-border initiative), and were shut down within just a few months of launch.
For example, Momentum Works quotes someone who worked on Shopee France’s launch, stating: “We do not know why, but French consumers just do not respond to our campaigns… We could run marketing to get them to the campaign landing page, but they do not convert.”As such, Shopee France was such down in four months – which I view positively, as it gives evidence of management’s ability to quickly cut failed experiments given disconfirming data.
India was gaining traction on the other hand, but the government banned Sea’s Free Fire game earlier this year under the notion of banning Chinese apps (despite Sea being Singaporean), thus introducing regulatory risk. It was clear that it would take several billion dollars and years before Shopee India could be self-sustainable. With the loss of its local cash flow engine (Free Fire) and also the heightened regulatory risk of being shut down at any time (and worse, perhaps only after they had invested billions of capital), the company decided to withdraw.
This left Latam, which has proven to resonate greatly with consumers. But given the current state of the capital markets and aforementioned shortened profitability timeline, the company has also decided to convert other Latam markets into an asset-light cross-border model (shipped from its Brazilian warehouses), and focus on its Brazilian operations first.
So what did this world-wide tour teach Shopee and its investors? Well we now know that Europe doesn’t work as a potential market. Indian consumers resonate with the business model, but the hostile regulatory environment and long-road to profitability make the market untenable. Latam shows the most promise, with Brazilian order growth at +150% y/y, and also little competition in the high frequency / low-AOV ecommerce market15.
In my opinion, these are valuable lessons that couldn’t have been learned without actually testing and experimenting in these markets. Perhaps it’s true that Shopee may have been better off staying within their core SE Asian markets in hindsight. But if you don’t experiment as a tech company, how would you know for sure? Innovation is the lifeblood of a tech company’s longevity, and you don’t know the edges of your boundaries, unless you test and experiment.
So what was the price of this tuition? Probably not as high as most would think.
We estimate that the India experiment cost the company ~$200-300M, having been spent mostly on user acquisition, subsidizing merchants with 0% commissions, and subsidizing logistics (similar to its early SE Asian playbook). The European and other Latam markets (ex- Brazil) were much smaller in terms of addressable markets, and we estimate cost a combined ~$350M in total.
So in total, the “failed experiments” cost the company ~$600M. This is definitely a large number. But when viewed in context of the market cap ($175 Billion) or cash on its balance sheet (~$11.8 Billion) a year ago, it doesn’t seem as crazy. This equated to the company spending just 0.3% of its market cap, or 5% of its total available cash on these test markets. These three regions combined constituted well over $100 Billion in potential revenues, and tens of billions in profits, if the experiments showed promise and Shopee could expand its addressable markets.
More importantly, even though in hindsight the capital would have been handy in the current environment, I’m actually glad to see the management team willing to push the boundaries and experiment – and equally important, pull the plug quickly when it shows that the experiments aren’t working.
As a long-term investor in the company, I view these decisions as a net positive. It also provided some more evidence around how the company thinks about capital allocation & strategy, even if the ultimate outcome didn’t pan out this time.
Given the drastic decline in stock price over the last year, it’s obvious that the bigger question the market cares about is “will Sea be able to cut costs quickly enough, to become profitable and survive”.
All this discussion about strategy, expanding into new markets, etc. is great – but it doesn’t matter if the company runs out of cash in the short-term. All of the business value lies in the terminal value – so we obviously need the business to continue operating and get to self-sustainability, if we are to have any hope of realizing the eventual terminal value.
We can actually see this in the way the market is pricing the shares. For example, Mercado Libre (MELI) and Coupang (CPNG) are both ecommerce companies operating in international markets (Latin America and South Korea, respectively). If we look at 2025 sell-side estimates, the street is projecting Mercado to make ~$3.1BN EBITDA in 2025, while Coupang is projected to make ~$1.4BN EBITDA by 2025.
At a ~$45BN and ~$34BN enterprise value, respectively, it looks like the market is pricing these companies at ~15x 2025 EV / EBITDA for MELI and ~24x 2025 EV / EBITDA for CPNG16. Additionally for Mercado, approximately half of its profits are expected to come from the Fintech business, which tends to carry much lower valuation multiples17. On very rough math, if we were to use similar multiples as Nubank (a leading digital bank in Latam) to value and strip out Mercado’s fintech business, that would imply the market is currently valuing the ecommerce business at ~25x 2025 EV / EBITDA.
Meanwhile, it looks like the sell-side is expecting ~$3.5BN in profits from Sea in 2025. While we expect much higher profitability and think the market is likely under-estimating how quickly margins will inflect, let’s use these sell-side number for consistency’s sake, and to better understand what the market’s currently pricing in. So let’s do some rough math…
Of that $3.5BN, approximately ~$700M is expected to come from Garena, with the market assuming the gaming business will continue to steadily decline in the absence of any new games (even though as mentioned above, Phoenix Labs currently has 10 new games in development). Gaming studios are valued at ~8x EBITDA in the market today, which would imply ~$5.6BN for Garena, conservatively.
Additionally, Sea Money is expected to contribute ~$550M in 2025. At the aforementioned 5x fintech multiple, that’d imply ~$2.8BN valuation for Sea Money.
Sea Ltd is valued at ~$32BN in market cap today18. The company has ~$7.3BN in cash as of last quarter, of which $4.2BN is likely reserved to pay the convertible debt that matures in a few years. That leaves ~$3.1BN of excess cash. The market is currently debating how much (if not all) of the cash will be spent, before the business can be self-sustainable. For the sake of being conservative even further, let’s assume the entire excess cash balance will be spent on the road to break-even. That means that after stripping out the Garena and Sea Money businesses, the market is currently valuing Shopee at ~$23BN. The market’s expecting Shopee profits to be ~$2.2BN at that point, implying ~10.7x 2025 EV / EBITDA for the ecommerce business.
Obviously, this is far lower than how Mercado and Coupang are being valued in today’s market. In fact if Shopee were to be valued in-line with those at ~25x 2025 EV/ EBITDA, that would imply that Sea Ltd.’s overall valuation should be $31BN higher, or +97% versus today’s price19.
Based on this, I believe the market is currently implying that the company has ~50% odds of bankruptcy, or at least will need to raise additional equity and significantly dilute the stock – of which both scenarios seem extremely far-fetched (and management has already signaled that raising additional equity is not anywhere in their plans before achieving self-sustainability)20.
If the market were confident in Sea’s ability to become profitable without raising additional cash, the shares would likely be trading for at least double today – and this is even using very conservative profit assumptions and using MELI and CPNG’s (arguably depressed bear-market) multiples as comps.
(In fact, these multiples look even more conservative if we just use Bank Jago as a comp. Bank Jago is one of the largest digital banks in Indonesia, and is publicly traded on the IDX. It’s currently valued at ~$4.3BN USD market cap, despite only having ~$520M in loans receivable vs. Sea Money’s $2.1BN. Sell-side estimates have Bank Jago making ~$280M EBITDA in 2025, thus valuing the company at ~15x 2025 EBITDA. This is 3x higher than Nubank’s current valuation. Using a Bank Jago multiple would value Sea Money at ~$8.3BN).
So why am I confident that Sea will be able to weather through this period and soon turn a profit? Well first, we have to understand what the growth strategy was prior to this year, and what changed.
Sea’s team has always looked to the Chinese ecommerce platforms as inspiration, with Forrest Li even stating that Shopee was built as an adaptation of Taobao (Alibaba) for the local market.
In terms of its customer acquisition spend though, we believe that Sea was following another Chinese ecommerce company – Pinduoduo (also a portfolio investment of ours).
PDD and Shopee are very similar businesses. Both started out with low-AOV, un-branded items, geared towards attracting lower income households (less than $4K USD household disposable income, per year). PDD’s AOV is $6 USD for instance, while Shopee’s is ~$10 USD.
Additionally, both have extremely high retention and order frequency. In 2021, PDD’s customers ordered an average of 70x per year (5.8x per month), while Shopee’s customers ordered 68x per year (5.7x per month). Alternative data providers also indicate that both PDD and Shopee have above industry customer retention, with Shopee one-year retention being twice as high as its competitors.
Because of this dynamic, both PDD and Shopee have spent aggressively on customer acquisition in the past few years. For example, we calculate that PDD has spent >100% of its reinvestable cash into Sales & Marketing, up until Q1 2021. During this period, the company grew to over 800M active customers in just 6 years. Considering that China has ~1.1BN mobile internet users, this equates to ~73% of people with access to the internet, purchasing something on PDD within the last year.
Pinduoduo Sales & Marketing Spend (Source: Hayden estimates; Sales & Marketing, as % of Reinvestable Cash)
|
1Q18 |
2Q18 |
3Q18 |
4Q18 |
1Q19 |
2Q19 |
3Q19 |
4Q19 |
1Q20 |
2Q20 |
3Q20 |
4Q20 |
1Q21 |
2Q21 |
3Q21 |
4Q21 |
1Q22 |
|
|
Revenue |
1,385 |
2,709 |
3,372 |
5,654 |
4,545 |
7,290 |
7,514 |
10,793 |
6,541 |
12,193 |
14,210 |
26,548 |
22,167 |
23,046 |
21,506 |
27,231 |
23,794 |
|
(-) COGS |
319 |
388 |
775 |
1,424 |
873 |
1,595 |
1,833 |
2,037 |
1,830 |
2,662 |
3,260 |
11,526 |
10,746 |
7,898 |
6,559 |
6,516 |
7,160 |
|
(+) Change in net working capital |
14 |
5,820 |
479 |
528 |
499 |
592 |
668 |
799 |
809 |
915 |
956 |
933 |
973 |
1,188 |
1,121 |
1,493 |
1,523 |
|
(-) G&A |
29 |
5,801 |
306 |
322 |
236 |
278 |
437 |
346 |
338 |
395 |
369 |
406 |
352 |
434 |
335 |
420 |
592 |
|
(-) R&D |
73 |
186 |
332 |
525 |
667 |
804 |
1,127 |
1,272 |
1,473 |
1,662 |
1,805 |
1,951 |
2,219 |
2,329 |
2,422 |
2,023 |
2,669 |
|
Reinvestable cash |
978 |
2,155 |
2,440 |
3,911 |
3,267 |
5,205 |
4,785 |
7,936 |
3,709 |
8,389 |
9,732 |
13,598 |
9,823 |
13,573 |
13,311 |
19,766 |
14,896 |
|
S&M |
1,217 |
2,971 |
3,230 |
6,024 |
4,889 |
6,104 |
6,909 |
9,273 |
7,297 |
9,114 |
10,072 |
14,713 |
12,997 |
10,388 |
10,051 |
11,366 |
11,219 |
|
S&M/Reinvestable cash |
124% |
138% |
132% |
154% |
150% |
117% |
144% |
117% |
197% |
109% |
103% |
108% |
132% |
77% |
76% |
58% |
75% |
|
Active buyer |
295 |
344 |
386 |
419 |
443 |
483 |
536 |
585 |
628 |
683 |
731 |
788 |
824 |
850 |
867 |
869 |
882 |
We can also see that once this level of penetration was achieved, the management team deftly pivoted from away from aggressive marketing, going from spending ~132% of reinvestable cash on S&M in Q1 2021, to just ~75% a year later. There simply weren’t any more new customers to acquire, and combined with a high repeat purchase rate, it didn’t take much marketing to get customers to come back to the platform.
As you can see in the chart below, all of this cash quickly flowed to the bottom line, and operating margins went from -28% in 2019 and -16% in 2020, to +28% as of Q2 2022. From the time management decided to dial back marketing spend in Q1 2021 to today (1.5 years), margins have improved over +46%.
Pinduoduo Operating Margins
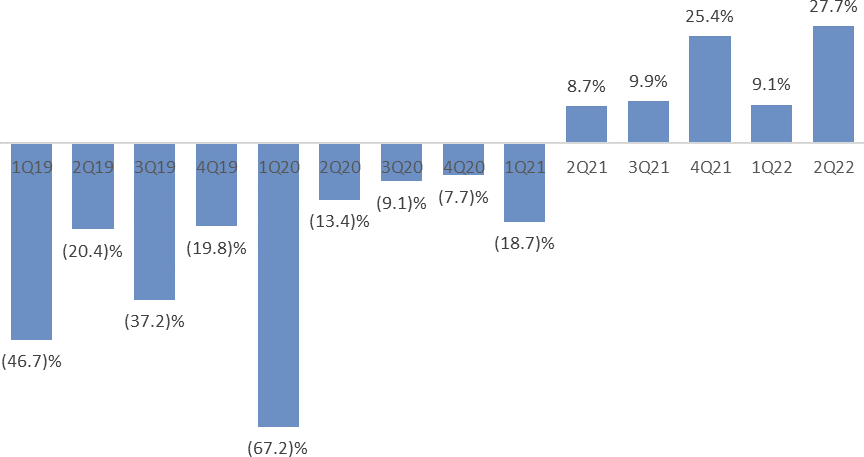
Source: PDD Financials
It seems to us that Sea originally planned to follow a similar playbook. In fact if you run the same calculation of Shopee’s S&M spend vs. reinvestable cash, you’ll notice a similar rate of spend as PDD pre-2021, averaging ~110% between 2018 – 2021.
Shopee Sales & Marketing Spend (Source: Hayden estimates; Sales & Marketing, as % of Reinvestable Cash)
Reinvestable Cash |
2018 |
2019 |
2020 |
2021 |
|
Revenue |
826,968 |
2,175,378 |
4,375,664 |
9,955,190 |
|
– COGS |
812,210 |
1,570,458 |
3,026,759 |
6,059,455 |
|
+ Change in Working Capital |
372,810 |
782,060 |
1,526,170 |
1,276,220 |
|
– G&A |
240,781 |
385,865 |
657,215 |
1,105,295 |
|
– R&D |
67,529 |
156,634 |
353,785 |
831,703 |
|
= Reinvestable Cash |
79,258 |
844,481 |
1,864,075 |
3,234,957 |
|
Sales & Marketing |
705,015 |
969,543 |
1,830,875 |
3,829,743 |
|
S&M / Reinvestable Cash |
889.5% |
114.8% |
98.2% |
118.4% |
Shopee Sales & Marketing Spend
Source: Hayden estimates; Sales & Marketing, as % of Reinvestable Cash
However the key difference is, that due to the current macro environment, it looks like Shopee is going to need to pivot away from this strategy early (at least temporarily). There are ~460M mobile internet users in SE Asia, but we estimate that Shopee only has ~100M monthly active buyers, for a penetration rate of just ~22%21. This is less than ~1/3rd the penetration rate PDD achieved, before it dialed back its customer acquisition spending, and helps explain the thinking behind Shopee spending so aggressively over the last few years.
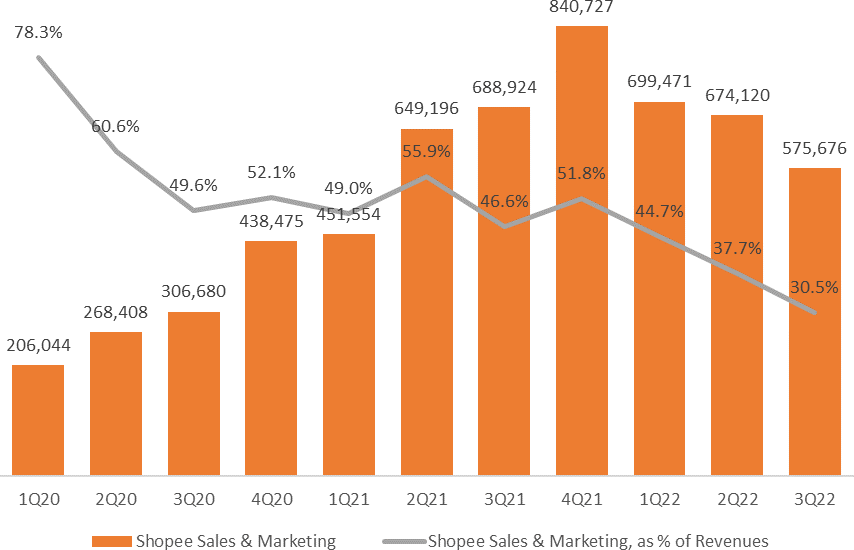
But over the last year it’s become clear that the macro environment has shifted, and Shopee has been reducing its marketing spend ahead of schedule. In fact, we can see that S&M spend has been declining in the past few quarters, and has decreased as a % of revenues as well (from 52% in 4Q21, to 45% in 1Q22, to 31% in 3Q22). As a % of GMV, S&M spend reached the lowest level in its history at ~3% this quarter (the 2nd lowest was 1Q20 and 3Q20, at the start of Covid, both at ~3.3%).
While hard to know for sure, our guess is that the management team was reluctant to cut this spend early on, since the market is still competitive, and doing so would open an avenue for other platforms to take market share, and thus putting their terminal value at risk (i.e. Option #2, mentioned previously). Making a decision like this isn’t as simple as flipping a switch (contrary to what some investors seem to think). It’s a significant decision that involves contracts with KOLs, brand ambassadors, branding events with metro operators, etc. In addition, cutting all advertising and the promotions that customers have come to love suddenly would only hurt the brand – it’s better to ease customers into it.
But with both Lazada and Tokopedia starting to talk about cost reduction (and Tokopedia actually needing more funding, and currently in the market looking for capital), the risk of these competitors taking advantage of Shopee’s pull-back is far lower. In fact, data sources have shown that Shopee has even gained market share this year, despite the marketing reduction22. Given this, in addition to some of the broad-based cost cuts at Sea this quarter, we believe that the company has shifted its mentality and feels more comfortable being more aggressive on this front, in the last few months. As such, we’re expecting to see an even greater reduction in marketing spend over the next 12 months.
So how does this help Shopee get to profitability? Well if we look at where the losses are currently coming from, the largest costs are Brazil (~$260M per quarter) and HQ costs (~$330M per quarter)23. We expect Brazil’s investments to continue for the next few years, but we have reason to believe that HQ costs have peaked on an absolute level, or at the very least shouldn’t grow much in the near-term. If we exclude Brazil (since it’s a conscious growth investment), and considering that “other” market losses and SE Asia (ex-HQ) losses will be non-existent / positive going forward, that just leaves ~$1.3BN in HQ that need to be covered, before Shopee’s unit economics turn positive.
Shopee Unit Economics (Source: Hayden estimates; CIMB estimates)
|
1Q21 |
2Q21 |
3Q21 |
4Q21 |
1Q22 |
2Q22 |
|
|
# of Orders (CIMB Estimates in Blue) |
||||||
|
SE Asia + Taiwan |
1,065,000 |
1,320,000 |
1,584,000 |
1,843,000 |
1,698,000 |
1,787,000 |
|
Brazil |
35,000 |
77,000 |
108,000 |
140,000 |
168,000 |
193,000 |
|
Others |
3,000 |
8,000 |
17,000 |
34,000 |
20,000 |
|
|
Tota l |
1,100,000 |
1,400,000 |
1,700,000 |
2,000,000 |
1,900,000 |
2,000,000 |
|
EBITDA per Order (ex HQ) |
||||||
|
SE Asia + Taiwan |
$ (0.12) |
$ (0.14) |
$ (0.11) |
$ (0.15) |
$ (0.04) |
$ (0.01) |
|
Brazil |
$ (2.76) |
$ (2.18) |
$ (2.12) |
$ (2.00) |
$ (1.52) |
$ (1.42) |
|
Others |
$ (9.67) |
$ (6.63) |
$ (4.71) |
$ (3.76) |
$ (1.90) |
|
|
Tota l |
$ (0.24) |
$ (0.28) |
$ (0.27) |
$ (0.32) |
$ (0.23) |
$ (0.16) |
|
EBITDA per Order (incl HQ) |
||||||
|
HQ Cost (Total Orders) |
$ (0.13) |
$ (0.13) |
$ (0.14) |
$ (0.12) |
$ (0.16) |
$ (0.17) |
|
HQ Cost (SE Asia Only Orders) |
$ (0.13) |
$ (0.14) |
$ (0.15) |
$ (0.13) |
$ (0.18) |
$ (0.19) |
|
Tota l |
$ (0.38) |
$ (0.41) |
$ (0.41) |
$ (0.45) |
$ (0.40) |
$ (0.33) |
|
EBITDA Breakdown (CIMB Estimates) |
||||||
|
HQ Cos t |
(143) |
(185) |
(232) |
(246) |
(305) |
(331) |
|
SE Asia + Taiwan |
(125) |
(185) |
(169) |
(271) |
(67) |
(18) < Positive in 3Q22 & onwards |
|
Brazil |
(144) |
(182) |
(229) |
(280) |
(243) |
(261) |
|
Others |
– |
(29) |
(53) |
(80) |
(128) |
(38) < Closed down these markets |
|
Tota l |
(412) |
(581) |
(683) |
(877) |
(743) |
(648) |
On its Q2 2022 earnings call, the company stated:
“Even though we have stopped providing guidance, our focus for the rest of the year remains very clear, which is to continue to improve efficiency by both deepening monetization and optimizing our cost structure. We will be more tightly managing our operating expenses, such as marketing costs and the logistics costs while also gradually increasing monetization across various income streams with a focus on the high margin ones.”
– Sea Ltd, Q2 2022 Earnings Call
In other words, the company expects to achieve profitability via a combination of 1) increasing revenues via raising commission and advertising take-rates (essentially 100% incremental margins), while 2) reducing costs, especially marketing and logistics. To cover the remaining ~$1.3BN HQ costs, this equates to needing find another ~16% of margin in order to become profitable over the next year.
In its more recent Q3 2022 earnings call, management also reiterated their goal to be EBITDA break-even for Shopee overall by year-end 2023. We believe this target also includes Brazil, which indicates Southeast Asia may break-even as soon as next summer.
Note, this new YE 2023 target is a full two years ahead of the 2025 target given on the Q4 2021 earnings, just eight months ago (March 2022). On that call, the company stated “we currently expect that by 2025 cash generated by Shopee and SeaMoney collectively will enable these two businesses to substantially self-fund their own long-term growth”
This accelerated profitability timeline is impressive (it requires some real organizational flexibility) and makes the company stronger in the long run. But there’s a cost in the near-term. Growth over the next year is likely going to be slower than the previous budget, since this profitability will be achieved by reining in marketing spend while monetizing the platform quicker.
So on the marketing cost side, we’re expecting marketing costs to decline as a percentage of revenues and GMV in the short-term, which will help with overall profitability. Sales & marketing are by far the largest cost line-item, making up ~31% of total Shopee revenues, or ~3% of GMV. If we’re correct and Shopee follows a similar path to PDD, it’s possible we’ll see these figures drop by half over time.
For example, PDD’s sales & marketing spend was ~59% of revenues and ~2.7% of GMV in 1Q 2021. After the company pivoted, this contributed +23% of margin, declining to ~36% of revenues and ~1.5% of GMV within just 18 months24. Most notably, the company continued to grow both its GMV and user base despite this marketing reduction, thus attesting to the platform’s natural stickiness for retaining users (which Shopee exhibits also).
While Shopee has a more burdened cost structure, due to the underdevelopment of SE Asia vs. China, we do expect the cost structure to follow a similar directional trend (although likely not as efficient to the same degree, in the medium term)25. We expect marketing costs decrease to 2.5% of GMV next year, which would contribute at least +10% of margin improvement y/y.
Additionally, the company has also been increasing commissions across all countries in the last few months, most recently in the Philippines (as of September 1st). We’re also hearing that Shopee is starting to ask merchants to cover a greater portion of the logistics costs, which is an extra couple % of GMV as well. Lastly, the company is also starting to charge more for payment processing fees this quarter (which are ~2% of GMV, or ~21% of revenues), unless users use ShopeePay.
All combined, we’re looking for take-rates to rise at least another 100bps by next summer, which will also contribute another +12% to margin improvement.
As long as Shopee is able to pull these two levers, it shouldn’t have a problem being profitable on its core business within the next 12 months. Afterwards, that would just leave the Brazil investment, at a current ~$1.1BN annualized. With the recent Shopee break-even target of 2023, it sounds like the company is confident that the SE Asia business will be able to make enough profits by next year-end, to cover the Brazil losses.
But even if not, Garena currently produces ~$290M EBITDA per quarter (~$1.2BN annualized). Admittedly, Garena is harder to predict since games are hit-driven, and thus it’s hard to predict demand. However even if the Garena continues to decline to say ~$800M, this will still substantially cover the remainder of the Brazil cash burn. Also Shopee will keep growing its profits, as well as Sea Money is expected to be cash flow positive next year, which will also help close the gap.
Put it all together, and I think the market will have much greater confidence in the company’s ability to be self-sustainable (and thus take the bankruptcy scenario off the table) within the next 9 – 12 months. At that point, I wouldn’t be surprised to see Sea’s stock price trading more in- line with its peer valuations.
Since the market seems to be pricing in a potential bankruptcy or fire-sale type scenario though, we should understand what that could look like (even if we think it’s a remote possibility). The good news is that at these levels, the potential downside seems extremely limited.
One way to see this, is to examine the amount of capital that has been raised by external equity & debt holders, combined with the amount of Garena profits that have been earned from gaming customers and then reinvested into building Shopee26.
By our calculations, a total $16BN has been raised from outside equity and debt holders since 2016. On top of this, Garena has also generated ~$7BN in EBITDA during the same period, most of which has been reinvested into building Shopee27. We consider this ~$23BN to be Sea Ltd’s “replacement cost” – although, I’d argue that it would likely cost much more for a new competitor to recreate the business today.
Sea Ltd Replacement Value (Source: Hayden estimates)
Sources of Capital
|
Total External Capital |
16,172,684 |
|
+ Garena Profits |
7,358,459 |
|
= Total Funding |
23,531,143 |
|
vs. Market Cap |
32,000,000 |
|
= Return on Capital Injected |
1.4x |
|
Use of Capital |
|
|
Ca sh |
7,295,678 |
|
+ Shopee Sales & Marketing |
7,694,177 |
|
+ Sea Money Loans Recei vable |
2,136,101 |
|
+ Research & Development |
2,592,089 |
|
+ Other (incl. Shopee Merchant Subsidies) |
3,813,098 |
|
= Total Capital |
$ 23,531,143 |
|
memo: Cash, as % of Total Capital |
31.0% |
|
memo: Shopee S&M, as % of Total Capital |
32.7% |
|
memo: Sea Money Loans, as % of Total Capital |
9.1% |
|
memo: R&D, as % of Total Capital |
11.0% |
|
memo: Other, as % of Total Capital |
16.2% |
Shopee was spending much of this capital in the past few years, during a period when new internet users were just starting to go online, and didn’t have any loyalty / consumer habits built up yet. In fact, Google – Bain – Temasek’s 2022 joint internet report cites 100M new internet users came online in the last 3 years alone in SE Asia. Now that this large influx of users, spurred by Covid forcing online adoption, have come online and built loyalty to certain platforms, it would likely be much more expensive to steal them away.
We would argue that research and development, sales & marketing, and merchant subsidies are “growth investments”, which will benefit the future growth of the business, rather than “maintenance” spend. Sales & marketing is largely targeted towards new customer acquisition (versus trying to retain existing customers), and merchant subsidies were necessary to build up the supply-side of the marketplace & solve the “cold-start problem” in the early days of the platform.
If a new entrant wanted to replicate Shopee’s business, they would have to offer far lower commissions than Shopee’s current rate, in order to convince a merchant to devote time away from Shopee. In addition, they would also likely offer subsidized shipping and other costs until the new entrant is able to gain equal scale / provide as many orders as Shopee does today28.
We’d argue that to achieve this, the new entrant would have to spend just as much, if not more, than Shopee spent on the merchant subsidies (since Shopee did this in a less competitive, and thus less expensive time for the industry).
So the question is, does Shopee as a business create more value for the ecosystem, than the raw capital that went into it. While the profits to shareholders aren’t obvious yet, if the answer to the former is “yes”, then I would argue that the business has latent earnings power, and the ability to flex this muscle is up at their own discretion.
And with the entire business trading at just a 36% premium to the capital that went into it, there’s not much downside left, if we believe the business truly is more valuable to its stakeholders as an ongoing operation, than sold for scraps.
Additionally, even if it takes longer to than expected to get expenses right-sized and reach profitably, we don’t think the company is in as dire a liquidity position as the market seems to expect.
As of Q3 2022, the company had ~$7.3BN of cash and short-term investments on its balance sheet. As mentioned above, we believe the company will err on the side of caution and will try to set aside ~$4.2BN of this to pay the convertible debt due in a few years, leaving ~$3.1BN of excess cash. In fact on its most recent earnings call, the company even confirmed this, stating: “We aim to continue to maintain a net cash position, after budgeting for the full retirement in cash of the outstanding convertible bonds, and assuming no external funding”
The company spent ~$1BN per quarter in negative FCF each of the first two quarters this year, so the market was looking at this and saying that if the company can’t get spending under control, they might only have a year of cash left on the balance sheet. However, it’s key to note that of this ~$1BN per quarter, over half of this was spent on capex (mostly Brazilian logistics)29.
Additionally, the most recent 3Q 2022 report showed a drastic reduction in FCF burn, to just ~$460M, a -53% reduction from 2Q 2022. The company has stated that this will improve even further in 4Q. As such, the market’s implied “bankruptcy scenario” odds should drastically come down soon.
This capex spend is also under the company’s control. Not spending it would curtail the company’s progress in Brazil for instance (shipping times would be longer, and fulfillment costs less efficient). But if it came to it, the company could likely shut this off temporarily without affecting its core SE Asian business.
In fact, the company could even shut down the entire Brazilian operations, which would further reduce the capital outlay by ~$1.1BN per year. In this scenario, Garena would be able to immediately cover the HQ costs, and the overall company would be EBITDA positive immediately. Shopee could then continue improving its unit economics, and become self- sustainable without Garena’s support within 6 – 9 months.
Another option if the company found itself in dire need of cash, is to simply run down the Sea Money loan book30. In addition to the $7.3BN of cash & short-term investments, Sea also has another $2.2BN in loans receivable – these are loans the company has been making off its own balance sheet to grow the Sea Money digital bank business. Altogether, the company would have ~$9.5BN of liquidity.
Management has indicated they expect Sea Money to be FCF positive bv 2023. But if the situation demands it, the company could likely put Sea Money’s growth on hold, and redirect the capital currently being used for loans to fund Shopee’s losses. Combined with some of the actions above, this would provide more than enough runway for Shopee to get its costs in order (and if it were to shut down Brazil, it likely wouldn’t need this Sea Money capital in the first place).
The point of all this, is to say that we don’t think Sea’s financial position is as dire as the market currently thinks. While the cash burn may seem high, we’ve already seen this turn in the third quarter, and believe this has peaked. We should see substantial improvement on this front, over the next 12 months.
Even if getting to cash flow positive takes longer than expected (vs. the current 12-month expectation), we do think the company also has more than enough liquidity to buy it at least an additional several years of runway. Lastly, we believe what the company has built is worth far more than the ~$23BN of raw capital that went into it. Even in a situation where the company is sold for scraps, we believe there would be willing buyers for the company, either in pieces or as a merger / acquisition with another global ecommerce company31.
Admittedly, the company is facing multiple headwinds in the near-term. Accelerating the business model’s profitability timeline by several years is one thing, but to do it in the middle of a potential global recession where revenue growth won’t be as strong (and thus unable to spread out the costs across a larger number of orders) is especially hard. Nevertheless, we think they have multiple levers to do so and achieve core profitability in the next ~12 months – it’s just going to be messy / take some time, and entirely possible the market will want to see some results before giving the stock price any credit32.
But at a $32BN market cap, I think the odds are strongly in our favor. This valuation implies $2.8BN for Sea Money (5x 2025 EBITDA), $5.6BN for Garena (8x 2025 EBITDA), and that the company will use its entire excess cash balance – which in turn implies a 10.7x 2025 EBITDA valuation for Shopee. All of these numbers are also very conservative (for instance if we used a Bank Jago multiple instead, Sea Money would be valued at $8.3BN). At these levels, it just seems like there isn’t much downside left in the shares, and the market is likely too pessimistic here.
SmartRent (SMRT)
Earlier this year, we initiated a position in SmartRent. SmartRent is the leading “smart home operating system” software provider for multifamily owners and operators in the United States. Its primary products include smart access keyless entry, smart thermostats / climate control, and water leak detection. Other offerings include self- guided tours for prospective renters to view available units, resident & staff management software (Sightplan), and parking management for operators to easily manage resident and guest parking.
Key to note, is that the company doesn’t make any of the hardware itself (except for the central control unit – SmartHub / FusionHub), instead opting to partner with hardware manufacturers such as Assa Abloy (OTCPK:ASAZF), Honeywell (HON), Google (GOOG, GOOGL) , LG, Amazon (AMZN), etc. At its core, this is a high-margin software company, that also installs 3rd party hardware in order to generate software revenues.
The company was originally founded by Lucas Haldeman, who was the former Chief Technology Officer at Colony American Homes, one of the largest single family rental owners in the United States. After struggling to find a comparable technology solution to allow more efficient property management, Lucas founded Smartrent in 2017 to address these needs.
Over the last five years, we’ve seen the product resonate greatly in the industry, with the largest real estate owners and public REITs signing on as early adopters. In just a few years, the technology has been deployed across ~504K units nationwide, with another ~811K units committed by customers to be deployed in the next 2 years. These existing customers also own an additional ~5.4M units within their portfolios (out of an estimated potential addressable market of ~21M units in the US).
These owners are seeing ~20 – 50% ROIs on their capex spend, through a combination of increasing rents (as tenants are willing to pay more to live in a tech-enabled unit) and operational efficiencies. Because of this strong return profile, many of these customers have already publicly announced that they intend to roll out the solution for the majority of their portfolio over the next few years33.
In another sign of the customer’s appreciation for the product, SmartRent has never lost a customer in its history (i.e. 0% churn), while having grown its Annual Recurring Revenue (ARR) by ~10x in the last two years.
The company should generate ~$180M in revenue this year (2022), while growing at a +47% CAGR to 2026. The business is currently at a financial inflection point, from negative operating margins today, to an estimated over +$100M in annual Free Cash Flow within a few years.
While this may seem like an overly optimistic scenario given the financial profile today, we have relatively good visibility into this, considering 1) most of the operating expenses are relatively fixed (Research and Development, G&A, etc.), 2) the strong expected ARPU increases in software pricing (ARPU grew +25% y/y last quarter, for example), and 3) the stickiness & committed units pipeline, in combination with the independently publicized capex plans of their largest public REIT customers (which they talk about on their own earnings calls, public filings, and industry conferences). We’ll discuss these points in-depth later on. The company has also repeatedly confirmed that they plan to be profitable towards the end of 2023, and also FCF positive around the same time.
At today’s price, the company is currently trading at a ~$550M market cap. However, the company also has $210M of cash and no debt on its balance sheet. We expect the company to utilize a further ~$60M of cash on its road to profitability next year, thus implying an Enterprise Value of ~$400M.
If our projections are correct over the next few years, that would imply a ~3x 2026 EV / FCF valuation – something that we view as extremely cheap, especially considering the historical 0% churn, likely +20% y/y growth even after 2026 as the company penetrates further into the long- tail of multifamily owners (with revenue visibility from committed units), and anticipated 70% software margins at scale34.
Products
In serving its customers, SmartRent offers various products and services in an effort to streamline and automate much of the property management operations. SmartRent’s solutions include:
Access Control: Branded as Alloy Access, this is a cloud-based access control system for common areas of multifamily building, such as a building entry, common areas, shared amenity spaces, etc. Hardware utilized includes control panels, smart access locks, intercoms, etc. and fully integrate with the owner / operator’s property management software. This allows real estate operators to remotely monitor building and resident activities, and provide temporary access for guests or deliveries.
Asset Protection: SmartRent aims to protect properties, via early detection of water leaks and abnormal humidity or temperature changes. This is especially important for owners, as ~70% of multifamily damage is due to water damage and major repairs can cost upwards of $500,000+. Early detection via leak sensors placed under appliances (sump pumps, toilets, washing machines, dish washers, etc) help alert property management, and automatically generate a work order for maintenance staff to investigate.
Community Manager: Proprietary software that allows operators to automatically enable customized settings. For example when a resident moves out, the unit status can automatically switch from “occupied” to “vacant” mode, which removes access from all locks, creates work order for maintenance staff to turn over the unit, and automatically adjusts the thermostat to save energy while vacant. In addition, the mobile app allows community staff to remotely manage work orders and control access. This software also integrates with all popular property management software, such as Yardi, RealPage, Entrata, etc.
Community Wifi: In order to connect SmartRent’s hardware, operators can choose to add community wifi to maintain a consistent connection (in addition to the SmartHub’s built-in cellular data connection). This provides building-wide wifi coverage. This coverage can then be re-sold to residents for in-unit use, which saves residents from needing to engage with a third- party internet provider, and also provides owners with an additional source of income (owners collect the spread between the wholesale internet pricing & monthly fee charged to each resident).
Parking Management: Alloy Parking provides an integrated software system and database, that allows owners and operators to assign and re-assign parking spaces, see in real-time live parking space availability, monitor & validate authorized resident parking, and also monetize extra spaces for guest parking access. As part of the solution, sensors are also placed in parking spaces to provide real-time data on which spaces are available. Residents also are granted access to an online portal, where they can add / remove registered vehicles, edit vehicle details, review assigned spaces, and provide guests with parking access.
Self-Guided Tours: Self-Guided Tours allow prospective renters to search available units online, and schedule a completely contactless self-guided tour without needing to interact with any building staff. The solution verifies the identity of each prospective renter, and then grants a temporary access code to the renter to view the unit at the selected time slot. The prospective resident can temporarily access the unit, amenities, etc. on their own schedule. By not needing leasing staff chaperoning, it greatly expands the available times that residents can view their interested units (say after work, at 8pm on a Wednesday), and thus increases the building’s conversion rate. Additionally, it greatly expands the amount of tours that can be conducted during popular time slots (for example, before / after the workday), since it’s no longer limited to staff availability. The product also provides data feedback to owners and operators, such as the amount of time the prospective renter spent in the unit, what amenities they visited, etc., which helps leasing staff gauge the prospective renter’s interest level.
Sightplan: Sightplan is a software operating platform, that provides automated answering, resident engagement, field service and maintenance task management, inspections management, and due diligence and audit management services for real estate owners and operators. For example, residents can submit maintenance requests via the mobile app, which will then automatically be forwarded to the appropriate maintenance staff’s task management portal. Building management can keep track of maintenance staff productivity, by seeing in real-time which tasks are completed, which units still have outstanding requests and the amount of time it’s been outstanding, etc. Additionally, building staff can communicate directly with residents through the app, while also providing a recorded timeline of the communication & tasks between the staff and the resident. The product also helps streamline the building inspection process, by providing a detailed checklist and audit trail of unit conditions, needed renovations / improvements, etc. Sightplan was acquired by SmartRent in 2022.
SmartRent’s Product Offerings
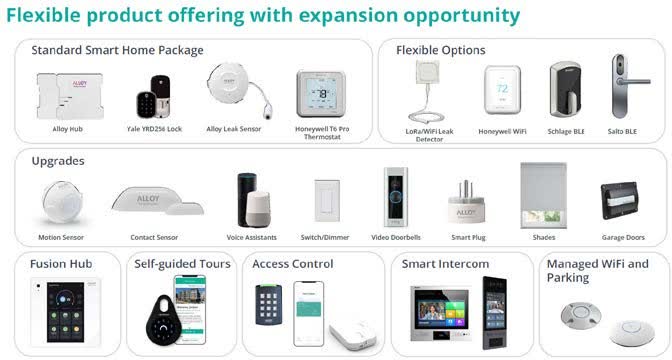
Source: SmartRent
SmartRent’s Use Cases
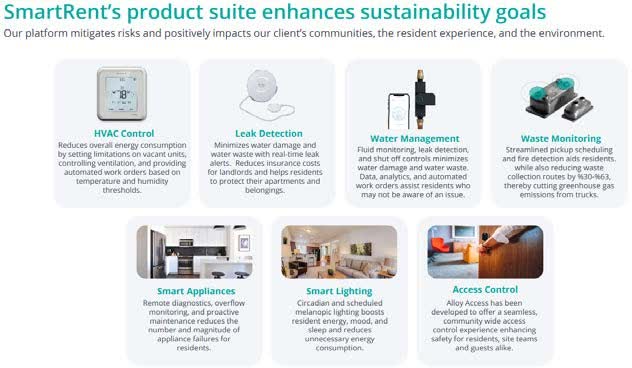
Source: SmartRent
It’s important to note that unlike some competitors, SmartRent doesn’t make much of the hardware itself (except for the Smarthub and Alloy products), and instead chooses to take an open ecosystem & asset-light approach (an advantage, we’ll discuss below).
Instead, the company buys & resells the hardware to customers (disclosed under “Hardware Revenues”), then sends field agents to install the equipment on their behalf (“Professional Services” revenue), and then charges a monthly fee for the software & SmartHub (“Hosted Services” revenue).
Hardware and Professional Services are largely pass-through revenues, whereby the company has indicated they expect to make ~15% gross margins. Meanwhile, the profit driver is within Hosted Services (where the high-margin software piece is classified) and is the segment that’s most important for investors.
Industry & Competition
The smart tech residential market is still very under-penetrated in the United States. According the US Census Bureau, there are approximately ~48M rental units with the US and ~20M rental properties35. Of this, ~20M units are owned by individuals (~41% of the total), while professional investors owned ~22M units (~45% of the total), with co-ops and non- profits owning the remainder.
However, the primary value-proposition for residential smart tech, is on improving operational efficiency for multi-family operators with dedicated building staff. With this a factor, we believe the real addressable market is classified as rental properties with >5 units (large enough to have dedicated building staff), and owned / operated by professional real estate companies.
Among this cohort, there are ~21M total units that are managed by professional management companies or agents directly employed by the owner.
SmartRent’s Addressable Market
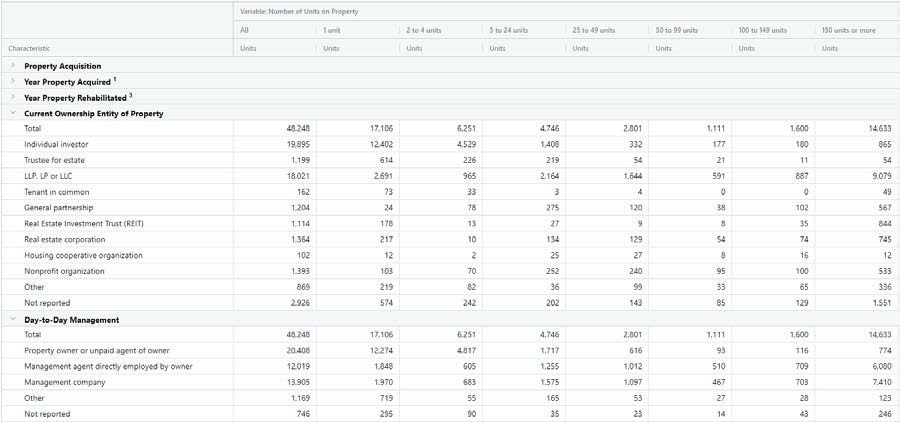
Source: US Census Bureau
Within this market, SmartRent has deployed its product across ~504K total units (~2.4% market penetration). But more importantly, the company also has ~811K units that are committed by customers to be deployed in the next two years. On top of this, its existing customers also own another 5.4M units, which we also expect to be deployed over time, as long as the customer is able to realize positive ROI’s from rent increases and cost savings.
Altogether, this is 6.7M potential units combined out of an addressable market of 21M units. In a way, we believe SmartRent has effectively cornered ~32% of the market already, just among its existing customer relationships.
The key thesis that’s underlying this, is that real estate owners & operators also prefer to have one solution for their entire portfolio. This is especially true when it’s deployed across tens of thousand of units, the SmartRent software is already integrated into the customer’s property management workflow, and staff has been trained & become familiar with the solution. As such, this tends to be a very sticky product (as evidence by 0 customer churn in the company’s history), and the incumbent is likely to continue gaining business from its existing customer base.
“What the industry wants is they want turnkey, so they want somebody to sell them the hardware. They want somebody to do the installation. They want somebody to call and scream at when things break. They want a one- stop shop for this.”
– Former Employee at SmartRent36
“So the stickiness, so it has less to do with the fact that there’s this big sunk cost or that to swap it out, there would be a big incremental cost. And it more has to do with the fact that the building management staff, and all the residents are used to leveraging SmartRent’s system and their workflow is built around it.
And so first, those relationships are hard to foster the first place, right? Like getting the right guy on the line, who has the authority to sign a new contract for a smart home system within a large apartment. I think that’s not easy to do. Building that trust is not easy to do, proving out that you can work at scale over time isn’t easy to do.
And then also, even if you did all those things as a competitor, you have to convince that decision maker that it’s worth his while from a cost perspective when he’s going to throw the operations of the business into a funk for a little bit, as people relearn a new system?…
So the property management industry is very slow to adapt adoption of new technology. So my standpoint is that, any change with them is virtually hard to do. So them changing to a new competitor for margin pricing, I just don’t give, but I could be wrong.
And if you look at the property management, there’s consolidation at the top, of the top 100. So once you get the kind of one product being like 100,000 units, does it really make sense for you to kind of change every three to five years?”
– Former Employee at SmartRent
Other players in the industry include Stratis (acquired by RealPage in 2020), PointCentral, Latch (LTCH), Dwelo, and IOTAs. However on its most recent 3Q 2022 earnings call, SmartRent stated that it believes they have more units deployed than all of their competitors combined.
Latch is a publicly traded company, and the largest competitor to SmartRent at ~126K “spaces”. It went public last year around the same time as SmartRent, and tends to focus on high-end and new development opportunities.
However, the company has run into trouble since, due to its asset-heavy approach. Unlike SmartRent or Statis who utilized 3rd party hardware, Latch has instead chosen to design its own equipment. While this can arguably create a more seamless experience (think Apple’s closed- ecosystem vs. Andoid), it’s also a very expensive strategy. Additionally, the company also focuses on new developments (versus retrofitting older buildings), which is more prone to economic & residential construction cycles. With developers pausing new construction in recent months due to the softening residential market, serving this market could become increasingly tough for Latch.
The company has burned over ~$250M in the last 3 years, and has ~$215M of cash left on its balance sheet by our estimates. The company has laid-off ~53% of its employees in the last six months, and announced that it would delay filing its Q2 & Q3 2022 financials due to faults in “key performance indicator and revenue recognition practices, including accounting treatment, financial reporting and internal controls related thereto”. The company’s stock is now trading below the value of its net cash, at a negative enterprise value of -$105M.
In conversations with multifamily owners, some have expressed the concern that if they were to utilize Latch and the company went under, they would be stuck with >$2K worth of hardware per unit that is incompatible with other systems due to the closed-ecosystem37. On top of that, the owners would need to pay a competitor to re-install their own equipment, adding to the costs. Anecdotally, this concern has slowed Latch’s growth over the last few months, and we suspect the company may be sold / out of business within the next year or two.
“Yes. I mean we get the benefit from every major consumer brand, Amazon to Google to Honeywell to Yale, we benefit from all their R&D. And so we felt like others have taken the opposite approach of being a very closed system, and we just — we feel like philosophically, that’s the wrong approach to take in this day and age.”
– Lucas Haldeman, Founder of SmartRent (Goldman Sachs Communacopia 2022)
Lastly, as we understand it, Latch might be overstating its 126K “spaces” count as well. We’ve heard that the company often counts all the apartment units as a Latch “space”, even if its equipment is only on the building’s front door / amenity areas, and not actually installed on all the individual units.
PointCentral is the second largest competitor, with ~50K units. The company is owned by Alarm.com (ALRM), and primarily focused on vacation rentals and secondarily on multifamily. Alarm even stated on its Q2 2022 earnings call, that it believes the multifamily space is already crowded with SmartRent and Latch, and that it is choosing to focus its efforts elsewhere.
“The multifamily space has gotten really crowded in the last 2 years, and there’s a lot of — there’s always a point where you look at it and you say… [is that] one that I want to pursue.
And if we look at some of the other companies you referenced and in our opinion, if we really sort of double-click on the business model, there are places where it’s better for us to just say no… So I would say we’re being a little more selective in how we go to market and what types of business we take.”
– Alarm.com 2Q 2022 Earnings Call
Dwelo and IOTAs are private, but from our understanding, they each have ~40K units and ~12K units, respectively. There isn’t much public information on either company, but in speaking with SmartRent’s customers and former employees, it seems that the company doesn’t bump up against these two players much during the sales process. Both are also sub-scale, with a combined unit count at ~ 1/10th the units of SmartRent.
Lastly, there’s Stratis who claims they have ~380K units worldwide. However, we’ve also heard that Stratis is overstating this figure. Apparently the company is counting every installed Schlage Control lock, that is capable of integrating with Stratis. There’s hundreds of thousands of these locks deployed around the world, but apparently only ~10K of these units are actually paying customers.
Stratis doesn’t manufacture its own hardware (except for its Gateway control unit), and operates under an open ecosystem similar to SmartRent. However what’s different is that Stratis operates similar to middle-ware software, in that residents can use a different application from Statis’ consumer-facing app, and also integrates with property management software like Entrata or RealPage. They have also historically sold through an authorized dealer / integrator model, who takes care of the equipment purchase and installation (in contrast, SmartRent does this in-house). The company was acquired by RealPage in 2020, and is estimated to have ~$9M in revenues then.
It’s clear that SmartRent is leader in the space, has approximately ~70% market share of actual units deployed, and is further gaining market share in the process.
Over time, it’s likely that SmartRent and a handful of competitors will continue to co-exist, with each taking a slightly different strategic approach. But with 21M total addressable units in the United States and only ~740K units penetrated (~3.5% of total) across all of these companies, it’s clear that there’s more than enough room for more than one provider to exist.
Customers
As mentioned previously, SmartRent’s customers are some of the largest residential real estate owners in the US, counting 14 of the top 20 owners as customers. The list includes Starwood Capital, Mid-America (MAA), Morgan Properties, AvalonBay (AVB), Greystar, Equity Residential (EQR), among hundreds of others.
Not only are these companies customers of SmartRent, but they’re also investors in SmartRent as well. Lucas was savvy when he first founded the firm, by going to the “thought-leaders” within the multifamily space, and offering them a most-favored-nation (“MFN”) provision, if they invested in the seed-round and fully exercised their option in the Series A.
Top Real Estate Owners are SmartRent Customers
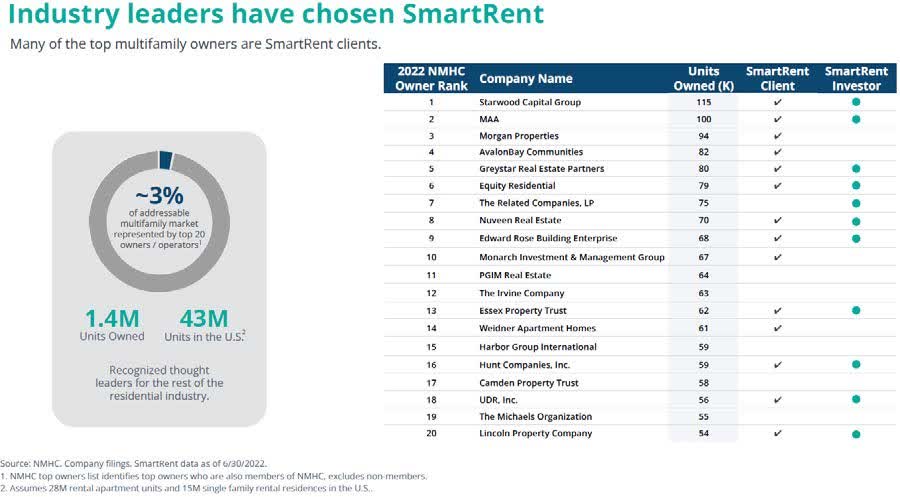
Source: SmartRent; NMHC
In return, these early believers received a 35% discount on the company’s standard rates. If we use the ~$3.45 per month the company was charging in 2020 (the earliest public ARPU data), this means that the company would be able to save $1.20 per unit per month. SmartRent raised $1.5M in the seed round from RET Ventures, who is one of the premier property tech venture firms in the US.
Unique about this deal, is that RET’s own investors are 40 of the largest multifamily REITS and owners (owning 2.4M units in total), including Essex Property (ESS), Invitation Homes (INVH), Mid-America, and UDR. By investing $1.5M, this meant that RET’s investors would get their initial capital back via discounts, if they just cumulatively deployed 104,000 units over time.
For SmartRent, this was a great deal, since it meant that not only were the largest & leading multifamily owners helping to jump-start sales and build industry reputation, but they were also financially incentivized for SmartRent’s business to succeed. This instant boost in industry credibility was instrumental for signing on additional REITs, considering that the real estate industry is notoriously slow to adopting new technologies and often look to the largest scale owners for inspiration.
“So when we came to market, we targeted the largest real estate owners first for one obvious reason, which is they have scale. So if you own 100,000 units, that’s a great account to get. But the other thing that isn’t as obvious is the top 15 or top 20 real estate owners and multifamily are really on the leading edge, and they’re a great marketing tool for us, where we actually say, don’t take our word for it, look at UDR, look at Essex, look at MAA, these companies are a great source of marketing for us, and it tends to be when you look at the real estate world, it’s a very long tail of institutionally managed apartments. There’s thousands of owners that own say, 5,000 or more units, but they all look to the largest operators for what they’re doing, whether that’s smart apartments or CRM or anything that they’re sort of the leading edge.”
– Lucas Haldeman, Founder of SmartRent (Goldman Sachs Communacopia 2022)
SmartRent followed this playbook yet again last year, when they decided to IPO via a SPAC with Fifth Wall, the largest venture firm focused on the real estate and property tech industries. While SPACs have received a poor reputation in the last year, this one was also unique.
First, Fifth Wall was an existing investor in SmartRent’s Series C round. Additionally, Fifth Wall’s own investors are 90 of the largest global real estate owners, operators, and developers, giving SmartRent a channel to get in front of new customers who are also financially incentivized in SmartRent’s success38. Fifth Wall received 4% of the shares issued as sponsor shares, but it has yet to sell any of these shares since then. Concurrently, Starwood Capital, Lennar Ventures, and Invitation Homes also participated in the PIPE transaction.
Business Model & Unit Economics
It’s one thing for the largest real estate owners and operators to trial SmartRent’s product as part of these investment rounds, but why are companies like UDR, Invitation Homes, and MAA continually rolling out the product across their tens of thousands of units each, and plan to be deployed across their entire portfolios within the next 1 – 2 years?
Something must be working, and they must be experiencing strong returns on their investment, else it’s not logical for them to each spend $100M+ on these capital improvements.
We can see evidence of this through their public filings and commentary – that these multifamily owners are indeed seeing a strong payback on their SmartRent investments. In fact, MAA has stated that after implementing SmartRent’s technology, they are able to command $25 extra per month from tenants. For reference, the equipment costs ~$1,300 per unit.
The cost is broken down as: ~$400 for FusionHub (new version of SmartHub), ~$250 for the lock, ~$100 for the thermostat, and ~$100 for three leak sensors. Installation also costs ~$250 per unit. MAA was also one of the “founding partners” under the RET seed round, and therefore is likely paying a substantially discounted ~$3 / month software rate, under a 5 – 7 year contract (less than half the current ~$7.49 for new customers).
At a $25 per month rent uplift, this implies a 23.4% annual return on this capex spend for MAA, on just the extra rent increase alone. Even if we assume MAA is paying the new customer software rate of $7.49, it’s still a 19.4% annual return. This is also just for the core product (smart access, thermostat, leak sensors), and doesn’t include additional uplift from other products, like community wifi, which has additional revenue generation opportunities too.
On its Q2 2022 earnings call, MAA stated that they expect to increase their NOI by 120bps just from rent increases due to SmartRent alone.
“I think important to note today, these have been rolled out about 3/4 of our units. And for the full year 2022, there’s about $16 million or so of NOI embedded in our NOI stream for 2022. And then by the end of 2023, as we roll out some more, we think there’ s probably 120 basis points of margin enhancement from the rent increases just strictly on the Smart Home.”
– MAA, Q2 2022 Earnings Call
Similarly, AvalonBay has also stated they expect NOI improvement of 200bps, due to this technology:
“We are in the midst of transforming our operating platform with significant investments in innovation and technology that we expect to generate200 basispointsof marginimprovementor $40 million to
$50millionofNOI…includingtheprojectedprogressyear-by-yearwith$20millionof additional revenueassociatedwiththerolloutofbulkInternet,managedWiFiandsmarthome technology and an additional $20 million in expense savings to come from the digitization of a number of customer experiences, including self-touring, maintenance, renewals and others.”
– AvalonBay Q2 2022 Earnings Call
Mid-America’s ROI on SmartRent Deployment (Source: Hayden estimates)
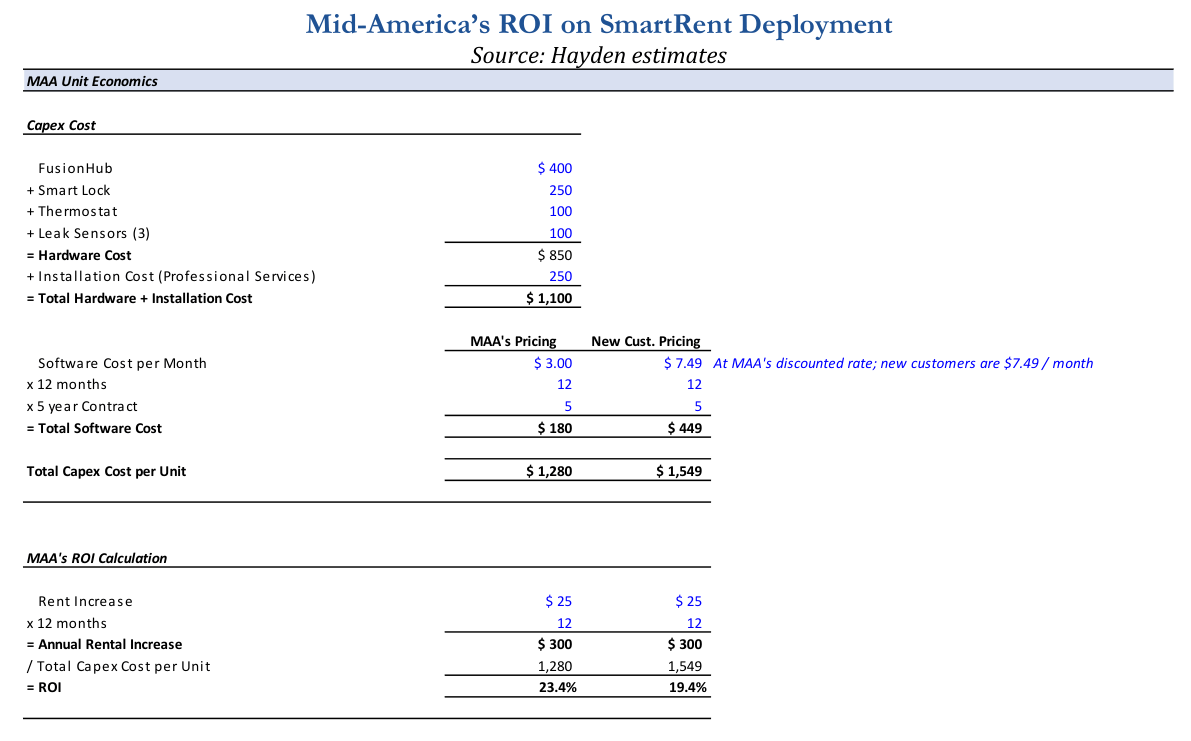
Source: Hayden estimates
Nexpoint Residential even does this calculation for their shareholders in their public filings. Their own experience shows that after renovating their buildings with their “Smart Home Technology Package”, they were able to increase their rents by an average of $45 versus a $1,185 capex cost39. This resulted in a +37.3% ROI, just from the rental increases alone.
NexPoint’s ROI on Smart Home Technology Package
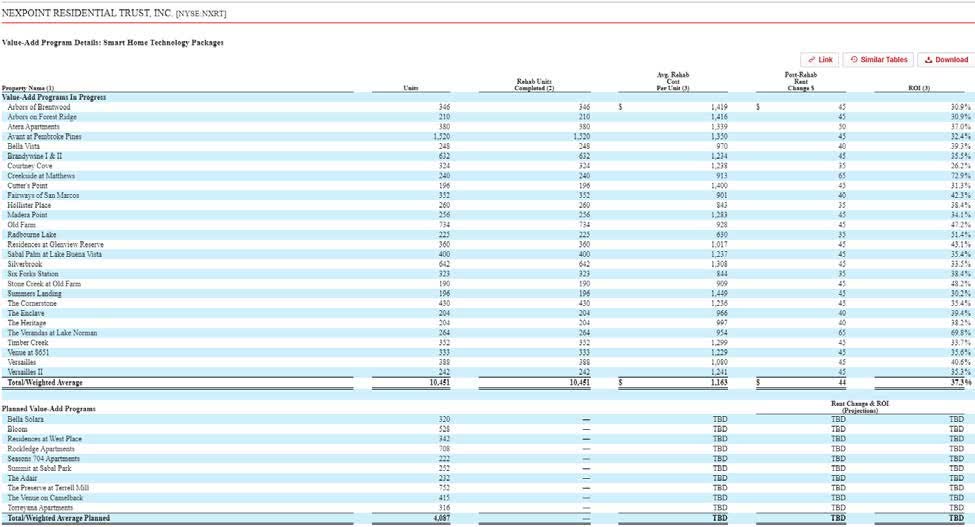
Source: NexPoint
However, as mentioned before, the real benefit of this isn’t from the revenue side of the equation (i.e. rent increases). Rather, the real benefit for owners & operators, is on the expense reduction side – via saving on staffing costs and more efficient management of their units.
With SmartRent’s locks allowing remote & temporary guest access for prospective tenants, buildings are now able to reduce their leasing staff headcount and share staff across multiple properties (known as “podding” in the industry).
SmartRent Has Multiple Ways to Generate ROI for Customers
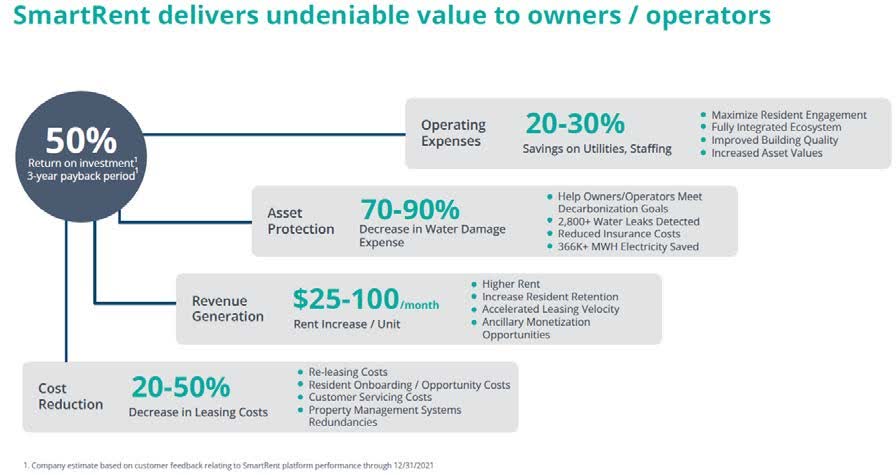
Source: SmartRent
This smart lock technology enables self-guided touring, whereby prospective renters can visit the unit of their choice at any time of the day, without needing to schedule a timeslot with a dedicated leasing staff to chaperone them around. This also creates a better experience for renters, with real estate companies reporting higher conversion rates due to this remote aspect.
We can see real evidence of these cost savings, from customers. For example, Equity Residential stated on a recent earnings call that over 90% of all their tours were now self-guided, and half their buildings now operate without dedicated staff:
“Innovation is a major contributor to our ability to create operating efficiencies while continuing to maintain a high level of customer service. Despite meaningful progress, we continue to have a lot of opportunity ahead of us as we integrate our initiatives, continue to leverage technology and advance our overall skill set. Just over half of our properties now operate without fully dedicated staff. We continue to invest in and implement software and processes that further enable the autonomous leasing experience, allowing customers to tour a community and interact with a member of our team or our AI leasing agent as much or as little as they desire. Self-guided tours continue to dominate as a preferred tour option with just about 90% of all tours in the second quarter being self-guided.”
– Equity Residential, Q2 2022 Earnings Call
Specifically, Equity Residential also stated that they have also been able to reduce headcount per building by 15%, and residents are also more satisfied with the experience:
“So our same-store payroll costs this year are going to be slightly negative… We’re combining properties. We call it podding properties together… Those combined with having a big centralization push.
So if you’re an on-site sales worker at our company 4 or 5 years ago, you were doing applications, you were doing renewals, you’re doing new leases, you were doing tours, you were doing a lot of things… So we have centralized teams that do that now. We have automated software… And so what that means is the headcounton site has dropped like 15%. We’re sort of in the middle innings of that…
But the offset that is we just have less staff, but we’re more efficient. And our resident likes interacting using technology… That kind of technology where the customer is happier, where our people aren’t caught up on these conversations that don’t always lead to sales, are like huge win-wins.”
– Equity Residential, BofA Global Real Estate Conference 2022
UDR has made similar comments, stating that SmartRent has helped make their staffing more efficient by +40%, and the number of units that can be managed per employee improved by +60%. This resulted in both higher resident satisfaction, while driving margins up 325bps. The company now expects to realize $60M in NOI gains from the product.
“Key foundational technologies such as smart home tech, software robotics, AI chatbots, proprietary self-guided tour and resident apps, spatial analysis heat maps and a unique data hub have already been integrated into our operating platform. These haveimprovedstaffingefficienciesat our communities by40% and increased the number of apartment homes managed per employeeby60%,improved resident satisfactionby25% andresultedincontrollableoperatingmarginadvantage of 325 basis pointsversuspublicpeersat asimilarrental.
Forexample,ittookus3yearstocapturethefirst$20millionofNOIupsidefromtherolloutofournextgenplatform.Sincethebeginningof2022,wehaveidentifiedanadditional$40millionoranincremental4%ofNOIinitiativesthatweexpecttocapturebyyear-end2025.Examplesoftheseinitiativesincludebuilding-wideWiFi,visitorparking,increasingthenumberofpropertiesoperatewithnodedicatedon-sitepersonnel,improvingourprocesstoreducevacantdaysandleveragingbigdatatomakebetterpricingdecisions.”
– UDR, Q2 2022 Earnings Call
We can also run a back-of-envelope calculation to verify these figures. For example, if we assume that within a 250 unit building that has 8 staff on-site (between maintenance, doormen, leasing, and administrators), at a cost of ~$75K per employee (including benefits, taxes, etc.),
~$1,300 average capex spend per unit, and a benefit of 15% staff reduction (using Equity Residential as an example), the math indicates that customers will realize a ~28% ROI from the payroll savings alone.
ROI from Building Labor Savings
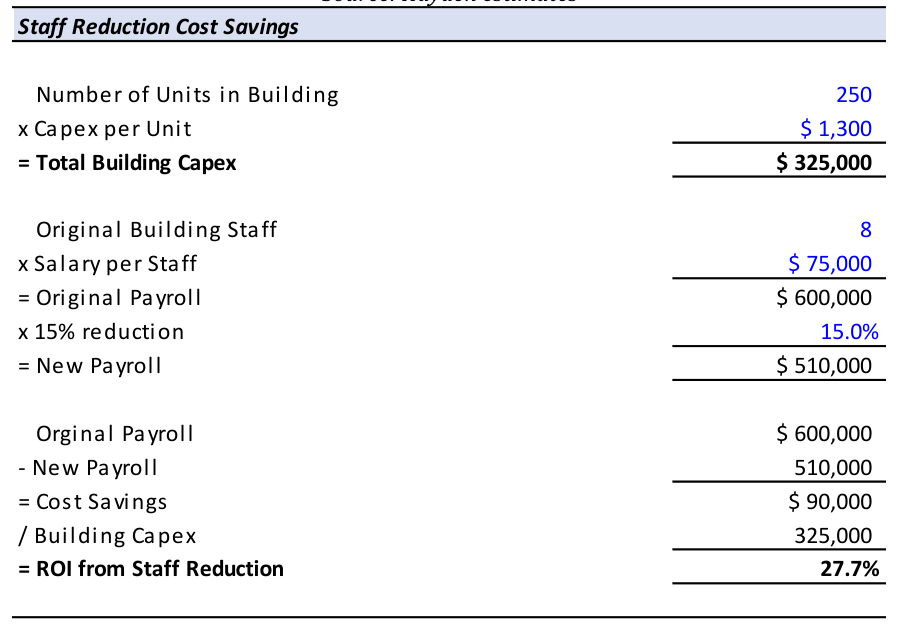
Source: Hayden estimates
Combined with the aforementioned rent increases, this equates to an >50% ROI from just these two drivers alone.
However, there’s even more ancillary benefits to SmartRent’s product. For example, water damage is the largest cause of damage to a property, and can be hundreds of thousands of dollars to repair if the leak is undetected and penetrated multiple floors / units. The leak sensors that come with SmartRent’s basic package are placed underneath dishwashers, laundry machines, bathrooms, sinks – anywhere there’s running water. Upon detecting a leak, the sensor will automatically notify the building’s maintenance staff, who can coordinate with the resident to inspect the cause. By detecting these instances early, not only does it save on hundreds of thousands in potential damage, but it also helps reduce the building’s insurance costs as well.
Another ancillary benefit for example, is on utilities savings while a unit is vacant. After a resident’s scheduled moved out date, the property management system automatically recognizes the unit is now vacant, and can communicate with SmartRent’s system to turn down the thermostat to save on electricity bills. When a prospective renter has scheduled a timeslot via SmartRent’s self-guided touring platform, the thermostat can be turned back on for the showing automatically as well. Considering the average vacancy rates are 3 – 5% (i.e. 2 weeks out of the year) and monthly utility bills can be several hundred dollars, this alone can save ~$50 – 100 per year per unit (or an additional 4 – 8% ROI on the capex spend).
All of these examples indicate one thing – this product is an extremely high-return investment for real estate owners, and explains why there is such high demand and backlog for SmartRent’s product. Several SmartRent customers told us their demand is for the product is multiples what they’ve already deployed, and the only thing holding them back is getting enough supply of equipment40.
Especially in an inflationary and high-interest rate environment, real estate owners are trying to reduce labor costs where they can. At the same time, higher interest rates are driving up building cap rates, and thus increasing a building’s NOI is the primary way to maintain a building’s value (which affects how much debt the owner can take on and / or resale values).
Lastly, an attractive aspect of SmartRent’s business model, is that these customers also prefer to pre-pay the full amount of the software contract upfront, so that they can record it as a one-time capital expense, instead of recurring operating expense.
This is win-win situation, since for the real estate owner it doesn’t affect their NOI (on which their properties are valued, allowing them realize a higher sales price / higher leverage, because it’s not counted as a “recuring” expense). It also provides SmartRent with a negative working capital cycle, thereby helping to fund its growth without using external capital. In the 2021 roadshow presentation, SmartRent reported that 75% of its customers pre-pay the software contract41.
In fact, as of Q3 2022, SmartRent had ~$128M of deferred revenues, vs the ~$180M GAAP revenue expected for all of 2022. This dynamic, combined with the ~811K units that have already been committed by customers, gives SmartRent and its investors exceptional visibility into future revenues & growth.
Financial Projections
So how does all this translate into the company’s financial trajectory and future profitability? First, we should understand the three segments of SmartRent’s business: Hardware, Professional Services, and Hosted Services.
Hardware revenues are derived from SmartRent purchasing 3rd party equipment on behalf of its customers, and then reselling it to them as part of their installation package. This is essentially a pass-through revenue line-item, where the company expects to make ~15% gross margins in time. Note, this segment does not include SmartHub revenue (the central control unit for each apartment, which SmartRent makes itself, and is included in Hosted Services revenue).
Due to rising inflation & component shortages, the cost of procuring this hardware has increased in the last few years. However, some of these customer contracts were signed prior to the cost increases, which has resulted in negative hardware gross margins at times. As of 3Q 2022 though, the company reached an inflection point and has finally caught up to on this discrepancy, reporting 4.7% hardware gross margins. Importantly, the company stated “barring unforeseen events, [SmartRent] will remain in the black in terms of positive gross margins going forward” .
Hardware revenue is driven by two factors: 1) how many units are installed during that period, and 2) the value of the hardware installed per unit. The first driver follows the pace of units deployed, which we project to grow at a ~28% CAGR over the next four years. Hardware ARPU has also been growing, and increased 19% q/q in the last quarter alone, from $441 per unit in 2Q22 to $525 per unit in 3Q2242. This is due to more customers purchasing ancillary products outside the core offering, such as video monitoring, smart lighting, smart parking, etc. We’re projecting hardware ARPU to increase at a 7% CAGR over the same time period.
Combined, we expect hardware revenue to grow at a 37% CAGR, between 2022 – 2026. This results in hardware revenue growing from ~$98M in 2022E to ~$347M by 2026E.
SmartRent Hardware Revenue Projections
Source: Hayden estimates
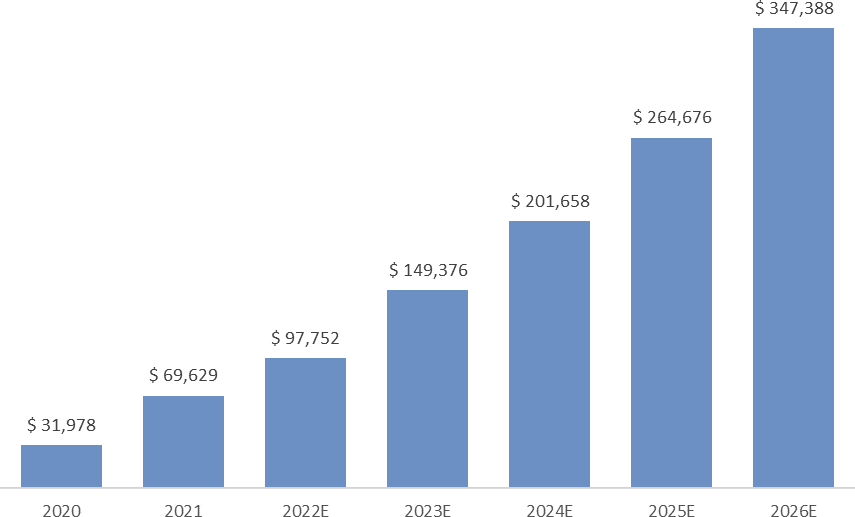
Source: Hayden estimates
Professional Services is the labor component of SmartRent’s business. It comprises of the installation revenues customers pay to have this hardware installed in their buildings. On the cost side, SmartRent has hundreds of installation professionals internally, who are paid a fixed salary. In addition, the company also supplements this internal staff with external contract installers, who have also raised prices in this environment.
Due to wage inflation, combined with current contracts being signed when wages were lower, this segment is currently realizing negative gross margins. Margins have averaged -85% so far this year, effectively meaning that the company needs to double its pricing. In the early days, the company under-charged on this segment, in order to get the units installed and made up for the shortfall on high-margin software revenue. It costs ~$250 to install a unit (in addition to travel & other costs), and they were charging ~$150. Considering software’s high margins, we estimate the company would have broken-even on this in ~3 years. In doing so, the company managed to get its name out there with some of the largest players as customers, and jump-start its brand & scale in the industry.
Nowadays, the company has told us that new contracts are now being signed taking these higher wages into account. But there’s still a backlog of 100K units that need to be worked through first, before this will show up in the financials. This will likely take until early 2024 to get through, assuming that supply chains don’t ease until mid-2023, and then it will take several months to catch up on this backlog.
SmartRent also believes its current installation staff can handle ~300K units per year. But due to supply chain issues slowing down the ability to deploy units, we only expect the company to utilize 72% of this capacity this year (216K units deployed). This capacity mis-alignment is also contributing to the negative gross margin profile. We expect this to be resolved within the 12 – 18 months, and the company is also targeting ~15% gross margins on this segment over time.
Professional Services revenue is a function of the number of units deployed, combined with the number of hardware pieces installed per unit. As such, we expect this segment’s revenues to largely follow hardware revenue over time. We are projecting revenue to grow from ~$32M in 2022E to ~$118M by 2026E, for a ~39% CAGR.
SmartRent Professional Services Revenue Projections
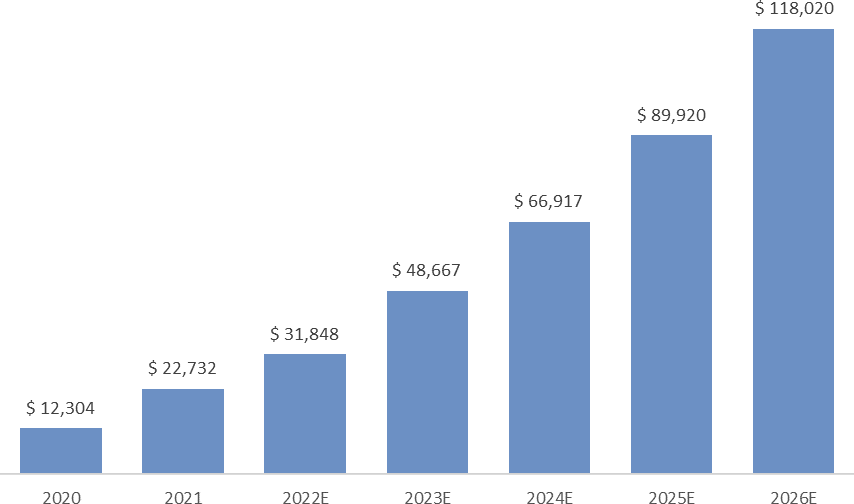
Source: Hayden estimates
While the hardware and professional services segments won’t be significant contributors to profits, it’s a key differentiator for SmartRent and is what has driven the company’s industry leading growth.
What SmartRent realized early on, given the team’s multifamily industry experience, is that multifamily owners & operators want a simple & easy one-stop process. They don’t want to buy the equipment themselves from one vendor, have another vendor install it, and then use SmartRent’s software to manage it. Instead, the real estate industry strongly prefers a simple, easy solution for their needs, and they’re willing to pay for it.
This was a differentiator for SmartRent early on, since competitors often only sold the software piece, or they contracted the installation out to third parties:
“Goldman Sachs: Talk to me a little bit about the installation process for the product. You started off with that when you were talking about the business and setting it up. Can you get into a little bit more detail on that?
Like how does the professional services side of the business work? What’s required here to actually get the product installed?
SmartRent: Yes. It is one of our sort of moats that we’ve built this large field services team that is an incredibly talented group of individuals. It’s a very hard role to fill because if you think about what we’re asking the person to do, they have to be mechanical because it’s a construction project, you got to take the lock off, you got to take the thermoset off. So you got to be a mechanically inclined person. It’s technology. It’s smart devices, so you have to be technical. And then the third one is you’re in someone’s home. It’s occupied. You have to be personable. So I have to like having you in my house. And to find all 3, that’s a unique skill set.
And so the way our model works is we have what they’ re called field install manager, they’ re essentially a little general GC of a job and they stay at one property. We always have one at every property, and then we augment that with contracted labor. So he’ s a local general contractor to bring in labor. But we have one person there who is going to do all the pairing, all of the quality assurance and run the project.
Goldman Sachs: So that person is the face of SmartRent with the people, the tenants and the property owner and so on, and then you have contractors come in and do the manual labor?
SmartRent: Yes. And that person, we also have a separate team that does the training. So while I have someone else at the property, it’ s actually there just to train. We sit with the staff and show you how to use your new operating system. And what we found is we can’ t get utilization of these platforms if we don’ t have a really good training because it’ s not something that you can just say, ” Here’ s your new iPhone, use it.” It’ s like we’ re actually going to say, ” Okay, when this happens, this is the new process.” So we train the leasing staff, we trainthepropertymanagement staff,wetraintheservicestaff.Andthenwe’ realso there tohelptraintheresidentsandhelpthemunderstandthebenefitsthatthey’ regetting fromthesedevices.
Goldman Sachs: So what about the — the competitors do this sort of thing as well or not at all, they just kind of throw it out there or how does the competition respond to what you’re doing in that respect?
SmartRent: Yes. No one has duplicated what we’ re doing. They’ re now — all of our competitors have now started to hire people, but they’ re way behind. I mean that was — I
think the difference was we are coming from being operators, and we just intuitively knew there’ s no way to not do it this way. Like it wasn’ t even like a real clear decision to say we should have a field services team. It was like, we know this isn’ t going to work without it. And so we’ re now seeing because we’ ve scaled faster than everyone and grown faster, certainly, everyone is taking note of how we’ re doing it. But now we’ re out ahead, and we’ ve got that lead.
Goldman Sachs: And I guess that since you started off this way, you have processes in place to train people and so on. That all takes time, too, right, that of materials and training and so on?
SmartRent:Yes.Andactually,eventhecontractedlaborthatwebringonhastobecertifiedin ourplatform.Andsoyouhaveto go throughatrainingmoduleandyouhavetogo,well,thatneedstobebuiltandunderstoodandyoucan’toperateatthescalewe’reoperatingatandcontinuingtogrowthatscale,ifyoudon’thaveareally good institutional underpinning, right? We’ vegothundredsof individuals now out installing every day, you can’ t solve those problems with a notepad right, like it’ s got to be a durable system.”
– Lucas Haldeman, Founder of SmartRent (Goldman Sachs Communacopia 2022)
Hosted Services is the last segment, and is what contains the high-margin software business. Software revenues are driven by two factors: 1) the number of cumulative units deployed, and therefore paying the monthly software fee, and 2) the ARPU charged per unit.
As mentioned before, churn has historically been non-existent in this business. SmartRent is the largest & most reputable brand in this space, charges fees that are lower or on-par to competitors, and also provides a “one-stop” solution for real estate owners (unlike competitors). As such, we expect churn to remain low going forward, since there’s little incentive for customers to switch to a competitor.
Cumulative units is therefore a function of existing units deployed + new units deployed during the period. We expect the company to deploy ~216K units this year, and steadily increasing that to ~617K units by 2026. This will result in cumulative units rising from an estimated ~555K units in 2022E, to ~2.4M units by 2026E (a 4.4x increase in four years).
SmartRent Cumulative Units Deployed Projections
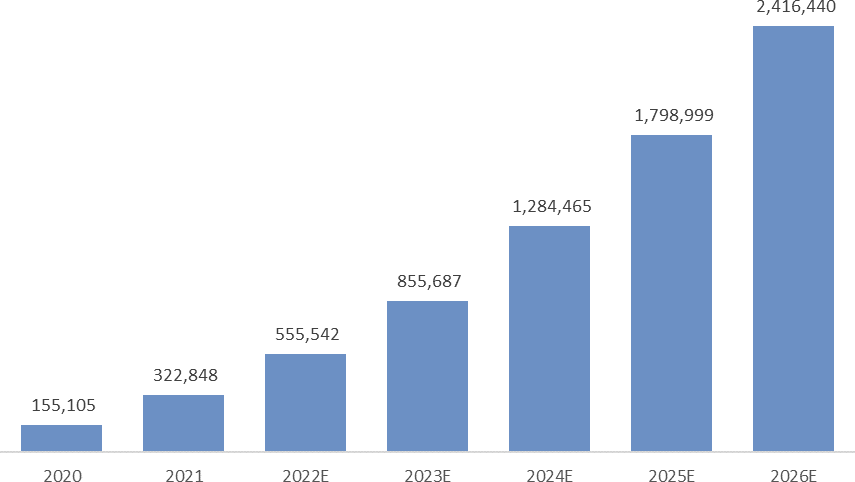
Source: Hayden estimates
While this may seem like a steep jump, we think this pathway is actually achievable. First, we sense-check this by seeing what the public real estate companies are saying about their SmartRent deployment plans. For example, MAA plans to roll out SmartRent to the rest of their portfolio (100K units total) by next year. AvalonBay expects to deploy 20% of their total portfolio in 2022, and then accelerate that to 40% in 202343. Nexpoint has 15K units total, has already deployed 10K of these, and plans to install the remainder (~27% of its portfolio) in the next couple years.
AvalonBay Will Double Smart Home Deployments, to 40% of Units in 2023
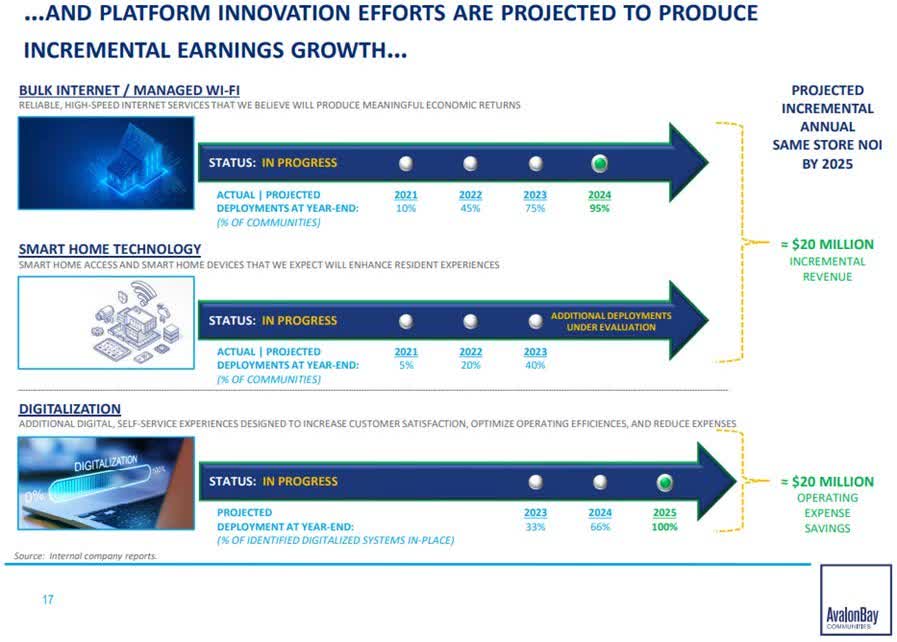
Source: AvalonBay
It generally takes a few years for SmartRent’s customers to finish their roll-out plans, which means that the company’s earliest customers should be finished by 2024. We can also see that almost none of these customers are stopping mid-way through their portfolio. Almost every one of them has cited the strong ROIs, and have plans to roll the product out across the entire portfolio – indicating the strong value proposition of the product.
The company already has 811K units that have binding commitments to be deployed in the next two years. Combined with the already deployed 504K units, it equates to an essentially guaranteed 1.3M unit count by the end of 202444.
The rest of the unit growth is going to come from the long-tail of customers (those with <50K units). SmartRent is already moving into the long-tail, as evidenced by the acceleration in customer count recently. In fact, SmartRent has doubled its customer base in just the last 9 months alone – going from 249 customer to a recent 502 customers45. We expect these new customers to follow a similar cohort curve to existing customers, and therefore should have strong visibility into the deployment schedule in the near-term.
SmartRent’s Customer Count
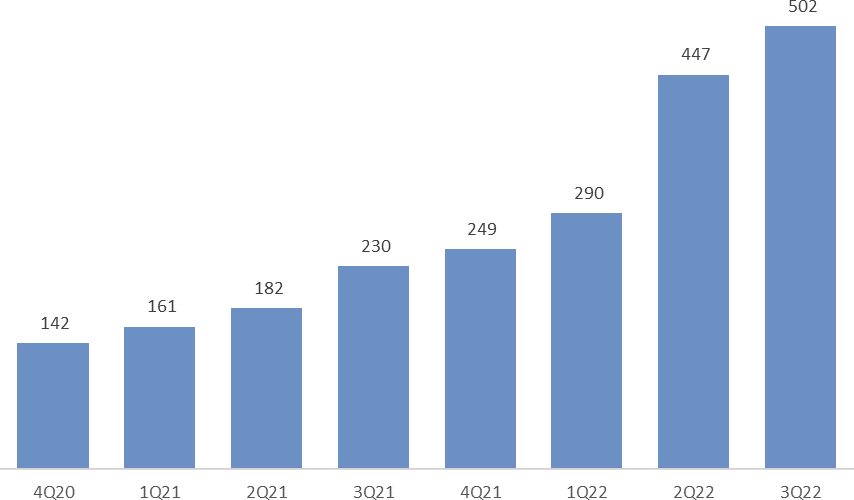
Source: SmartRent
Another way to look at it, is that if our projections are correct, SmartRent will have penetrated only ~36% of its existing customer’s units by 2026 (2.4M units deployed out of the 6.7M owned by existing customers). Even if they don’t sign on a single new customer in the next few years, we believe they still have ample opportunity ahead. The 2.4M projected units deployed is also just ~11% penetration of the total addressable market, which also indicates ample room for future growth.
This growth in cumulative units deployed is the largest driver of our Software revenue projections and therefore valuation. Additionally, we’re expecting Software ARPU to grow from the current $5.55 per unit (3Q22) to $8.57 by 2026, for a ~11% CAGR. Average ARPU is currently being dragged-down from legacy customers who received both the MFN discount, as well as software prices from several years ago. From our understanding, these older contracts didn’t even have escalators built into them.
For context, new customers are currently paying $7.49 per month (as of Q2 2022), while legacy customers are likely in the $3 – 4 range (a >50% discount). As these legacy contracts are renewed between 2023 – 2025, we expect these legacy ARPUs to reset higher. Combined with a higher mix from new customer units, increases in new customer pricing, and additional ancillary revenue from product add-ons (building wifi, smart parking, etc.), this should easily drive average ARPUs higher by over +54%.
Additionally with customers realizing >50% ROIs from the product, we feel there’s ample support for SmartRent to take up pricing further as well.
SmartRent ARPU Projections
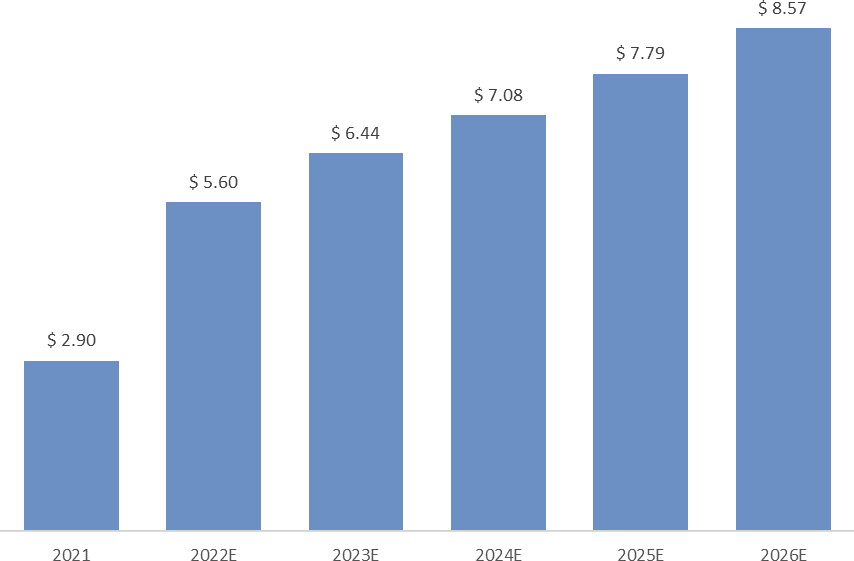
Source: Hayden estimates; 2022 increase partly attributed to Sightplan acquisition
The final component of Hosted Services revenue, is revenue from the SmartHub device. This device is proprietary to SmartRent, and is the central control unit that communicates between all the in-unit equipment. Because the software wouldn’t work without SmartHub, SmartRent has classified this revenue within Hosted Services.
Customers generally pay for the device upfront, but GAAP revenue is recognized over a four- year useful life period. There’s only one SmartHub needed per unit, so revenue generally follows units deployed. Additionally, SmartRent recently launched the new FusionHub device, which is wall-mounted and now has a digital display. This new device is 150% more expensive than the older generation, and this will also drive ARPUs higher over the period.
SmartRent’s SmartHub (Old Version)
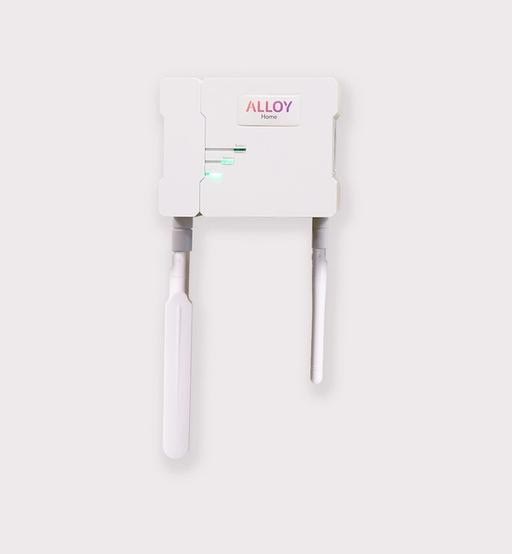
Source: SmartRent
SmartRent’s Alloy FusionHub (New Version)

Source: SmartRent
All combined, we expect the company to generate ~$50M in Hosted Services revenue this year, and growing to ~$337M by 2026. This 6.7x jump comes from the expected number of units deployed growing 4.4x, and the remainder from ARPU increases.
SmartRent Hosted Services Revenue Projections
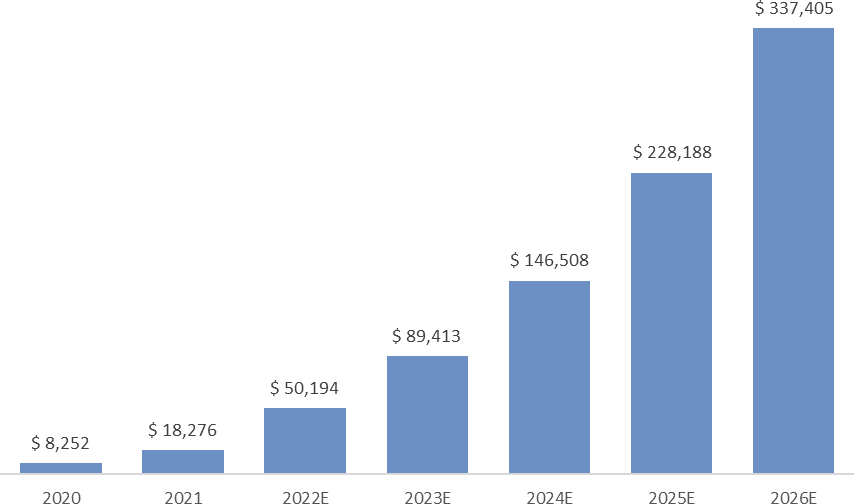
Source: Hayden estimates
On the cost side of the equation, SmartRent’s operating expenses are broken into Research & Development, Sales & Marketing, and General & Administrative expenses.
Research and Development is primarily salaries for engineers, developers, and product managers, who create design features and products for the SmartRent ecosystem.
SmartRent’s Product Roadmap
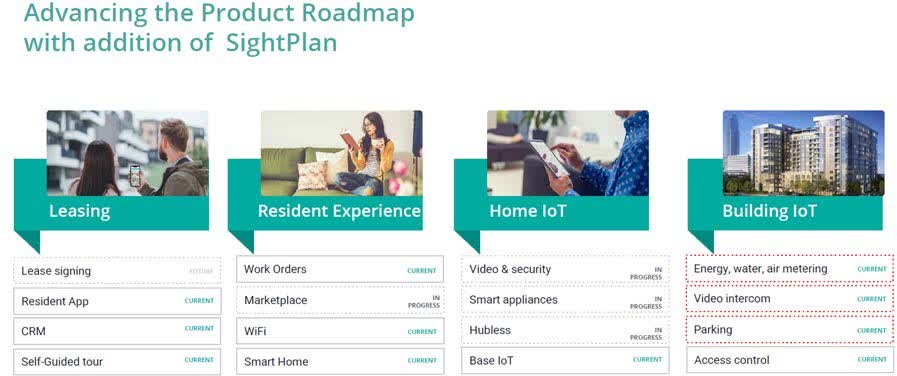
Source: SmartRent
The company has a clear product roadmap for new features they wish to launch in the future. Most of the these are already in development (notice the “in progress” features), and the Sightplan acquisition also helped accelerate this as well. As SmartRent gets closer to the finish- line of its initial product roadmap, we expect new feature launches will slow. This should drive R&D spend to decline as a percentage of revenue over time, while still increasing at a moderate pace on an absolute level.
SmartRent Research & Development Projections
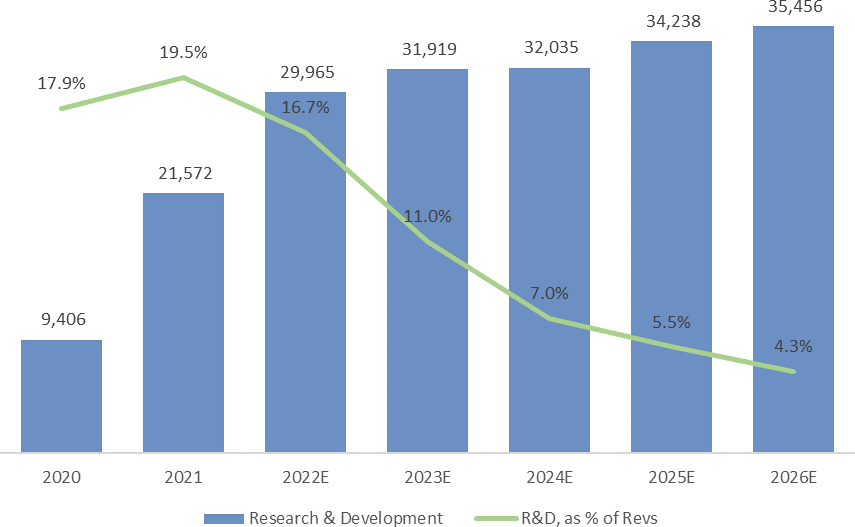
Source: Hayden estimates
Sales & Marketing consists of mainly of salaries for sales professionals, commissions, advertising, attending trade shows / conferences, and marketing materials46. The real estate industry is a notoriously relationship-driven industry, and sales cycles can be several years. Additionally, all the players seem to follow what each other is doing, and there tends to be a “snowball” effect once the industry leaders (i.e. the largest owners) have adopted a certain technology.
The company has indicated to us, that they expect to cap sales & marketing at current levels in the near-term, and possibly even further out in the future. Additionally, SmartRent plans to cut down on the number of conferences and trade shows they attend per year, which will save on marketing costs as well.
However for the sake of conservatism, we’re still modeling a slight increase in Sales & Marketing costs on an absolute level, while declining as a percentage of revenue. Additionally due to the aforementioned “snowball” effect among the long-tail owners, we’re expecting sales conversions to become easier over time, and the cost per unit booked to decline from $58 per unit today (3Q 2022) to ~$30 by 2026.
SmartRent Sales & Marketing Projections
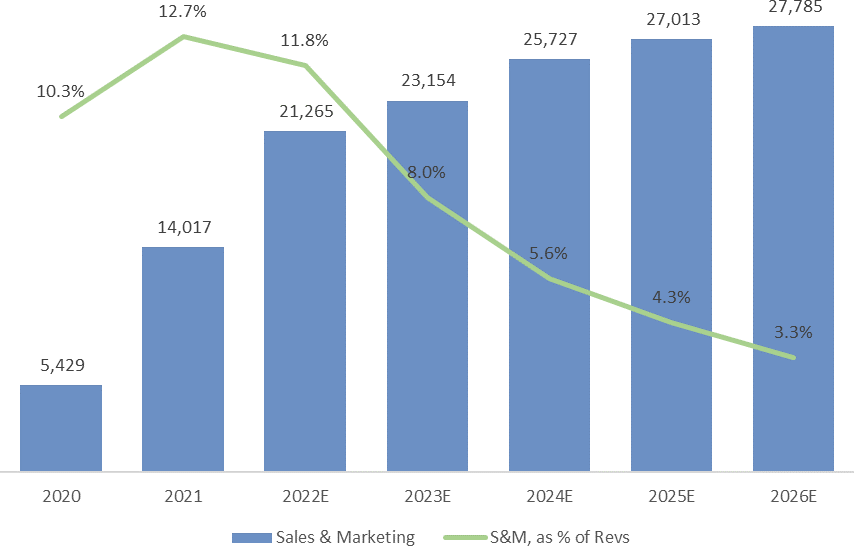
Source: Hayden estimates
SmartRent General & Administrative Expense Projections
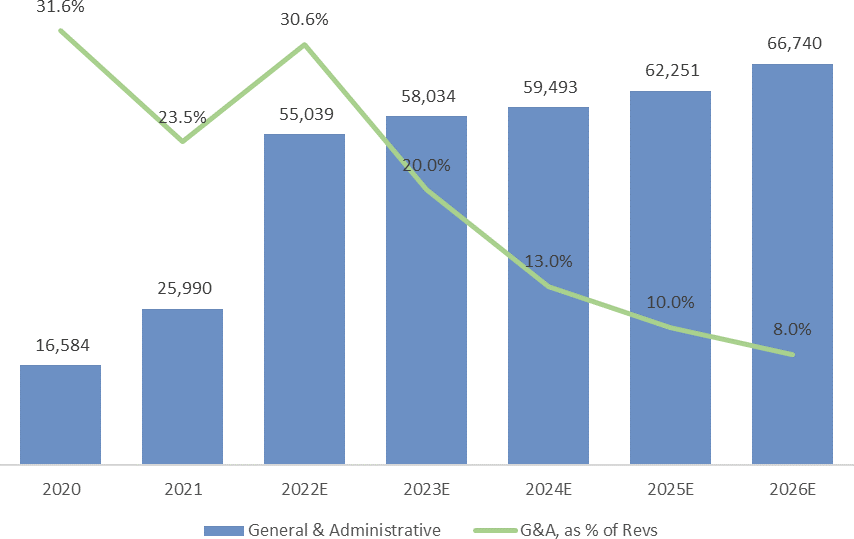
Source: Hayden estimates
Lastly, general and administrative expenses are primarily for non-R&D employee salaries. Additionally, G&A expenses increased by a couple million per quarter in 2021, due to the ongoing expenses of being a public company, in addition to hiring additional staff, which will continue going forward. However the company has indicated to us that this growth with slow considerably in future years. We expect G&A to increase moderately as the business continues to grow and requires additional headcount. Corporate headcount is expected to grow slower than overall revenue growth, and thus will decline as a percentage of revenue.
Valuation
Putting it all together, we’re expecting revenues to grow from ~$180M this year to ~$834M over the next four years (+363% growth; ~47% CAGR). Hosted Services and software revenues will grow quicker, due to the expected increase in ARPU.
SmartRent Financial Projections ( Source: Hayden estimates)
|
2020 |
2021 |
2022E |
2023E |
2024E |
2025E |
2026E |
|
|
Income Statement Hardware |
31,978 |
69,629 |
97,752 |
152,092 |
234,657 |
295,668 |
372,541 |
|
Professional Services |
12,304 |
22,732 |
31,848 |
48,667 |
76,477 |
98,655 |
124,306 |
|
Hosted Services |
8,252 |
18,276 |
50,194 |
89,413 |
146,508 |
228,188 |
337,405 |
|
Total Revenues |
52,534 |
110,637 |
179,794 |
290,172 |
457,642 |
622,511 |
834,252 |
|
memo: Growth Y/Y – Hardware |
117.7% |
40.4% |
55.6% |
54.3% |
26.0% |
26.0% |
|
|
memo: Growth Y/Y – Professional Services |
84.8% |
40.1% |
52.8% |
57.1% |
29.0% |
26.0% |
|
|
memo: Growth Y/Y – Hosted Services |
121.5% |
174.6% |
78.1% |
63.9% |
55.8% |
47.9% |
|
|
memo: Growth Y/Y – Total Revenues |
110.6% |
62.5% |
61.4% |
57.7% |
36.0% |
34.0% |
|
|
Hardware |
35,225 |
70,448 |
94,883 |
140,685 |
211,191 |
266,101 |
335,287 |
|
Professional Services |
16,176 |
38,189 |
57,842 |
46,234 |
65,006 |
83,857 |
105,660 |
|
Hosted Services |
5,430 |
12,073 |
25,645 |
40,960 |
58,113 |
88,896 |
129,084 |
|
Total Cost of Revenue |
56,831 |
120,710 |
178,371 |
227,879 |
334,309 |
438,854 |
570,031 |
|
Hardware |
(3,247) |
(819) |
2,869 |
11,407 |
23,466 |
29,567 |
37,254 |
|
Professional Services |
(3,872) |
(15,457) |
(25,995) |
2,433 |
11,472 |
14,798 |
18,646 |
|
Hosted Services |
2,822 |
6,203 |
24,548 |
48,453 |
88,395 |
139,292 |
208,321 |
|
Gross Profit |
(4,297) |
(10,073) |
1,423 |
62,293 |
123,333 |
183,657 |
264,221 |
|
memo: Gross Margin % – Hardware |
(10.2)% |
(1.2)% |
2.9% |
7.5% |
10.0% |
10.0% |
10.0% |
|
memo: Gross Margin % – Professional Services |
(31.5)% |
(68.0)% |
(81.6)% |
5.0% |
15.0% |
15.0% |
15.0% |
|
memo: Gross Margin % – Hosted Services |
34.2% |
33.9% |
48.9% |
54.2% |
60.3% |
61.0% |
61.7% |
|
memo: Gross Margin % – Total |
(8.2)% |
(9.1)% |
0.8% |
21.5% |
26.9% |
29.5% |
31.7% |
|
Research and Development |
9,406 |
21,572 |
29,965 |
31,919 |
32,035 |
34,238 |
35,456 |
|
Sales and Marketing |
5,429 |
14,017 |
21,265 |
23,154 |
25,727 |
27,013 |
27,785 |
|
G&A |
16,584 |
25,990 |
55,039 |
58,034 |
59,493 |
62,251 |
66,740 |
|
Total Operating Expenses |
31,419 |
61,579 |
106,268 |
113,107 |
117,255 |
123,502 |
129,981 |
|
Operating Income |
(35,716) |
(71,652) |
(104,845) |
(50,814) |
6,078 |
60,155 |
134,240 |
|
memo: Operating Margin % |
(68.0)% |
(64.8)% |
(58.3)% |
(17.5)% |
1.3% |
9.7% |
16.1% |
As indicated previously, the most important driver of these projections is how many units SmartRent can deploy over this timeframe (we’re projecting 2.4M units by 2026).
We feel that based on a combination of 1) primary research / conversations with customers, 2) the capex plans and public commitments made by the publicly-traded REITs (who are among SmartRent’s largest customers), and 3) the committed units with binding contracts already signed, that this is very achievable. We know that demand is extremely strong (driven by >50% ROIs that are already realized in the market), it’s just a matter of getting enough supply of equipment (i.e. supply chain issues getting fixed next year), and getting installers out into the field.
In fact, current deployments plus committed units already gives a clear line-of-sight to 1.3M units by 2024 (504K units deployed + 811K committed units). At that point, the company would need to deploy ~550K units in 2025 and 2026 to hit our targets.
The company has repeatedly indicated that they expect to be profitable by the end of 2023. In fact on our recent call with Lucas (the Founder & CEO), he said that getting to profitability was his top priority next year.
The company is burned ~$26M in 3Q 2022, and we expect this to steadily decline until they turn cash flow positive in Q4 2023. Over this time period, cumulative cash burn is expected in the ~$60M range in total.
As of 3Q 2022, SmartRent has $210M in cash, no debt, and a $75M line of credit. This is more than enough cash cushion to get the company to break-even, with an expected ~$150M left over.
From now to 2025, we’re expecting the company to realize a cumulative $25M in FCF (inclusive of the $60M cash burn in the next 12 months). By 2026, we’re expecting this to increase to $167M. We’re assuming that this cash flow will be added to the cash balance in our estimates47.
The business is currently trading at a ~$550M market cap. After subtracting the $210M cash balance, that leaves a current Enterprise Value of ~$340M. On top of the cumulative cash flow over the next few years, we’re expecting ~$60M in EBIT in 2025 and ~$134M in 2026.
If we’re correct about the financial trajectory, the current company’s valuation is implying a 5.2x 2025 EV / EBIT multiple (or 21% FCF yield), while by 2026 this significantly compresses to 1.3x EV / EBIT (or 82% FCF yield).
Given that this is a 1) highly sticky software product with negligible churn, 2) the company is likely to continue growing earnings at 20%+ CAGRs well after 2026, and 3) the company will still have ample market share to capture after 2026 (given only ~11% penetration by then), we think the company will likely command a far higher valuation by then.
SmartRent is Trading at ~5x & ~1x Projected EBIT (Source: Hayden estimates)
2025 2026
|
Market Cap |
$ 550 |
$ 550 |
|
– Cash on Balance Sheet |
210 |
210 |
|
= Current Enterprise Value |
$ 340 |
$ 340 |
|
Current EV |
$ 340 |
$ 340 |
|
– Cumulative FCF (2023 – 25 / 26) |
25 |
167 |
|
= Implied 2025 / 2026 EV |
$ 315 |
$ 173 |
|
/ EBIT (2025 / 2026) |
60 |
134 |
|
= EV / EBIT (2025 / 2026) |
5.2x |
1.3x |
Comps are also trading at far higher valuations, even in today’s depressed market environment. Appfolio (APPF) is currently valued at 7.4x FY Sales or a 0.5% FCF yield. Even on 2025 sell-side estimates, the company is trading at ~51x 2025 EV / EBIT or ~47x 2025 EV / FCF. Vivint (VVNT) is trading at 2.6x FY Sales or a ~3% FCF yield. On 2025 estimates, the company is currently trading at ~18x 2025 EV / EBIT and ~17x 2025 EV / FCF.
Even Stratis was acquired by Realpage at an estimated 7.4x Sales multiple48. It’s important to note that this was a distressed acquisition as well, as Stratis was looking to raise funding at the time, and SmartRent had just locked up its Series C. As the #4 competitor at the time, it was much tougher for any VC firm to justify investing in them (especially in the middle of Covid). As such, we believe Stratis was forced to sell itself at a below-market valuation.
Other software / real estate focused companies show similar valuation disparities. Either way you slice it, SmartRent’s current valuation is a fraction of these comparables, and we feel provides ample margin of safety at these prices.
If the market were to appropriately value the company at a reasonable (and still below average software valuation) of 20x EV / EBIT, that would imply a $2.7BN enterprise value by 2026. Combined with its cumulative cash balance, this would imply a $3.1BN market cap by then, or a +455% return over four years (+53.5% IRR)49.
Meanwhile, the company holds ~$210M in cash today (~38% of market cap), and we project will have ~$150M of excess cash left when it reaches profitability. This implies that even in a worst case liquidation scenario and ascribing zero value to the ongoing business / customer relationships, the downside is still just -62 – 73% vs. a potential +455% upside.
Lastly, it’s interesting to note that SmartRent has raised ~$702M in total across all private rounds and IPO proceeds ($146M for seed to Series C, and $556M in the IPO and PIPE transactions). At its current market cap of $550M, investors are currently receiving the company at a -22% discount on the total capital that’s been injected into the company.
SmartRent’s Private Round Valuations
Note: Original issue price is equal to 4x that of share price
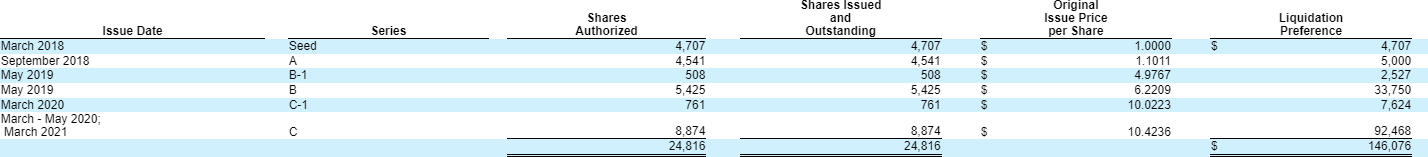
SmartRent’s SPAC IPO Proceeds
Note: SmartRent Financials

Risks & Why This Opportunity Exists
1. The stock is illiquid, and may be too small for most investors.
The company is only ~$550M in market cap, which is considered a very small cap or even micro-cap stock. Additionally, the stock only trades ~2M shares per day, which equates to ~$5.5M in average daily volume. For example, to build just a 2% position ($20M) for a $1 Billion fund, and assuming they purchase 15% of ADV, it would take 24 trading days or ~5 weeks to accumulate the position. As such, it may not be suitable for most funds.
2. The stock fell -60% after Q2 2022 earnings and guidance cut. It may take time for the market to regain confidence in the stock.
On the Q2 earnings report, SmartRent reduced revenue guidance for FY 2022 by -29%. EBITDA loss expectations also expanded 50 – 100% over original expectations. All of this was driven by supply chain issues (i.e. was hard to procure equipment), which led to a reduction in the number of units they expected to deploy this year (-32% reduction).
This had an impact on the stock, as not only were revenue expectations lower and losses higher, but the inability to procure equipment pushed out the overall deployment timeline by a year. This also meant that profitability projections in out-years would be delayed as well (leading to a lower NPV on the stock).
However, it looks like these issues are gradually being resolved. On the 3Q 2022 call, SmartRent mentioned that they were starting to get some equipment from Assa Abloy, who is the problem supplier behind these issues50. Albeit, it’s only ~10% of what the company needs (they need ~3K units per week to meet demand, but are only getting ~300 per week).
SmartRent expects these issues to be resolved fully by next summer, and to “catch up” to its previous deployment timeline by end of 2023. In addition, Assa Abloy also mentioned on its recent earnings call that its own supply issues are starting to get fixed. We expect this to be a temporary issue, and won’t affect the company by 2024.
3. SmartRent may not hit our units deployed targets.
Growing unit count by 4.4x in four years is a big hurdle. We think the company can achieve this, given their already committed two-year backlog of 811K units, which provides a clear line-of-sight to 1.3M units. By 2024, the company would just need to grow this pipeline of committed units by ~36% from current levels, in order to hit our 2026 targets.
However even if the company were to plateau at 1.3M units, we believe that the company would still be able to achieve profitability at this stage. In a “no-growth” scenario, there would no longer be any new deployments, so Hardware and Professional Services contribution margins would disappear.
Offsetting this, the company could likely eliminate a vast majority of Sales & Marketing spend, since that is primarily for acquiring new customers, while keep some staff to maintain existing relationships. Research & Development could also be decreased to just maintenance R&D (few / no new features). General and Administrative costs could also be optimized.
At that level, the company would likely be making ~$90M annually from software revenues, and ~$10 – 20M in profits.
While this certainly wouldn’t be a home-run investment for us in that case, the company would still be trading at a reasonable ~25x EV / EBIT in such a scenario, at the current share price51.
4. There might be some overhang on the stock, as early venture investors sell shares to realize their gains.
We think this issue has been significantly de-risked over the last few months. Bain Capital finished selling their shares in September 2022 (which likely contributed to the drastic stock price decline; LINK). RET Ventures (the original seed investor) has been distributing shares to its LPs over the past year, and has distributed half of their shares during this time period (LINK). It’s likely they’ll be finished in another year.
Fifth Wall first participated in the Series C round, which equates to a ~$2.60 stock price (where the stock price is today), in addition to receiving some sponsor shares at part of the SPAC process. We haven’t seen Fifth Wall sell any shares so far, and our guess is that we won’t see any selling until their shares are further in-the-money.
Management & Board Composition
Lucas Haldeman (Founder & CEO): Lucas founded SmartRent in 2017. Prior to this, he was the CTO and CMO at Colony Starwood Homes (now part of Invitation Homes) from 2013 – 2016, which owned more than 30,000 single family homes. Before that, he was the CIO and CMO for Beazer Pre-Owned Rental Homes from 2012 – 2013, and was the founder of Nexus Property Management from 2006 – 2012.
Hiroshi Okamoto (CFO): Hiroshi joined SmartRent in 2022. Previously he was CFO of Kinkisharyo International, a Japanese manufacturer of light-rail vehicles, based in LA. Before that, he was a Managing Director at Touchstone Capital, an investment bank in Tokyo, and helped advise institutions on acquisitions, dispositions, and investment management of all real estate asset classes.
Alana Beard (Board of Directors): Alana is an advisor to Fifth Wall Acquisition Corp (the VC firm that helped take SmartRent public via its SPAC). She was also at SVB Capital (Silicon Valley Bank) from 2020 – 2021.
Robert Best (Board of Directors): Robert is the founder of Westar Associates, a private real estate development company he founded in 1980. Previously, Robert was an Independent Trustee at Colony Starwood Homes and also was on the board of directors at Colony American Homes.
John Dorman (Board of Directors): John was previously on the board of directors at CoreLogic from 2012 – 2021. He was also Chairman of the Board at Online Resources Corporation from 2010 – 2013, and was the Chairman and CEO at Digital Insight Corporation from 1998 – 2007.
Ann Sperling (Board of Directors): Ann is currently on the board of Apartment Income REIT, was also a director at Apartment Investment and Management Company prior to the spinout in 2018. She was a Senior Director at Trammell Crow Company (part of CBRE) from 2013 – 2021, and was the COO and President at Jones Lang LaSalle from 2009 – 2013. Before that, she was a Managing Director at Catellus (part of ProLogis), from 2007 – 2009.
Bruce Strohm (Board of Directors): Bruce is currently a strategic advisor to Second Avenue Group, a single-family rental platform. Prior to this, he was an Executive Vice President and General Counsel at Equity Residential from 1995 – 2018 and Chief Legal Officer at Equity International from 2018 – 2020.
Frederick Tuomi (Board of Directors): Frederick was previously the CEO of Invitation Homes from 2017 – 2019. Before this, he was the CEO of Starwood Waypoint Homes from 2016 – 2017, and COO of Colony American Homes from 2013 – 2016. Frederick was also an Executive Vice President at Equity Residential from 1994 – 2013.
| Notice that many on the board used to work at SmartRent’s largest customers. These industry connections are very important to SmartRent’s success, and we believe helped the company win the trust of these operators and scale quickly. |
CONCLUSION
It’s been a difficult year, but as mentioned earlier, we’re growing cautiously optimistic. There’s some early “green-shoots” if you know where to look – whether that’s on global inflation starting to ease, China slowly making progress towards lifting Covid restrictions, or simply valuations reaching levels we haven’t seen in over a decade.
This doesn’t mean that we’re out of the woods, and in fact we’re mentally preparing for these markets to remain choppy until well into next year. However, I do think it’s time to start sharpening pencils and getting to work.
In my opinion, the best way to defend against an uncertain macro (and rising rates) backdrop is simply to find growing companies that are trading below 10x future earnings52. For example, Pinduoduo is currently trading at ~5x our estimate of 2025 EBIT (and even lower on FCF)53. Sea Ltd is trading at ~9x sell-side 2025 EBITDA (and much lower on our internal estimates).
SmartRent is trading at ~5x 2025 EBIT. In addition, we also expect all these companies to continue growing earnings at over 20% y/y, well into the decade.
At such a valuation level, rising rates shouldn’t have as much of an impact on the stock price, given the level of pessimism already baked in. Instead, the stock price should be more correlated with the future trajectory of fundamentals / earnings, which is within the company’s self-control. While we have absolutely no clue where interest rates will be in 2025, with enough work, we can have a much higher degree of confidence around what a specific company will earn three years from now.
These types of opportunities are increasing by the day, as the market’s time-horizon has palpably shortened during this period. It seems like no one wants to look out more than a few quarters these days54. Meanwhile, we’re trying to do the opposite and sifting through the rubble to try and find the gems left behind55.
As we navigate this volatile time period, I’ll also strive to be as open and transparent with our partners with regard to what we’re seeing, as possible. Sometimes I may choose to wait until the dust is settled, before discussing certain issues publicly in our letters.
However, I always encourage our partners to reach out offline any time, if they’d like to chat earlier. I’ve always said that Hayden should operate as a family – and as such, we also hope for our partners to actively contribute in their own ways, if they can56. Even if I don’t have a clear answer yet, it may be helpful for our partners to at least hear how we’re thinking about the issue. And given the unique sophistication & expertise of our partner-base, we might even reach a better conclusion together.
I’ll look forward to speaking with many of you over the coming quarters. In the meantime, I wish you the best this holiday season, and a chance to disconnect from your screens to focus on more important matters – the family & friends in your life.
Sincerely,
Fred Liu, CFA Managing Partner | fred.liu@haydencapital.com
Footnotes1 Hayden Capital returns are calculated net of actual fees directly deducted from client accounts, for the period from inception (November 13, 2014) to December 31, 2020. Starting on January 1, 2021, reported performance is reflective of a representative account, managed in accordance with Hayden’s strategy with no client specific investment guidelines or limitations, made no subsequent investments or redemptions, and remains invested. The representative account paid a management fee of 1.5% and incentive fees of 0%. Clients who elect the performance fee option for their accounts may pay higher fees and therefore realize lower net returns, during years of strong investment performance. Individual returns may vary based on timing of investment and your specific fee schedule. Performance results are net of expenses, management fee and incentive fees. Past performance is not indicative of future results. 2 Hayden Capital launched on November 13, 2014. Performance for both Hayden Capital and the indexes reflects performance beginning on this date. 3 Our companies control their execution, and therefore the earnings trajectories. It’s within our control to analyze and judge the feasibility / durability of these earnings trajectories, and express it via position sizing. 4 I encourage our partners to re-read our Q1 2022 investor letter, where I discuss the volatility experienced during prior bear-markets (LINK). I had originally written this as much to mentally prepare myself for the period we were about to enter into, as much as for our partners. 5 We’ll publicly discuss lessons from specific investments in a future letter, after the dust settles from this period. But partners can always reach out offline if they’d like to chat about specific investments sooner. 6 Especially in an uncertain environment, where the market places far greater value in near-term profits than longer-dated ones. 7 This is different than investing in “mature” companies, where the business strength itself may have stayed the same or even deteriorated, despite the share price increase. In such a case, actively limiting the position size makes more sense. 8 In fact, it’s interesting that the top 3 contributors to our performance since inception have added ~121% to our cumulative returns, despite the draw-downs in their share price this year. Part of this can be attributed to us trimming the positions over the last few years. But it also indicates that our long-tail of earlier-stage positions were the detractors to our performance since inception. We’ve explained this “power law” dynamic in prior letters, and would expect a handful of “winners” to more than offset the long-tail of “losers” in the portfolio over time (LINK). However this year, both our winners and losers ended up drawing-down by similar amounts. 9 See our Q2 2020 letter, on the anatomy of 10-baggers (LINK). 10 Partners may have already noticed a new mega-cap in our portfolio recently, for example. 11 From $4.1BN GMV in 2017 to $62.6BN GMV in 2021. 12 For example, the company has dramatically expanded its Shenzhen office in the last two years. Expecting strong growth and facing a structural shortage of tech talent in the region, Sea took advantage of the layoffs in China tech, to hire thousands of developers. 13 New ecommerce users during this period is estimated at ~100M, in Google – Bain – Temasek’s 2022 internet report (LINK). 14 Roughly, we can calculate this by: ~1.8BN SE Asia orders per quarter (Q3 2022) / 6x order frequency per month / 3 months per quarter = ~100M MAUs. 15 For example, Mercado has recently indicated that it would leave the low-AOV market segment to competitors, believing that it’s a different model and the market is large enough for both. 16 As of November 20, 2022. These estimates may not be comprehensive, of all sell-side estimates. 17 It’s not a perfect comparison, but Nubank for example trades at ~5x 2025 EV / EBITDA (~$16BN valuation, ~$3BN projected 2025 EBITDA). 18 As of November 20, 2022. 19 $32BN valuation – $2.8BN for Sea Money – $5.6BN for Garena = $23.6BN implied Shopee value / $2.2BN Shopee EBITDA = 10.7x EV / EBITDA. 20 Forrest Li’s memo to employees on September 15th stated: “Our number one objective for the next 12-18 months is achieving self- sufficiency. This means achieving positive cashflow as soon as we can. Right now, thanks to years of prudent action and hard work, we have a solid cash base that puts us in a safer position than many of our counterparts in the tech sector. However, we can easily run through this cash base if we are not careful, and with investors fleeing for ‘safe haven’ investments, we do not anticipate being able to raise funds in the market.” I encourage anyone interested, to read the full memo here (LINK). 21 Shopee sold ~1.8BN SE Asia orders in Q3 2022. Dividing this by 6x orders per month per user, and 3 months in a quarter, implies ~100M monthly active buyers. 22 Furthermore, Lazada publicly disclosed negative -6% y/y order growth, while Shopee continues to grow +18% y/y. 23 These figures come from CIMB. As of Q2 2022. 24 PDD’s marketing spend is a high % of revenues, because its revenues all come from high-margin take-rates, such as advertising. Sea on the other hand, recognizes revenue on payment processing (which is a pass-through) and also is just starting to charge high-margin take-rates like advertising. 25 Chinese 3PL logistics is extremely efficient, and higher merchant sophistication means fewer account managers needed / higher propensity to pay for advertising. 26 We’ve only included funding / reinvested profits as of 2016, since the company was private and data is hard to come by. Profits and shareholder investments pre-2016 were likely small, so it should affect the analysis by much. Even if so, it would only make this analysis more conservative (i.e. a lower return on capital). 27 We don’t have cash flow information for the segment, but EBITDA is a good proxy. 28 In fact, this is exactly what Tik Tok is doing, with their 0% commissions for merchants. It still remains to be seen how successful Tik Tok will be as a competitor (and how much cash they can burn), but it’s something we’re watching closely. 29 The company just opened 5 new distribution centers, and we’ve heard they’re building a new sorting facility, for example (LINK). 30 These loans could be recouped quickly, since SeaMoney loans only have an average 4 month maturity (LINK). 31 In fact, we heard several years ago that Amazon had made an (albeit unconfirmed) bid for Shopee alone at ~$25BN – back when Shopee was only $17BN GMV, or ~1/5th its current scale. 32 The market seems to realize this, but typically doesn’t want to be along for the journey during these types of transitions. I’m expecting the stock price to “muddle along” during this period, before investors can see a “light at the end of the tunnel”. 33 Many of these customers are publicly traded REITS, who publicly share their tech & capex plans with their shareholders. 34 The company’s CFO has previously indicated to us that they expect ~70% operating margins on the software revenue over time. 35 Implies an average of 2.4 units per rental property. 36 Source: Tegus 37 Latch’s equipment is higher-end, and tends to be 50% more expensive than comparable SmartRent equipment. 38 These investors don’t have the benefit of the MFN though, as that was only for the seed round investors. 39 While we suspect Nexpoint is a SmartRent customer, we haven’t been able to specifically confirm this. However the capex spend per unit and description of the “Smart Home Technology Package” matches SmartRent’s product offering. 40 SmartRent is currently facing supply chain issues, which we’ll talk about later. 41 SmartRent roadshow presentation: LINK 42 We expect this will increase further, as more customers adopt FusionHub and supply chain issues ease. 43 In addition to the 5% of the portfolio deployed in 2021, they will have 65% of their portfolio deployed by YE 2023. 44 We’re assuming there may be some lingering supply chain effects, so conservatively are estimating cumulative deployed units is slightly lower than this by 2024. 45 Some of this is attributable to the Sightplan acquisition. 46 Installation expenses are included in the COGS line-item for professional services. 47 Instead of being used for acquisitions, reinvested, or returned to shareholders. Any of these other avenues may increase the stock’s IRR. 48 The company was bought by Realpage for $65M in 3Q 2020. It’s reported that revenues were $8M in 2019, and have barely grown since then (Realpage hasn’t done much with the asset). We’re estimating they grew ~10% in 2020, implying a 7.4x sales multiple. 49 Returning this excess cash to shareholders, or using it for an accretive acquisition would increase these IRRs even further. 50 The issues in particular are with the HID units that Assa Abloy produces (they have 60% global market share in this), and the custom Yale locks. 51 Assuming cumulative cash burn of ~$40M by 2024, and $15M of profits. 52 Not that 10x is a magical number… 53 We plan to publish our PDD write-up within the next few weeks. 54 I’ve watched a number of stocks pop +30-50% after reporting great earnings, just to trade back at prior levels a month later (despite no additional news afterwards). It seems to me that investors are simply looking at what’s going to “beat” earnings in the next quarter, but aren’t willing to *own* anything for longer than a few months in this environment. Unless a company has a continuous string of positive catalysts / momentum, it seems that most market participants are just “renting”, not “buying”, shares these days. 55 i.e., companies that might not have positive catalysts in the next few quarters, but look attractive over the next three years. 56 Partners have contributed in various ways. Sometimes its introductions to experts, access to research / data, relaying what they’re seeing on the ground in their respective fields, or simply acting as a sounding board.
|
Editor’s Note: The summary bullets for this article were chosen by Seeking Alpha editors.
Editor’s Note: This article covers one or more microcap stocks. Please be aware of the risks associated with these stocks.
Be the first to comment