


Where is the bottom?
umbertoleporini/iStock via Getty Images
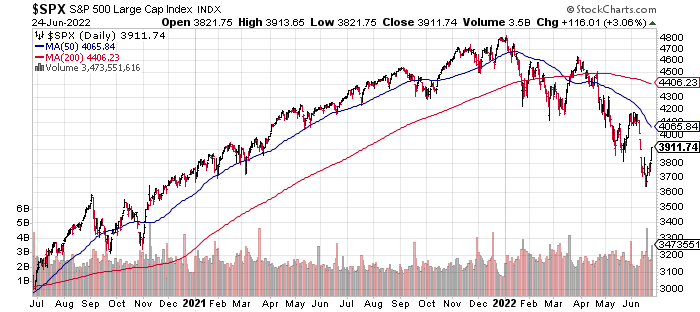
The equity markets had a nice bounce last week, but as you can see from the chart of the S&P 500 below, the overall primary trend is still down. The technical term for last week’s move would be a “bear market” rally. This is a dangerous one to buy into. In comments out today, after I wrote my article over the weekend, Morgan Stanley came out with a similar conclusion as I did.
www.stockcharts.com
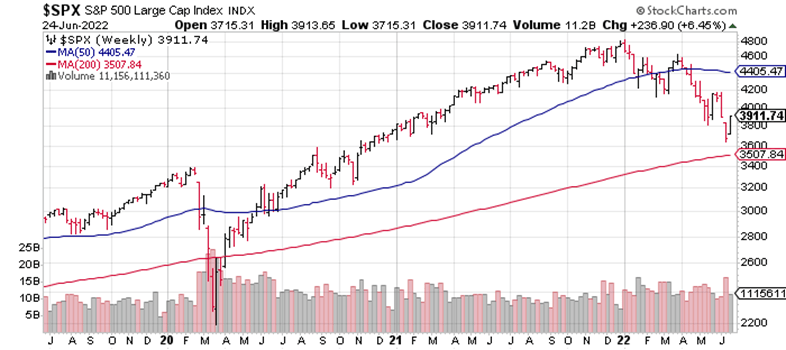
I do not foresee a “V” shaped turnaround in the market like the one we had back in March 2020 (as shown below).
v-shaped (stockcharts.com)
We nailed the bottom in 2020, and we also rode it for all it was worth for over one year. See our bottom article from March 16, 2020, here. We then predicted a “V” shaped recovery in an article several weeks later. We were right again.
As you can see from the chart below, that ferocious rally of 2020 began after a precipitous drop in the market. We don’t have that same falling off the cliff this time around, however.
Instead, we have a steady drop lower. In addition to this, we basically had just one factor causing the sell-off in 2020. That factor was obviously the pandemic. This time around we have a sea change in interest rates, a bout of persistent inflation, continued supply chain issues, and a likely recession in our near future.
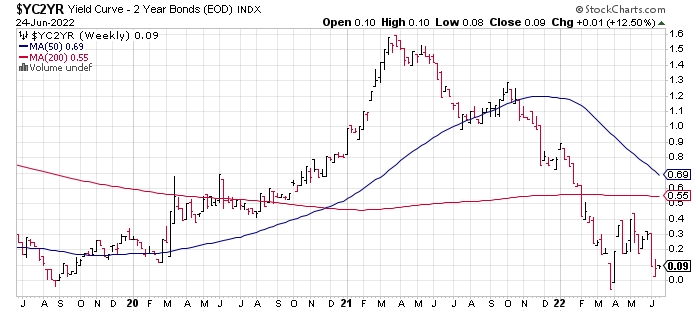
See below where the yield curve ended last Friday. It has been in a steep nosedive since March 2021. It’s now just 9 basis points away from inverting.
stockcharts.com
I have been a professional money manager and analyst for the last 23 years. From my experience, these are not the conditions that create a “V-shaped” recovery in the markets, like many hoped for last week.
I watched the Nasdaq go down 79% during the 2000-2002 “dot-com” sell-off. I also watched the S&P 500 go down 53% during the financial crisis. During those two bear markets, there were numerous rallies that lasted several days, but then they petered out, and the market went even lower the next time. That’s the pattern that I foresee for now until we see a bottoming and an eventual trend reversal.
Look again at the first chart shown in this article of the S&P 500. Do you see a bottom being formed? Right now, that’s not even close to happening. When that bottom is built it needs a good solid foundation of at least 6-8 weeks long.
The market will more than likely lose all its gains from this last week and then some, only to go on and make new lows in the indexes. I also have learned during my over two decades in the business to not buy into downtrends.
Nobody knows where that bottom is in a plummeting chart. You are taking a big chance buying a downtrend. How do you know that is the bottom? It more than likely is not. Wait for the chart to mellow out and start going sideways.
Almost all new uptrends are preceded by a nice sideways base. You may not catch the exact bottom, but by waiting for a bottom to form, you are increasing your probability of success. I personally wait for a new uptrend to begin (breakout) from that firm base.
Despite the temptation of greed, I’m going to remain in a fairly neutral and slightly bearish stance for the sake of protection right now. As far as earnings go, that’s also a fast-approaching big wild card. I have seen the consensus target price for the S&P 500 come down from 5,300 to 4,900 over the last several weeks. That is still way too high. Along with several other firms, I’m closer to 4,200 with earnings season looming just around the corner.
You can see how I come up with the weekly target price that I publish for my subscribers in an article I wrote two weeks ago. In that article, I offered my observations of how the community of analysts as a whole is almost always behind the curve. Once again, their current target price for the S&P 500 is way off the mark.
This could be the first disappointing earnings season that we have seen in several years. Right now, the consensus is for a meager 4.3% growth in earnings over the same quarter last year. In addition to this, Q2 GDP could easily come in negative for the second quarter in a row. That would mean that technically we are already in a recession.
It was tempting to get greedy and buy into last week’s rally, but a bottom in the market has not occurred yet. It will eventually happen, though, and the probabilities of a sustainable rally will be a lot better than they are now. It is prudent to remain patient for now.
Having said that, there are still some sectors within the market that look decent right now, despite an overall downtrend for the indexes. This recent sharp pullback in the energy sector has once again created some good buys. We wrote about one of our current favorites in this sector in our last individual stock article.
Stocks in the solar sector like Enphase (ENPH), Daqo New Energy (DQ), and SolarEdge (SEDG) also look good right now. In addition to this, the big rally last week created some opportunities in the inverse ETFs once again. We wrote about several of our favorites in our most recent article.
We continue to run well ahead of the averages since we first offered our premium subscription service back on Jan. 1, 2019. We continue to publish our five portfolios every Saturday, with live trades all throughout the week.
Just like in March 2020, a bottom will eventually occur in the market. We are not yet there, however. This time around, we have a lot more obstacles to overcome than we did back then. Don’t get greedy. Be patient, and in the meantime take advantage of the very few areas of the market that are working this year.
Be the first to comment