

sefa ozel
Thesis
I’ve analyzed Harte Hanks’ (NASDAQ:HHS) stock price action over the last 4 years using TrendSpider Software and found a trading strategy that has worked well since the company’s turnaround. The conclusions we can draw from backtesting are straightforward – the algorithm calls for buying HHS at the current level. The company’s valuation after the recent sell-off offers enough potential to support this conclusion.
Harte Hanks and my previous theses
Harte Hanks, Inc. is a micro-cap company with a market capitalization of $75.88M at the time of this writing. It operates as a customer experience company in the US and internationally, dividing its operations into 3 segments:
- The Marketing Services segment delivers strategic planning, data strategy, performance analytics, creative development and execution, technology enablement, marketing automation, and database management;
- The Customer Care segment operates teleservice workstations in the United States, Asia, and Europe to provide advanced contact center solutions such as speech, voice and video chat, integrated voice response, analytics, social cloud monitoring, and web self-service;
- The Fulfillment & Logistics Services segment includes printing, lettershop, advanced mail optimization (including commingling services), logistics and transportation optimization, and monitoring and tracking to support traditional and specialty mailings.
Since my last call, the company has not provided any new financials. To understand what happened in the above segments in the last quarter, I would like to quote my last article, where I analyzed the fundamentals in more detail.
Let us now turn to the company’s recent earnings call to understand what management expects in Q3/Q4 2022 and perhaps 2023.
As you may see, the above-mentioned decrease in total revenues is due to a sharp decline in the Customer Care segment, which is due to the expected discontinuation of projects related to COVID. However, according to the CEO, this segment is expected to return to higher demand from existing and new customers in Q3 2022 as the company onboards agents to support the premiere of House of the Dragon. As the margins of this segment have improved on a half-year basis (due to cost optimizations), I expect that we will see revenue growth as well as EBITDA and EPS growth (at roughly the same margin level) in Q3 2022 due to new demand.
As for the Fulfillment & Logistics business, the company has exceeded its own margin expectations – EBITDA of sales is 13.5% in 2H 2022, significantly better than in 2H 2021. The consolidation of operations into the Kansas City and Boston facilities, which I mentioned in the last article, is bearing fruit – Harte Hanks has a rapidly growing customer base and order book, while the major competitors in this industry are suffering from the size of their operations. Margins for this HHS segment will most likely stop increasing – or even decrease slightly – due to the impact of consolidation, but we will most likely see a positive change again in Q3 2022 due to the new volume.
The Marketing Services segment is currently facing temporary difficulties – as expected, customers’ advertising budgets began to shrink due to uncertainty about the impending recession. However, HHS management remains optimistic, talking about a new partnership with a regional bank signed in Q2 2022.
At the time, HHS’ financial success allowed it to exceed EPS expectations by nearly 90% and show roughly expected revenue, according to TradingView:
Tradingview, HHS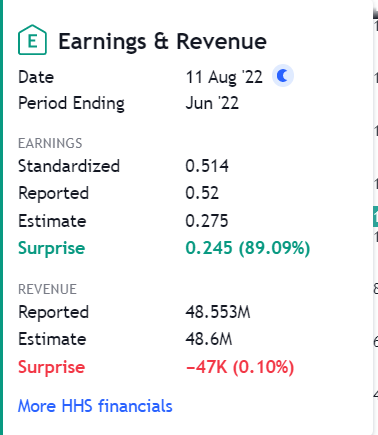
My coverage began a month before that August report when I drew attention to the company’s fairly strong growth against a backdrop of modest valuation. I was also taken with the planned sale of preferred stock – this was to simplify the company’s capital structure, and the one-time cost of such disposal while maintaining a steady growth rate should have paid off very quickly.
The stock was gaining momentum at that point, and after my initial call, HHS went up 50% in a few days. Then I looked at the price action and realized that HHS had moved too far away from all the major moving averages and the forwarding valuation multiples were no longer low enough to provoke a similar rise.
Therefore, I have downgraded the rating from “Strong Buy” to “Buy” and reminded everyone that mean reversion is inevitable in such cases. It has been 35 days since the last article was written and HHS has fallen from $17.22 to the current $10.74 – that is -37.63%. The reversion to the mean occurred against a backdrop of general market weakness – over the same period, the S&P 500 Index fell 11.44%. So, given HHS’s micro market capitalization, it’s not surprising that momentum has changed so quickly.
So what about now?
As the stock continued to fall, I was repeatedly asked in the comments when HHS would return to the buy zone. Even long-term investors do not want to see big unrealized losses, even if they are convinced of the company’s fundamental prospects, so technical analysis becomes as important as fundamental analysis.
Since the company has not yet released financials (the Q3 report will be available on November 11) and the recent news about the partnership with FEVO is difficult to quantify, this time I decided to spend more time analyzing price action.
I have included the data for the last 4 years – this is the period that has become a turning point for the company. Before that, Harte Hanks had problems with debt, with corporate development strategy. When new management came in and new initiatives emerged that led to a revitalization of the business, HHS stock price began to recover quickly – this just happened in the last 4 years.
Considering today’s oversold conditions (RSI below 30), I wonder if the current extremely low levels of the RSI are a sufficient argument for buying HHS. But to check that, you have to base the criterion for exiting a position – why not focus on the RSI again? For the exit, I chose the other extreme of this indicator – an extremely overbought RSI level of 75 and higher (I remind you that theoretically the stock is already considered overbought at the RSI >70).
After analyzing the last 4 years, TrendSpider’s backtesting system has produced the following results when applying the strategy described above:
| Data Analyzed | 4 years |
| Net Profit | 203.61% |
| Asset Perf. | 42.18% |
| Beta (vs Asset) | 1.62 |
| Positions | 5 |
| Wins | 80% |
| Losses | 20% |
| Max Drawdown | -71.63% |
| Average Win | 50.78% |
| Average Loss | -27.45% |
| Average Return | 35.13% |
| Rew/Risk Ratio | 1.85 |
| Expectancy | 1.28 |
Source: TrendSpider, author’s inputs
That is, in the last 4 years, only 5 positions were opened, but despite the drawdown in one of them by 27.45% (holding period from October 2018 to September 2019), the cumulative return was 203.61%, which is 4.83 times more than a buy and hold strategy would bring. If we look at the behavior of the strategy, we find that the drawdown of the underlying was over ~85% since the start of the system testing, and the drawdown of the strategy was slightly better – about 71%:
TrendSpider, HHS, Performance Chart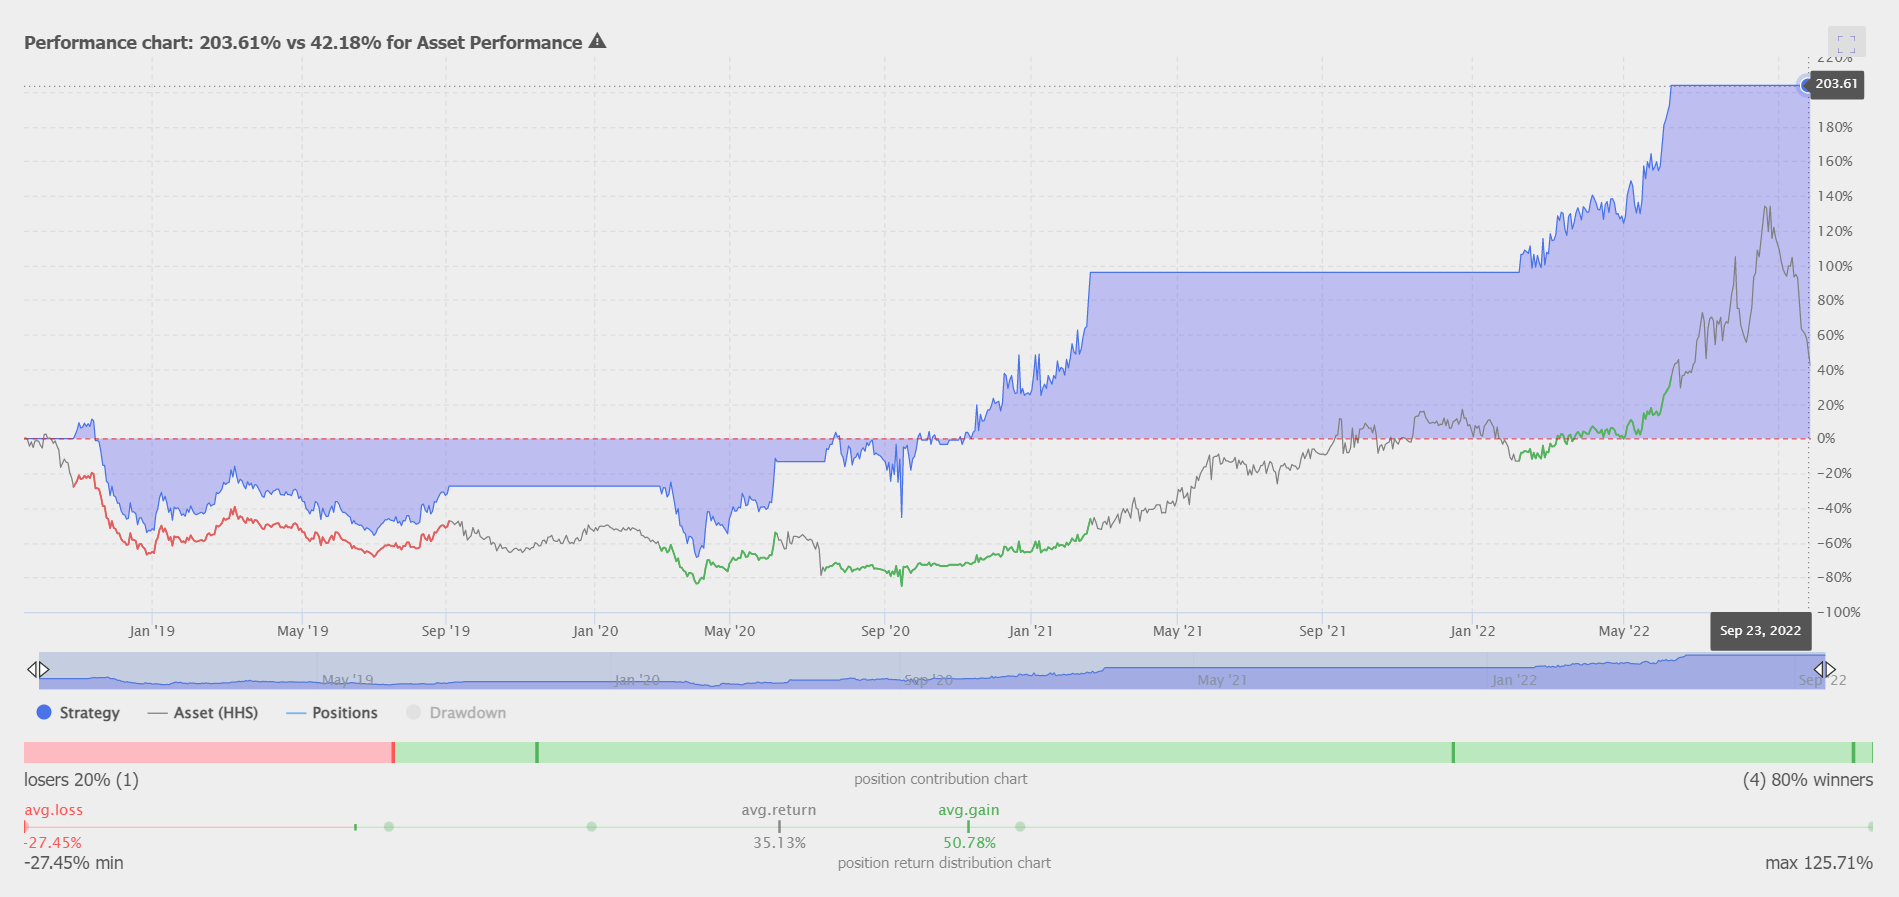
The average trade opened below RSI 30 and closed above 75 earning the hypothetical investor an average of 35.13%, with the average position held open for about half a year.
And what is most important for us now is that the 5th deal, which the system also takes into account in its calculations, was opened yesterday:
TrendSpider, HHS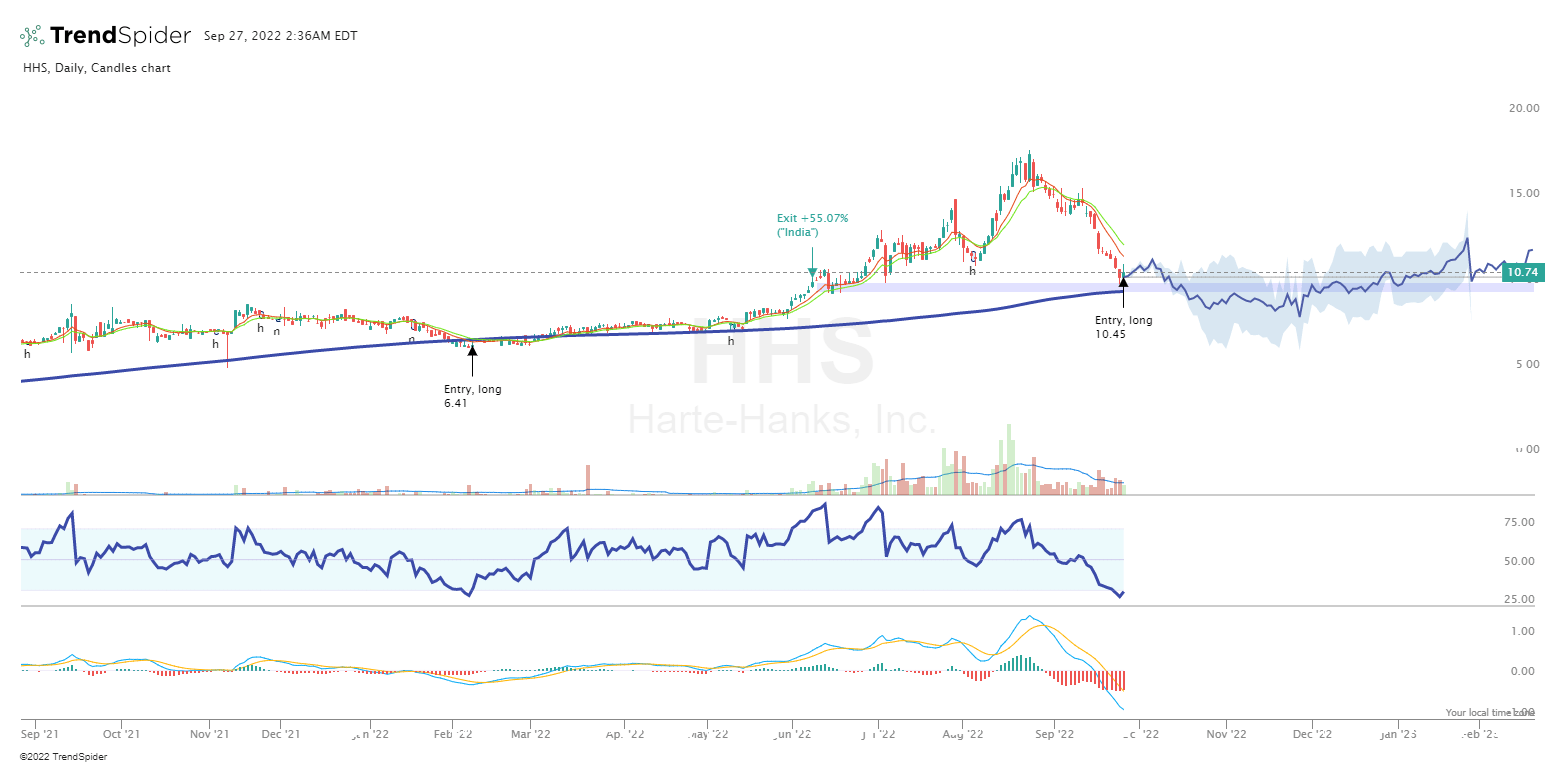
The current situation is reminiscent of a mid-July 2020 trade, when HHS lost 60% from its local high and the system called to buy, against the backdrop of an RSI of 24 and a negative MACD, which only gained negative momentum.
TrendSpider, HHS, July 14, 2020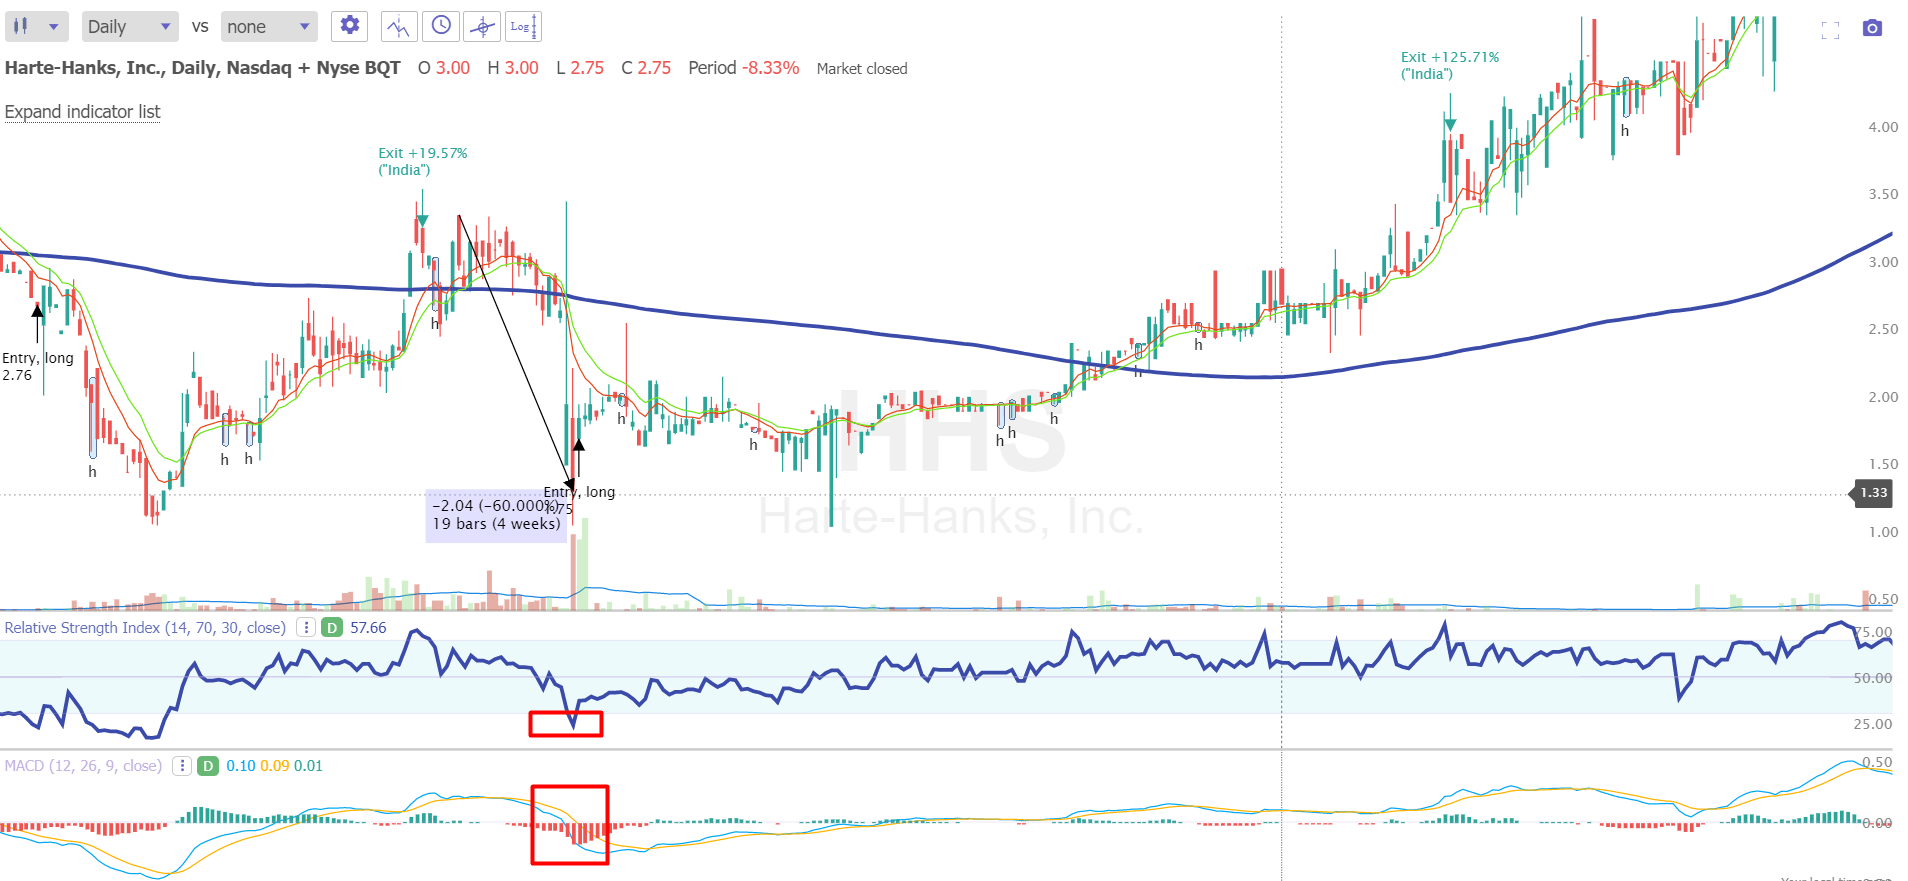
That trade turned out to be one of the biggest winners after 6 months with a gain of 125.71%. Does that mean we should expect a similar result now? I think not.
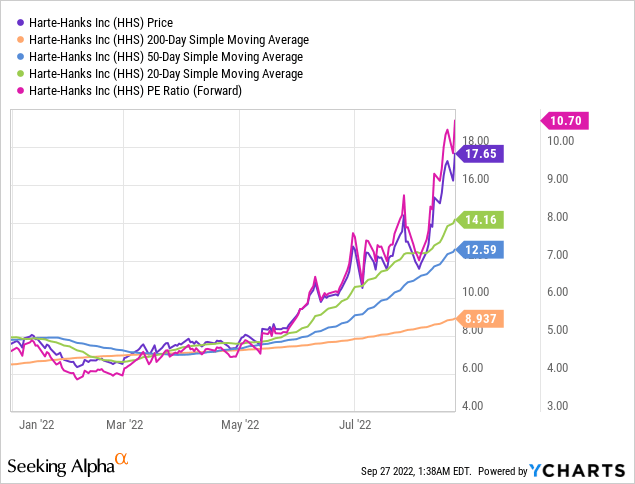
It is only a matter of the difference in the valuation of the company then and now. As soon as Harte Hanks’ business turnaround became apparent, the few analysts watching the company at the time built favorable models that resulted in extremely low forward P/Es, literally below 2x. At that time, a new stock price trend was born that resulted in the current forward P/E being many times higher than those values.
Ycharts, HHS, author’s notes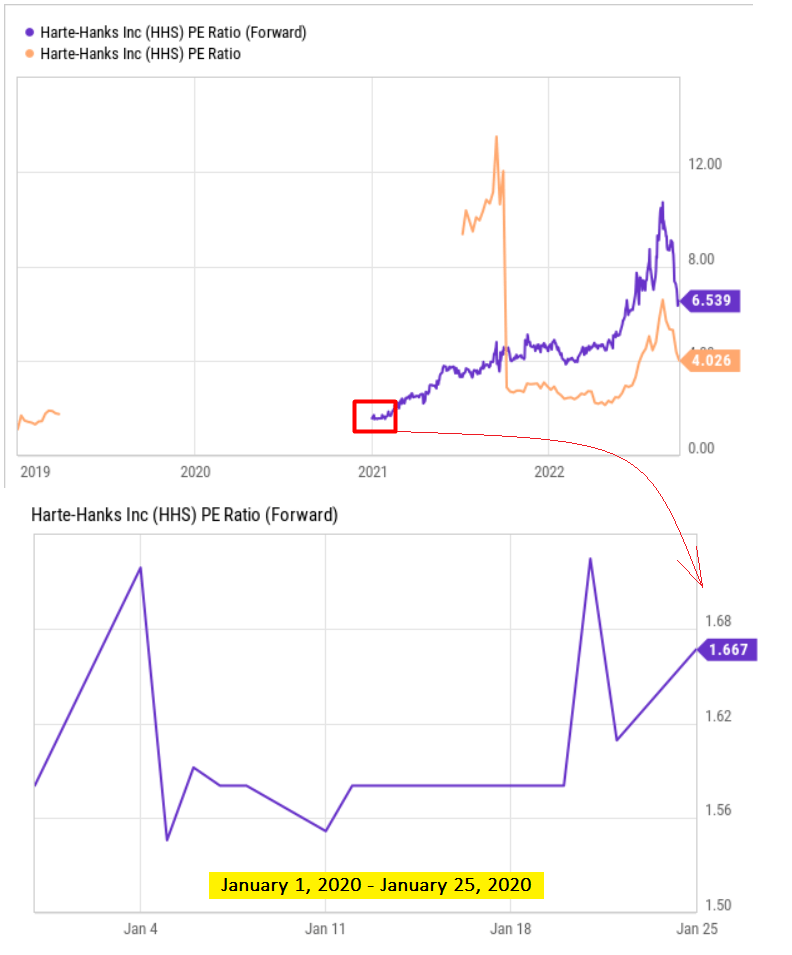
Nevertheless, taking into account the existing growth potential, the current valuation multiples cannot be described as too high in absolute terms – compared with the sector to which the company belongs, it definitely still has room for growth, in my view.
Seeking Alpha, HHS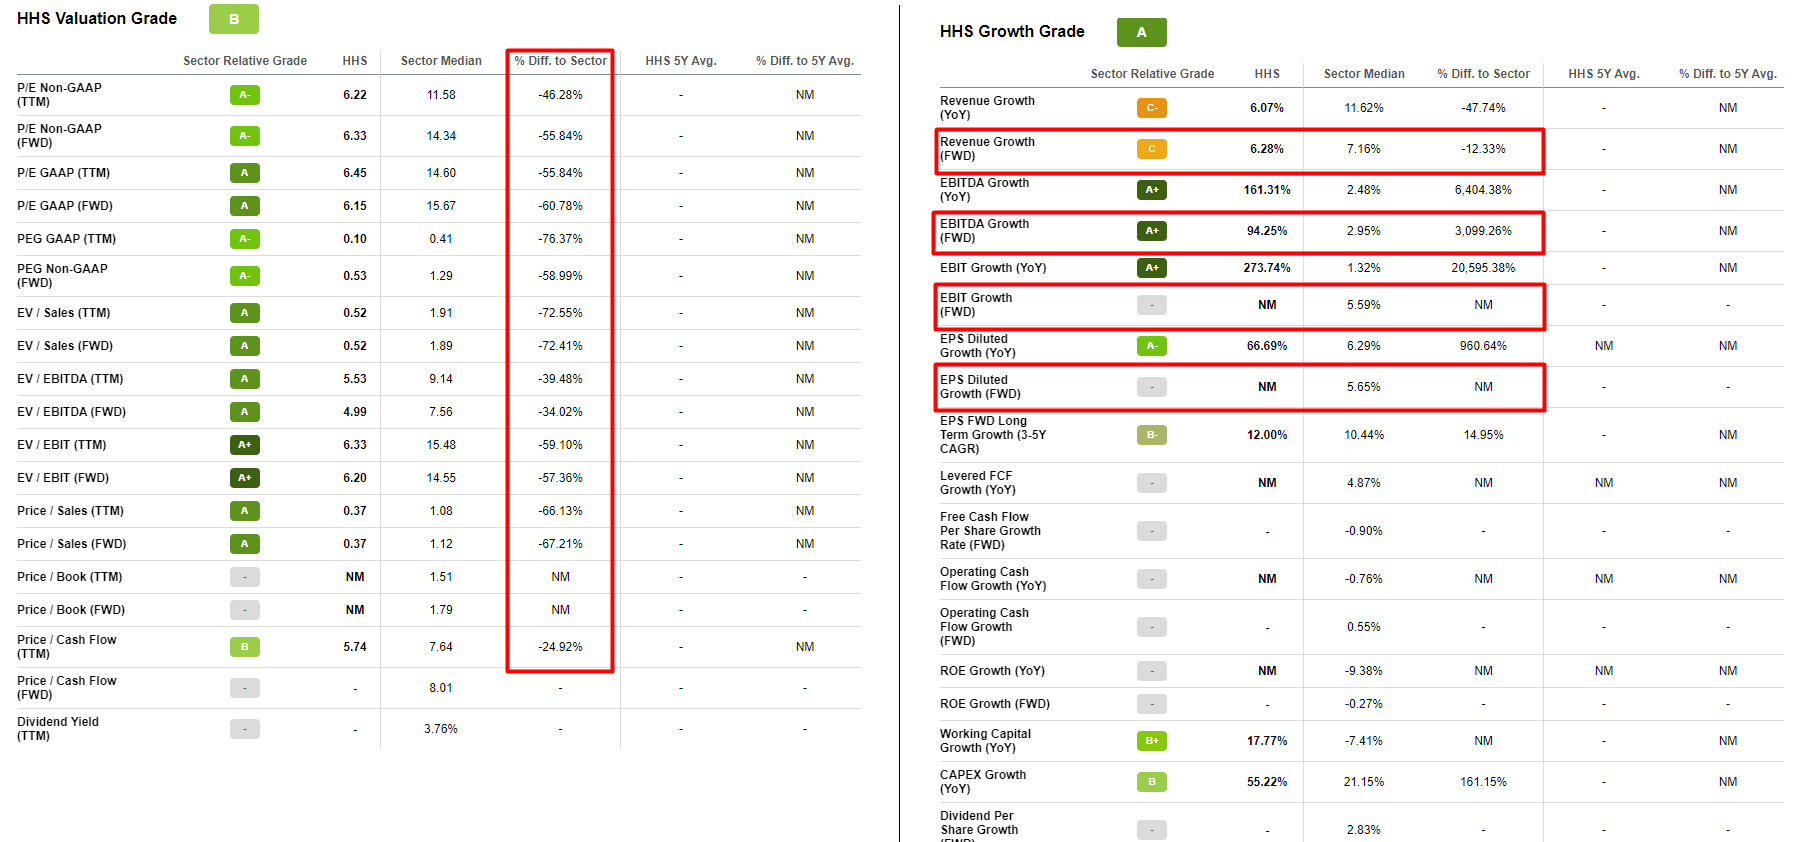
Moreover, it seems very likely to me that HHS will continue to beat the forecasts of some analysts whose conclusions tend to be modest and variable.
Seeking Alpha, HHS, Earnings, author’s notes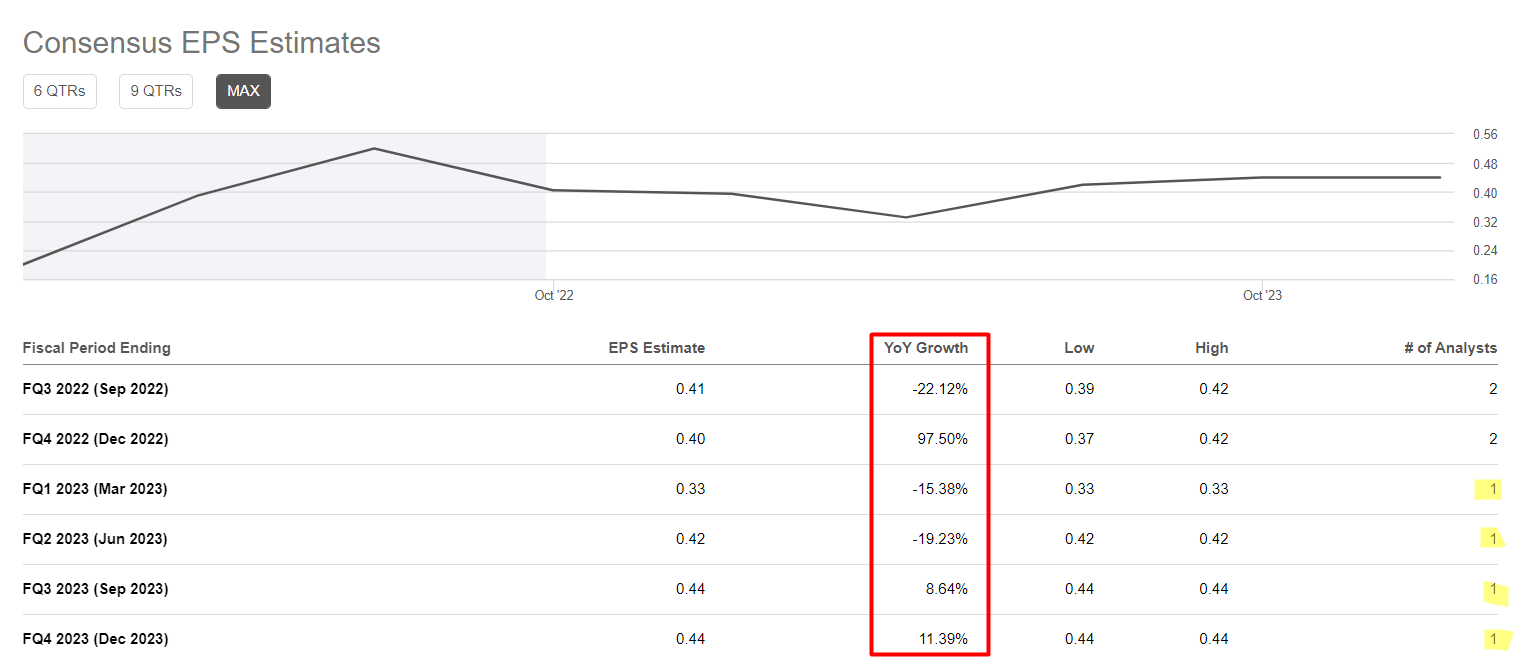
Therefore, I think it makes sense to use the current trading signal for at least part of the desired amount – the AI algorithm draws above $12 per share by the end of January 2023, with drawdowns possible along the way. This is a speculative target, which may be higher in the longer term.
But, of course, I must warn you about the risks involved. First, technical analysis is only one tool, and by no means the only one, for making investment decisions. I recommend that anyone interested in the Harte Hanks company thoroughly study all recent financial reports, transcripts of earnings calls, and analytical research papers of other analysts so that you know exactly what you are buying. Secondly, you could find out for yourself how unstable the market situation is at the moment. If the current environment prevails for some time, this strategy will most likely prove meaningless, or it will force you to sit in a losing position longer than you expected for the bear scenario.
Happy investing and stay healthy!
Final note: Hey, on September 27, we’ll be launching a marketplace service at Seeking Alpha called Beyond the Wall Investing, where we will be tracking and analyzing the latest bank reports to identify hidden opportunities early! All early subscribers will receive a special lifetime legacy price offer. So follow and stay tuned!
Be the first to comment