


hrui
This article was co-produced with Dividend Sensei.
Do you love safe high yield?
I know I do.
There’s nothing like a safe yield of 5%-plus to help pay the bills during retirement.
Just as importantly, when you’re getting paid generous, safe, and steadily growing income, it’s a lot easier to stay calm, sane, and safe during inevitable bear markets like this one.
But do you know what’s even better than a safe 5% yield?
A safe 5% yield growing at 5% to 8%. That’s 2.5X to 3.5X the long-term expected rate of inflation, and ensures that your standard of living in retirement keeps rising, no matter how long you live.
But do you know what’s even better than a fast-growing 5% yield? If the stock paying it is growing earnings at 10% to 13% over time.
That allows you to enjoy a rich yield today and a rich retirement tomorrow, courtesy of 15% to 18% long-term total returns.
Now imagine all this could be had at a 17% discount to fair value, from a blue-chip quality company that’s benefiting from a $700 billion to $120 trillion secular growth trend, the largest in human history.
In other words, that 15% to 18% annual total return isn’t just one you might enjoy for a few years, or a decade, but possibly for decades to come.
Does this sound like an incredible opportunity? It’s exactly what Hannon Armstrong (HASI) offers today.
It’s an opportunity so good that Brad Thomas has made HASI one of his top 5 picks in the Dividend Kings Top Buy List.
And it’s an opportunity so good that I’ve personally bought 100 shares of it and added it to the Dividend Kings ZEUS Income Growth portfolio.
What’s more, I’m planning on making HASI 2.5% of my overall portfolio and life savings in the next year or two, and so is my uncle.
In other words, HASI isn’t just an opportunity worthy of a few hundred dollars or even a few thousand. It’s one I’m personally comfortable investing around $75K into over the next 12 months or so and several hundred thousand dollars into within a few years.
-
eventually I plan to invest several million dollars into HASI in the coming decades
Let me show you the three reasons why.
Reason One: One Of The World’s Best BDCs
I’m recommending HASI today partially because it’s in the worst bear market in its history, currently down 52% off its highs.
-
it recently bottomed at -60%
Why did I crash? Mostly valuation.
HASI Was 115% Historically Overvalued When Its Bear Market Began
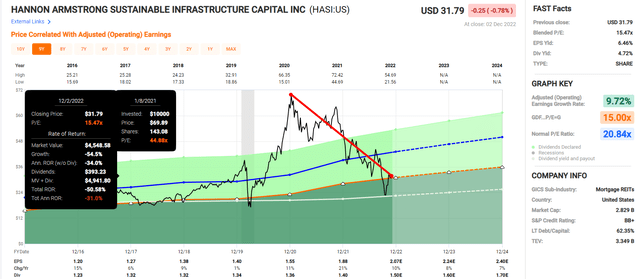
FAST Graphs, FactSet
HASI is historically worth 20 to 22X earnings, and it hit a PE of 45 during the Pandemic speculative bubble.
-
Even God’s own company will be a terrible investment if you overpay by 115%
For context, the S&P 500’s peak overvaluation during the Tech bubble was 50%.
HASI Historical Returns Since May 2013
HASI’s nine-year returns have been exceptional, consistently delivering Buffett-like returns of 22% to 25% per year.
But from bear market bottoms?
-
as much as 187% within 12 months
-
three-year returns as high as 55% annually = 3.7X in three years
-
five-year returns as high as 35% annually = 4.5X in five years
-
seven-year returns as high as 31% annually = 6.8X in seven years
Why am I confident that fundamentals do not justify HASI’s worst bear market ever?
Why Hannon Armstrong Is A High-Yield Green Energy Powerhouse
It was founded in 2012 in Annapolis, Maryland.
“Hannon Armstrong (NYSE: HASI) is the first U.S. public company solely dedicated to investments in climate solutions, providing capital to assets developed by leading companies in energy efficiency, renewable energy, and other sustainable infrastructure markets.
With more than $9 billion in managed assets, our core purpose is to make climate-positive investments with superior risk-adjusted returns.
Our investments take many forms, including equity, joint ventures, land ownership, lending, and other financing transactions. In addition to Net Investment Income from our portfolio, we generate ongoing fees through gain-on-sale securitization transactions, asset management, and other services” – HASI
HASI is basically a BDC specializing in green energy renewable infrastructure.
HASI has over $9 billion in assets but has only invested $3.9 billion so far across over 365 investments, averaging $11 million each. The average investment is designed to last 18 years.
-
average investment yields 7.4%
-
32% residential solar
-
24% wind
-
17% utility-scale solar
-
9% community solar
-
7% public sector
-
2% green real estate
-
2% green infrastructure
HASI’s investments are in 48 states and represent over 16.4 GW of power generation.
-
17 nuclear power plants worth
-
enough to run 17 large US cities
HASI’s growth over the last five years has been exceptional.
-
managed assets up 17% per year
-
net investment income: 21% per year
-
distributable income per share: 10% per year
-
return on equity: 11.2% in 2021 vs. 10.2% in 2017
Despite the worst-bear market in its history, this kind of growth is why HASI has delivered 17% annual total returns, which is far better than its peers and almost any other investment strategy.
-
HASI: 17.4% annual total return
-
Nasdaq: 17.1% annual total return
-
S&P 500: 12.3% annual total return
-
S&P ESG index: 11% annual return
-
renewable energy index: 7% annual return
HASI makes money in two ways.
-
investment income of its investments: 7.4% average yield
-
fee income from managing institutional money
-
fee income from packaging green energy bonds and selling them (recycling capital to make other investments)
HASI helps institutions to invest in renewables across the entire capital stack, from tax equity (harvesting tax breaks) to senior and junior debt, to preferred shares and common stock.
That’s with $3.9 billion worth of deals, and its portfolio is growing 22% per year, including over $625 million worth of deals expected to close by the end of 2023.
-
a 16% growth in the portfolio, not counting any new deals through the end of next year
99% of investments are so far performing at or above expectations.
-
skilled management’s due diligence process is very good at avoiding value/yield traps
HASI’s pipeline of potential investable projects is over $4.5 billion.
-
allowing it to double its portfolio size
BB+ Stable Credit Rating From All 3 Rating Agencies
“Our ratings on HASI reflect its relatively low leverage, conservative underwriting standards, and experienced management team. The company typically operates with leverage below its target of up to 2.5x debt to equity and has had a strong underwriting track record on a diverse portfolio of infrastructure investments. The company’s niche position partially offsets these strengths relative to larger competitors, such as banks and insurers. Also, HASI has some large single investments, although they are typically multiple underlying projects.” – S&P (emphasis added)
HASI is rated BB+ stable, the highest level of junk bond.
-
Thus speculative and a 2.5% or less max risk cap
S&P loves its excellent management, conservative underwriting, relatively low leverage, and portfolio diversification.
How good is HASI’s underwriting? Since it began investing in 2012, pre-IPO, its total credit losses have been less than 0.2% of its portfolio.
So why is it junk bond rated? Because it’s still relatively small, a minnow in an ocean of giant institutions such as banks and insurance behemoths.
As HASI grows and diversifies its portfolio, it’s likely to achieve an investment-grade credit rating.
-
and even better profitability and lower costs of capital
-
already 80th percentile historical profitability vs. its peers (a relatively wide and stable moat)
How impressive is HASI’s profitability? Its net profit margin is 53%, and that’s been relatively stable since its 2013 IPO.
The Inflation Reduction Act or IRA is expected to represent a major tailwind for HASI, providing up to 10 years of tax benefits that it knows how to capitalize on.
HASI has over $1.2 billion in short-term liquidity, enough to cover its upcoming investments 2X.
It has minimal ($144 million) in debt maturing through 2024, the recession year.
93% of that debt is fixed-rate, and its debt/equity (leverage ratio) is 1.7X, below the 2.5X S&P, Fitch, and Moody’s considered safe for this industry.
HASI has seven funding sources which is why, in a recession, it actually benefits from tightening financial conditions.
-
when money gets tight, those with money earn higher investment yields on new renewable energy projects
Just how large is HASI’s growth market?
-
according to Bloomberg, to achieve 2050 global carbon neutrality (the official goal), $4 trillion per year in green energy/infrastructure investments are needed for the next 30 years
-
a potential $120 trillion investment opportunity
-
a potential 30,000X potential increase in the portfolio
-
in North America alone $700 billion investable opportunity through 2050, according to management
Management is confident that demand for green energy will be so high that it will be able to achieve around 11% returns on equity going forward.
-
on a virtually limitless portfolio expansion opportunity
In the first three months of 2022, HASI has closed on $944 million worth of new projects, an annual investment run-rate of over $1.2 billion.
-
$273 million in deals closed in Q3 2022 alone
-
its current liquidity alone could fund another year of such growth
-
representing 30% portfolio growth
In Q3 HASI grew its EPS by 20% YOY, and expanded its potential 12-month investment pipeline by $500 million to over $4.5 billion. And that’s just projects it’s looking at for the next year.
HASI’s EPS payout ratio in 2022 is expected to be 73% vs. 95%, safe for this industry, and its cash flow payout ratio is even better.
-
38% cash flow payout ratio
-
HASI is retaining $211 million in post-dividend cash flow, which it can reinvest
-
HASI’s EPS payout ratio is expected to keep drifting lower to 71% by 2024
-
the cash flow payout ratio is likely also to keep falling
Management is guiding for 10% to 13% long-term EPS growth and plans to grow the dividend at 5% to 8%, one of the fastest growth rates in the industry, while it keeps lowering the payout ratio.
-
making the dividend steadily safer
-
and freeing up more retained earnings and cash flow to reinvest
That means management’s guidance is for:
-
4.7% yield + 11.5% growth = 16.2% CAGR long-term returns
Bottom Line: Hannon Armstrong is like the Brookfield of renewable energy and is a 5% yielding way to profit from a $700 billion to $120 trillion growth market.
Reasons To Potentially Buy Hannon Armstrong
|
Metric |
Hannon Armstrong |
|
Quality |
75% 11/13 Speculative Blue-Chip BDC |
|
Risk Rating |
Low Risk |
|
DK Master List Quality Ranking (Out Of 500 Companies) |
410 |
|
DK Master List Quality Percentile |
19% |
|
Dividend Growth Streak (Years) |
3 |
|
Dividend Yield |
4.7% |
|
Dividend Safety Score |
75% |
|
Average Recession Dividend Cut Risk |
1.0% |
|
Severe Recession Dividend Cut Risk |
2.50% |
|
S&P Credit Rating |
BB+ Stable Outlook |
|
30-Year Bankruptcy Risk |
14.00% |
|
LT S&P Risk-Management Global Percentile |
84% Very Good, Low-Risk |
|
Fair Value |
$38.49 |
|
Current Price |
$31.79 |
|
Discount To Fair Value |
17% |
|
DK Rating |
Potential Reasonable Buy |
|
PE |
14.4 |
|
Historical PE |
20 to 22 |
|
LT Growth Consensus/Management Guidance |
10.8% |
|
5-year consensus total return potential |
16% to 23% CAGR |
|
Base Case 5-year consensus return potential |
18% CAGR (4X S&P 500) |
|
Consensus 12-month total return forecast |
57% |
|
Fundamentally Justified 12-Month Return Potential |
26% |
|
LT Consensus Total Return Potential |
15.5% |
|
Inflation-Adjusted Consensus LT Return Potential |
13.2% |
|
Consensus 10-Year Inflation-Adjusted Total Return Potential (Ignoring Valuation) |
3.45 |
|
LT Risk-Adjusted Expected Return |
9.33% |
|
LT Risk-And Inflation-Adjusted Return Potential |
7.00% |
|
Conservative Years To Double |
10.28 Vs 15.2 years S&P 500 |
(Source: Dividend Kings Zen Research Terminal)
HASI is 17% historically undervalued, and analysts think it could deliver 16% to 20% annual returns over the next five years. Moreover, they (and management) think HASI could deliver 15% to 16% long-term returns for many years or even decades.
Hannon Armstrong 2024 Consensus Total Return Potential
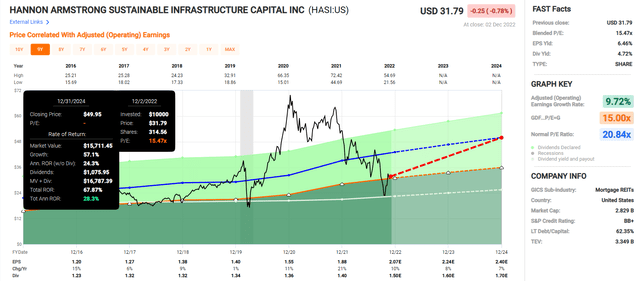
FAST Graphs, FactSet
If HASI grows as expected and returns to historical market-determined fair value by 2024, it could deliver 68% returns or 28% per year.
-
about 2.5X more than the S&P 500
Hannon Armstrong 2028 Consensus Total Return Potential
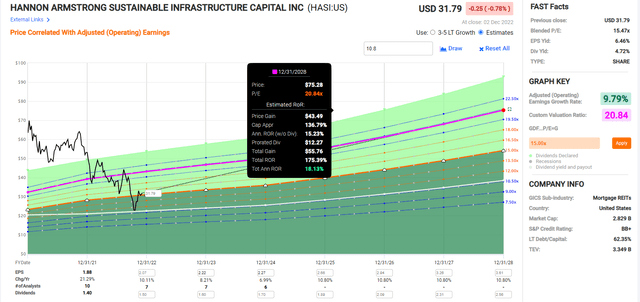
FAST Graphs, FactSet
If HASI grows as expected and returns to historical fair value by 2028, it could nearly triple, delivering Buffett-like 18% annual returns.
HASI Automated Investment Decision Score
DK
Dividend Kings Automated Investment Decision Tool
HASI is a potentially good high-yield speculative green energy blue-chip opportunity for anyone comfortable with its risk profile. Look at how it compares to the S&P 500.
-
16% discount to fair value vs. 5% premium S&P = 21% better valuation
-
4.7% safe yield vs. 1.7% (3X higher and safer)
-
approximately 16% long-term annual return potential vs. 10.2% CAGR S&P
-
about 2X higher risk-adjusted expected returns
-
3X higher income potential over five years
Reason Two: A $700 Billion To $120 Trillion Growth Runway Could Mean Buffett-Like Returns For Decades To Comes
Based on its 60% bear market, you might think HASI’s growth outlook has collapsed, but that’s not true.
|
Metric |
2021 Growth Consensus |
2022 Growth Consensus |
2023 Growth Consensus |
2024 Growth Consensus |
2025 Growth Consensus |
2026 Growth Consensus |
|
Sales |
-3% |
46% |
16% |
27% |
NA |
NA |
|
Dividend |
3% |
8% (Official) |
7% |
7% |
6% |
6% |
|
EPS |
21% |
10% |
8% |
7% |
NA |
NA |
|
Book Value |
11% |
5% |
8% |
9% |
NA |
NA |
(Source: FAST Graphs, FactSet)
HASI is expected to grow like a weed through 2024, and its dividend is expected to grow 6.3% annually through 2026.
Long-Term Growth Outlook
Management guidance is for 10% to 13% long-term growth, and analysts expect 10.8%.
Smoothing for outliers, analyst margins-of-error is 15% to the downside and 10% to the upside.
-
9% to 15% margin-of-error adjusted guidance/growth consensus range
HASI’s historical growth rate is 9% to 21% annually, and given the $700 billion growth opportunity it has in North American green energy infrastructure alone, management’s 10% to 13% guidance appears reasonable.
HASI Consensus Return Potential (Ignoring Valuation)
|
Investment Strategy |
Yield |
LT Consensus Growth |
LT Consensus Total Return Potential |
Long-Term Risk-Adjusted Expected Return |
Long-Term Inflation And Risk-Adjusted Expected Returns |
Years To Double Your Inflation & Risk-Adjusted Wealth |
10-Year Inflation And Risk-Adjusted Expected Return |
|
Hannon Armstrong |
4.7% |
10.8% |
15.5% |
10.9% |
8.5% |
8.5 |
2.27 |
|
REITs |
3.9% |
6.1% |
10.0% |
7.0% |
4.7% |
15.4 |
1.58 |
|
Schwab US Dividend Equity ETF |
3.5% |
8.5% |
12.0% |
8.4% |
6.0% |
11.9 |
1.80 |
|
Dividend Aristocrats |
2.6% |
8.5% |
11.1% |
7.8% |
5.4% |
13.2 |
1.70 |
|
S&P 500 |
1.7% |
8.5% |
10.2% |
7.1% |
4.8% |
15.0 |
1.60 |
|
Nasdaq |
0.8% |
11.8% |
12.6% |
8.8% |
6.5% |
11.0 |
1.88 |
(Sources: DK Research Terminal, FactSet, Morningstar, Ycharts)
HASI offers superior yield and total return potential to almost every popular investment strategy.
-
more than the S&P 500, aristocrats, REITs, SCHD, and even the Nasdaq
Inflation-Adjusted Consensus Total Return Potential: $1,000 Initial Investment
|
Time Frame (Years) |
8.0% CAGR Inflation-Adjusted S&P 500 Consensus |
8.8% Inflation-Adjusted Aristocrat Consensus |
13.2% CAGR Inflation-Adjusted HASI Consensus |
Difference Between Inflation-Adjusted HASI Consensus And S&P Consensus |
|
5 |
$1,468.65 |
$1,526.66 |
$1,856.34 |
$387.69 |
|
10 |
$2,156.93 |
$2,330.70 |
$3,445.98 |
$1,289.06 |
|
15 |
$3,167.77 |
$3,558.19 |
$6,396.90 |
$3,229.14 |
|
20 |
$4,652.33 |
$5,432.16 |
$11,874.80 |
$7,222.47 |
|
25 |
$6,832.64 |
$8,293.08 |
$22,043.62 |
$15,210.98 |
|
30 (retirement time frame) |
$10,034.74 |
$12,660.73 |
$40,920.36 |
$30,885.62 |
|
35 |
$14,737.50 |
$19,328.67 |
$75,961.94 |
$61,224.44 |
|
40 |
$21,644.21 |
$29,508.37 |
$141,010.88 |
$119,366.68 |
|
45 |
$31,787.72 |
$45,049.33 |
$261,763.58 |
$229,975.86 |
|
50 |
$46,684.97 |
$68,775.14 |
$485,921.14 |
$439,236.17 |
|
55 |
$68,563.78 |
$104,996.45 |
$902,032.89 |
$833,469.11 |
|
60 (investing lifetime) |
$100,696.06 |
$160,294.18 |
$1,674,476.10 |
$1,573,780.04 |
|
100 (charitable trust, institutional time frame) |
$2,179,486.17 |
$4,730,019.35 |
$236,119,355.30 |
$233,939,869.13 |
(Source: DK Research Terminal, FactSet)
Analysts and management expect HASI to deliver over 13% inflation-adjusted long-term returns, which is a potential 40X real return over the next three decades.
|
Time Frame (Years) |
Ratio Inflation-Adjusted HASI Consensus/Aristocrat Consensus |
Ratio Inflation-Adjusted HASI Consensus vs. S&P consensus |
|
5 |
1.22 |
1.26 |
|
10 |
1.48 |
1.60 |
|
15 |
1.80 |
2.02 |
|
20 |
2.19 |
2.55 |
|
25 |
2.66 |
3.23 |
|
30 |
3.23 |
4.08 |
|
35 |
3.93 |
5.15 |
|
40 |
4.78 |
6.51 |
|
45 |
5.81 |
8.23 |
|
50 |
7.07 |
10.41 |
|
55 |
8.59 |
13.16 |
|
60 |
10.45 |
16.63 |
|
100 |
49.92 |
108.34 |
(Source: DK Research Terminal, FactSet)
That’s 3X more than the dividend aristocrats and 4X more than the S&P 500 over the next 30 years.
Reason Three: A Wonderful Company At An Attractive Price
For nine years, millions of income investors have consistently paid 20X to 22X earnings for HASI outside of bubbles and bear markets.
-
An 83% statistical probability that HASI is worth 20X to 22X earnings
To be conservative, we also include the five-year average yield fair value.
-
any stock that grows the dividend slower than earnings will have a conservative yield fair value estimate
|
Metric |
Historical Fair Value Multiples (all Years) |
2021 |
2022 |
2023 |
2024 |
12-Month Forward Fair Value |
12-Month Forward Fair Value |
|
5-Year Average Yield |
4.54% |
$30.84 |
$33.04 |
$33.04 |
$38.11 |
$40.31 |
|
|
PE |
20.84 |
$39.18 |
$41.89 |
$46.26 |
$50.02 |
$53.35 |
|
|
Average |
$34.51 |
$36.94 |
$38.55 |
$43.26 |
$45.92 |
$38.49 |
|
|
Current Price |
$31.79 |
||||||
|
Discount To Fair Value |
7.88% |
13.95% |
17.53% |
26.51% |
30.77% |
17.40% |
|
|
Upside To Fair Value (including dividend) |
8.56% |
16.20% |
21.26% |
36.07% |
44.45% |
25.79% |
|
|
2022 EPS |
2023 EPS |
2022 Weighted EPS |
2023 Weighted EPS |
12-Month Forward EPS |
Historical Average Fair Value Forward PE |
Current Forward PE |
|
|
$2.01 |
$2.22 |
$0.08 |
$2.13 |
$2.21 |
17.4 |
14.4 |
HASI is conservatively worth 17.4X earnings and today trades at 14.4X.
|
Rating |
Margin Of Safety For Low Risk 11/13 Speculative Blue-Chip Quality Companies |
2022 Fair Value Price |
2023 Fair Value Price |
12-Month Forward Fair Value |
|
Potentially Reasonable Buy |
0% |
$36.94 |
$38.55 |
$38.49 |
|
Potentially Good Buy |
20% |
$29.55 |
$30.84 |
$30.79 |
|
Potentially Strong Buy |
30% |
$25.86 |
$26.98 |
$26.94 |
|
Potentially Very Strong Buy |
40% |
$17.73 |
$23.13 |
$23.09 |
|
Potentially Ultra-Value Buy |
50% |
$18.47 |
$19.27 |
$19.24 |
|
Currently |
$31.79 |
13.95% |
17.53% |
17.40% |
|
Upside To Fair Value (Including Dividends) |
20.92% |
25.98% |
25.79% |
Once HASI gets upgraded to investment grade, it will become a SWAN quality BDC, and then the margin of safety required for each valuation rating will decline by 5% from what you see above.
-
rating agencies don’t expect that to happen until four-plus years
So, for now, HASI remains a potentially reasonable buy for anyone comfortable with the risk profile.
Risk Profile: Why Hannon Armstrong Isn’t Right For Everyone
There are no risk-free companies, and no company is right for everyone. You have to be comfortable with the fundamental risk profile.
-
normal for BDCs and most companies
HASI’s Risk Profile Includes
-
regulatory risk (specifically tax policy, which represents 1/7th of its funding sources through tax equity investments)
-
relative energy price risk with traditional energy sources (if gas prices collapse, green energy becomes relatively less attractive)
-
funding risk: local/state/federal government demand drives a lot of demand/contracts for its projects (if government funding dries up, growth will slow)
-
competition risk: HASI competes with giants (like BAM, big banks, and insurance companies)
-
interest rate risk: affects the cost of capital (especially while it’s still BB+ rated)
-
credit market risk: in severe recession, yield spreads on junk bonds soar (Pandemic and Great Recession)
-
credit risk: most of its projects aren’t rated by agencies (though less than 0.2% portfolio losses since 2012 indicate strong underwriting)
-
stock price risk: HASI funds some of its growth through equity issuances (like REITs and BDCs do), and if the share price collapses, its cost of equity will increase
-
project execution risk: HASI is a minority investor in its projects and thus doesn’t control them (it relies on its investing partners to manage the green energy assets)
-
counter-party risk: HASI’s investment income is based on long-term contracts; if its counter-parties fail its investment income will take a hit (thus why it invests in over 365 projects)
-
cyber-security risk: hackers and ransomware
-
M&A risk: HASI is considering needle-moving acquisitions, and there is no guarantee these will work out well
HASI put its sky-high valuation to good use with equity issuances in 2020 and is not at all capital constrained for now.
However, if the overall bear market drags on longer than expected and its stock price remains suppressed, that could result in slower growth than management is currently guiding for.
How do we quantify, monitor, and track such a complex risk profile? By doing what big institutions do.
Long-Term Risk Management Analysis: How Large Institutions Measure Total Risk Management
See the risk section of this video to get an in-depth view (and link to two reports) of how DK and big institutions measure long-term risk management by companies
DK uses S&P Global’s global long-term risk-management ratings for our risk rating.
-
S&P has spent over 20 years perfecting their risk model
-
which is based on over 30 major risk categories, over 130 subcategories, and 1,000 individual metrics
-
50% of metrics are industry specific
-
this risk rating has been included in every credit rating for decades
The DK risk rating is based on the global percentile of how a company’s risk management compares to 8,000 S&P-rated companies covering 90% of the world’s market cap.
HASI scores 84th Percentile On Global Long-Term Risk Management
S&P’s risk management scores factor in things like:
-
supply chain management
-
crisis management
-
cyber-security
-
privacy protection
-
efficiency
-
R&D efficiency
-
innovation management
-
labor relations
-
talent retention
-
worker training/skills improvement
-
occupational health & safety
-
customer relationship management
-
business ethics
-
climate strategy adaptation
-
sustainable agricultural practices
-
corporate governance
-
brand management
HASI’s Long-Term Risk Management Is The 117th Best In The Master List (77th Percentile In The Master List)
|
Classification |
S&P LT Risk-Management Global Percentile |
Risk-Management Interpretation |
Risk-Management Rating |
|
BTI, ILMN, SIEGY, SPGI, WM, CI, CSCO, WMB, SAP, CL |
100 |
Exceptional (Top 80 companies in the world) |
Very Low Risk |
|
Strong ESG Stocks |
86 |
Very Good |
Very Low Risk |
|
Hannon Armstrong |
84 |
Very Good |
Low Risk (Very Low Risk Once It Becomes Investment Grade) |
|
Foreign Dividend Stocks |
77 |
Good, Bordering On Very Good |
Low Risk |
|
Ultra SWANs |
74 |
Good |
Low Risk |
|
Dividend Aristocrats |
67 |
Above-Average (Bordering On Good) |
Low Risk |
|
Low Volatility Stocks |
65 |
Above-Average |
Low Risk |
|
Master List average |
61 |
Above-Average |
Low Risk |
|
Dividend Kings |
60 |
Above-Average |
Low Risk |
|
Hyper-Growth stocks |
59 |
Average, Bordering On Above-Average |
Medium Risk |
|
Dividend Champions |
55 |
Average |
Medium Risk |
|
Monthly Dividend Stocks |
41 |
Average |
Medium Risk |
(Source: DK Research Terminal)
HASI’s risk-management consensus is in the top 23% of the world’s best blue chips, and similar to:
-
Lowe’s (LOW): Ultra SWAN dividend king
-
3M (MMM): Ultra SWAN dividend king
-
W.W. Grainger (GWW): Ultra SWAN dividend king
-
Canadian Imperial Bank of Commerce (CM): Ultra SWAN
-
BlackRock (BLK): Ultra SWAN
The bottom line is that all companies have risks, and HASI is very good at managing theirs, according to S&P.
How We Monitor HASI’s Risk Profile
-
10 analysts
-
three credit rating agencies
-
13 experts who collectively know this business better than anyone other than management
“When the facts change, I change my mind. What do you do, sir?” – John Maynard Keynes
There are no sacred cows at iREIT or Dividend Kings. Wherever the fundamentals lead, we always follow. That’s the essence of disciplined financial science, the math behind retiring rich and staying rich in retirement.
Bottom Line: Hannon Armstrong Offers A 5% Yield And A $120 Trillion Growth Market
How impressive is HASI?
HASI Is Being Added To The Dividend Kings ZEUS Income Growth Portfolio
|
Stock |
Yield |
Growth |
Total Return |
Weighting |
Weighted Yield |
Weighted Growth |
Weighted Return |
|
QQQM |
0.7% |
11.9% |
12.6% |
16.67% |
0.1% |
2.0% |
2.09% |
|
SCHD |
3.5% |
7.6% |
11.1% |
16.67% |
0.6% |
1.3% |
1.85% |
|
EDV |
4.1% |
0% |
4.1% |
16.67% |
0.7% |
0.0% |
0.68% |
|
DBMF |
9.5% |
0% |
9.5% |
16.67% |
1.6% |
0.0% |
1.58% |
|
AMZN |
0.0% |
19.2% |
19.2% |
5.56% |
0.0% |
1.1% |
1.07% |
|
LOW |
2.0% |
20.6% |
22.6% |
5.56% |
0.1% |
1.1% |
1.26% |
|
MA |
0.6% |
23.2% |
23.8% |
5.56% |
0.0% |
1.3% |
1.32% |
|
BTI |
6.5% |
10.4% |
17.4% |
4.72% |
0.3% |
0.5% |
0.82% |
|
ENB |
6.1% |
5.1% |
11.2% |
4.72% |
0.3% |
0.2% |
0.53% |
|
MO |
8.4% |
5.0% |
13.4% |
4.72% |
0.4% |
0.2% |
0.63% |
|
HASI |
4.7% |
10.8% |
15.50% |
2.50% |
0.1% |
0.3% |
0.39% |
|
Total |
4.2% |
10.3% |
14.5% |
100.00% |
4.2% |
8.0% |
12.2% |
(Source: DK Research Terminal, FactSet)
In 3 weeks, when we rebalance the DK ZEUS Income Growth Portfolio, we’ll add a 2.5% allocation for HASI to the ZIG portfolio.
-
my uncle is also adding it to his ZEUS Income Growth portfolio
-
using his daily DCA budget to buy 100 shares until December 26th (the last day to get the next dividend)
-
a full allocation
-
I’m buying 100 shares as a starter position
-
I’m going to eventually rebalance my retirement portfolio to ZEUS Income Growth in about one year or so
-
when its income matches my current portfolio’s income
-
since I’m using the dividends to pay medical bills, I can’t afford to do it right away
When HASI gets upgraded to investment-grade (all the rating agencies say it will eventually), then it’s max risk cap will rise to 10%.
-
it will become an 11/13 SWAN quality BDC
-
very low risk
-
4.2% target allocation in ZEUS Income Growth (MO, BTI, and ENB also 4.2%)
Let me be clear: I’m NOT calling the bottom in HASI (I’m not a market-timer).
Future SWAN quality (once it’s investment-grade) does NOT mean “can’t fall hard and fast” in a bear market.
Fundamentals are all that determine safety and quality, and my recommendations.
-
over 30+ years, 97% of stock returns are a function of pure fundamentals, not luck
-
in the short term, luck is 25X as powerful as fundamentals
-
in the long term, fundamentals are 33X as powerful as luck
While I can’t predict the market in the short term, here’s what I can tell you about HASI:
-
One of the highest quality and safest BDCs on earth
-
safe 4.7% yield (3X the S&P yield and safer, growing 6.3% per year)
-
15% to 18% CAGR long-term total consensus/management guidance, better than the S&P, aristocrats, and the Nasdaq
-
17% historically undervalued, a potentially reasonable buy
-
14.4X earnings = compared to historical 20 to 22X.
-
180% consensus return potential over the next six years, 18% CAGR, 4X better than the S&P 500
-
2X the risk-adjusted expected returns of the S&P 500 over the next five years
-
3X the income potential of the S&P over the next five years
If you’re looking for a generous, safe, and rapidly growing yield, consider HASI today.
If you’re looking to cash in on the $120 trillion global green energy gold rush, HASI is one of my favorite ways to do that.
Yes, there are plenty of options in green energy. Still, few offer HASI’s incredible combination of 5% yield, double-digit growth potential that could last for decades, and superb long-term risk management.
That’s courtesy of an exceptional management team who is so good at project underwriting that its cumulative losses over a decade are less than 0.2%!
Hannon’s management are masters of green energy investing, and if you buy these shares, you can rest easy knowing your hard-earned savings are in good hands.
So take advantage of this incredible bear market buying opportunity to buy an industry leader before it becomes a household name.
Based on HASI’s fundamentals today, I can say with 80% confidence that if you buy it today, you’ll be glad you did in the next 5+ years. And in 10+ years? You’ll likely feel like a stock market genius.
Author’s note: Brad Thomas is a Wall Street writer, which means he’s not always right with his predictions or recommendations. Since that also applies to his grammar, please excuse any typos you may find. Also, this article is free: Written and distributed only to assist in research while providing a forum for second-level thinking.
Be the first to comment