


da-kuk
(This article was co-produced with Hoya Capital Real Estate)
Introduction
All three Exchange-Trade-Funds are widely followed, reviewed and compared by numerous Seeking Alpha Contributors, including past articles by myself (links provided at the end of this article). ETFs like the SPDR S&P 500 ETF (SPY) form the bedrock for many investors. Since SPY does not generate much cashflow to pay bills or cover possible RMDs, ETFs like those covered here, along with the likes of Amplify CWP Enhanced Dividend Income ETF (DIVO) get added to these investor’s allocation mix to add income; hopefully without much sacrifice to the portfolio’s overall return.
Three popular choices for the dual goal (more income, little CAGR loss) include the three listed in the summary points, the first two being this article’s focus:
- JPMorgan Equity Premium Income ETF (NYSEARCA:JEPI)
- S&P 500 Covered Call & Growth ETF (NYSEARCA:XYLG)
- Global X S&P 500 Covered Call ETF (XYLD)
For risk and return data, I will be using the JPMorgan Equity Premium Income Fund Class I Inst (JEPIX) as it has twice the history compared to JEPI. They both invest the same and show similar results since JEPI started in 2020.
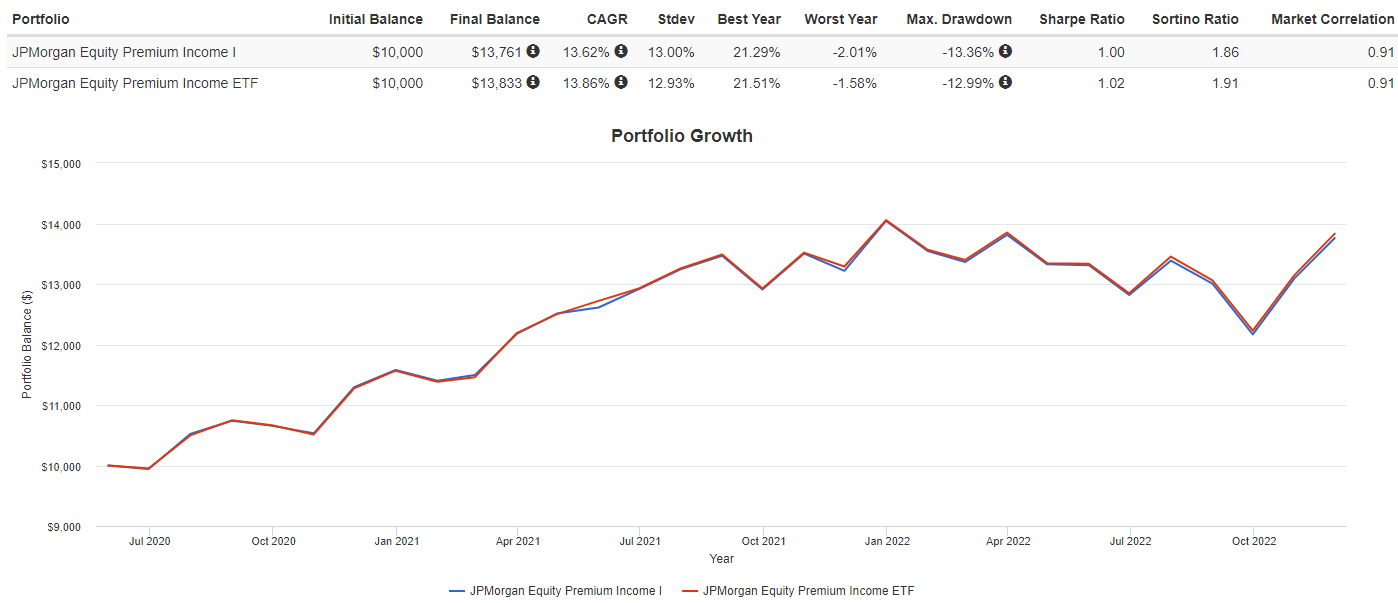
PortfolioVisualizer.com
JPMorgan Equity Premium Income ETF review
Seeking Alpha describes this ETF as:
The fund seeks to achieve this objective by (1) creating an actively managed portfolio of equity securities comprised significantly of those included in the fund’s primary benchmark, the Standard & Poor’s 500 Total Return Index (S&P 500 Index) and (2) through equity-linked notes (ELNs), selling call options with exposure to the S&P 500 Index. Benchmark: S&P 500 TR USD. JEPI started in May, 2020.
Source: seekingalpha.com JEPI
JEPI has $14.4b in AUM and provides investors with a 12-month yield over 11%. Fees are 35bps. The manger adds this flavor to the above description:
JPMorgan Equity Premium Income ETF seeks to deliver monthly distributable income and equity market exposure with less volatility.
EXPERTISE
- Portfolio managers with over 60 years of combined experience investing in equities and equity derivatives.
PORTFOLIO
- Defensive equity portfolio employs a time-tested, bottom-up fundamental research process with stock selection based on our proprietary risk-adjusted stock rankings.
- Disciplined options overlay implements written out-of-the-money S&P 500 Index call options to generate distributable monthly income.
Source: am.jpmorgan.com JEPI
To illustrate the income enhancement JEPI offers, they posted this chart:
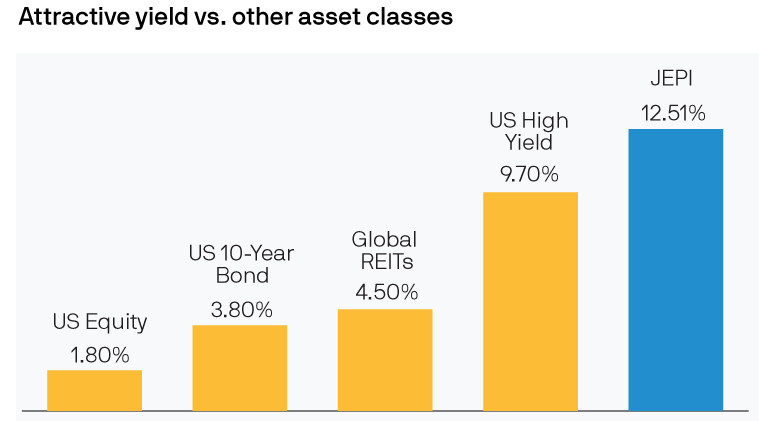
am.jpmorgan.com JEPI yield
Holdings review
The unique holdings feature of JEPI is its use of Equity-Linked-Notes (ELN) to enhance the income provided to investors, versus Covered Calls used by the other ETFs mentioned here. I pulled the following important points explaining ELNs from Investopedia.
- An equity-linked note (ELN) is an investment product that combines a fixed-income investment with additional potential returns that are tied to the performance of equities. Equity-linked notes are usually structured to return the initial investment with a variable interest portion that depends on the performance of the linked equity.
- Equity-linked notes provide a way for investors to protect their capital while also getting the potential for an above-average return compared to regular bonds. In theory, the upside potential for returns in an equity-linked note is unlimited, whereas the downside risk is capped. Even in the worst-case scenario, most equity-linked notes offer full principal protection.
- In their simplest form, a $1,000 5-year equity-linked note could be structured to use $800 of the fund to buy a 5-year strip bond with a 4.5% yield-to-maturity and then invest and reinvest the other $200 in call options for the S&P 500 over the 5-year life of the note. There is a chance that the options will expire worthless, in which case the investor gets back the $1,000 initially put in. If, however, the options appreciate in value with the S&P 500, those returns are added to the $1,000 that will eventually be returned to the investor.
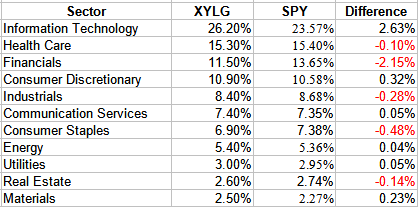
Since some investors might replace SPY with this ETF, here are how the sectors vary between the two, as this can affect performance.
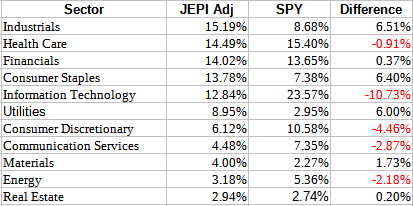
Multiple sites; compiled by Author
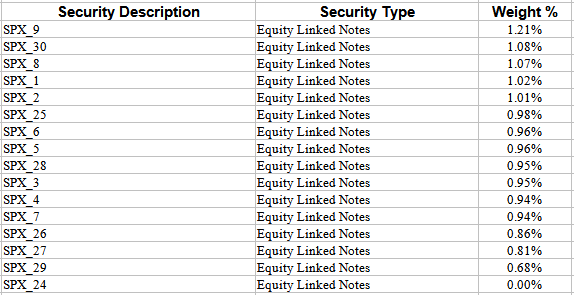
To be comparable, JEPI’s weights were adjusted to remove the ELN and other asset weights. The largest ten stock positions are:
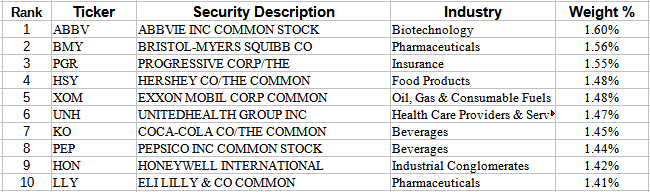
jpmorgan.com; compiled by Author
With 108 stocks or REITs, these account for just under 15% of the portfolio. To diversify any Issuer default risk, JEPI holds 16 ELNs. These comprise just over 14% of the portfolio.
jpmorgan.com; compiled by Author
While I could not get whom the current Issuers are, the following were those in use at the end of the 3rd quarter.
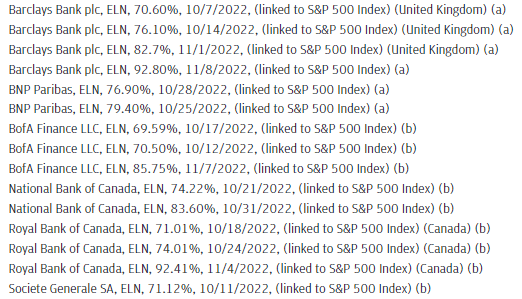
am.jpmorgan.com JEPI 3Q report
Besides cash, JEPI is long 800 contracts of the S&P 500 Emini futures that expire in mid-December.
Distribution review
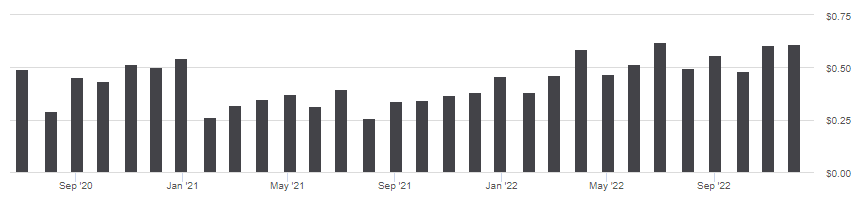
seekingalpha.com JEPI DVDs
Payouts have shown a steady increase since 2020. Higher interest rates and more volatility help in that regard. I found nothing that would indicate the payouts are not taxed as ordinary income. Seeking Alpha gives JEPI an “A+” dividend grade.
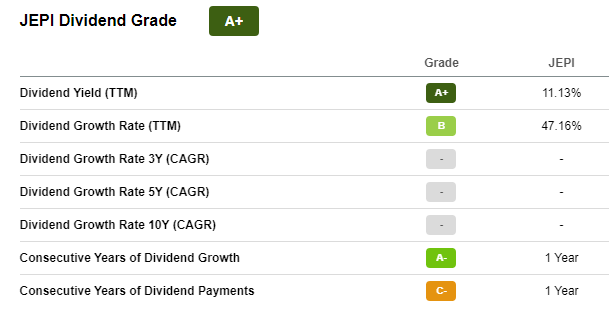
seekingalpha.com JEPI scorecard
S&P 500 Covered Call & Growth ETF review
Seeking Alpha describes this ETF as:
The fund invests in growth and value stocks of large-cap companies. The fund seeks to track the performance of the Cboe S&P 500 Half BuyWrite Index.
Source: seekingalpha.com XYLG
XYLG is small with only $41.5m in AUM. The option strategy is generating a 9.9% yield. The managers are charging 60bps in fees. The managers list three reasons to own XYLG:
High Income Potential
XYLG seeks to generate income by writing covered calls on the underlying index.
Upside Potential
By writing calls on 50% of the portfolio, the strategy allows investors to capture half the upside potential of the underlying index.
Monthly Distributions
XYLG makes distributions on a monthly basis.
Source: globalxetfs.com XYLG
Holdings review
multiple pages; compiled by Author
Since XYLG owns every stock in the S&P 500 Index, on which SPY is based, I have to assume the weighting differences are purely due to the XYLG data being a month old. The Top 10 stocks are:
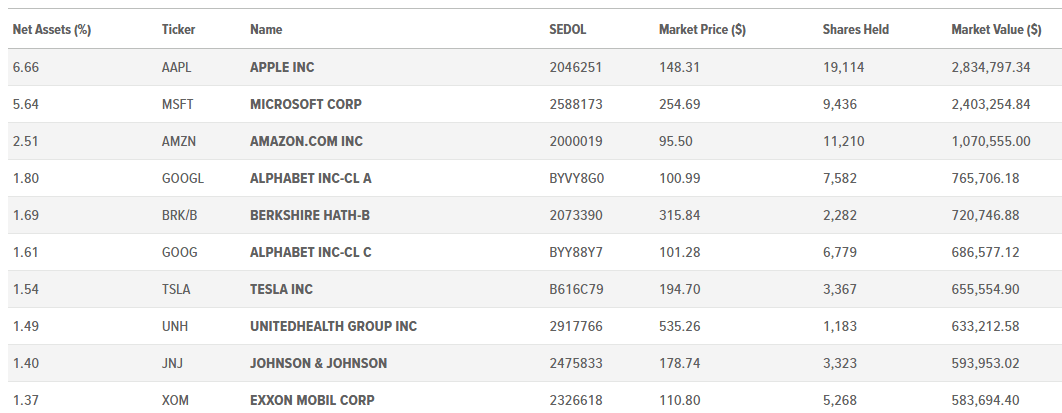
globalxetfs.com XYLG holdings
XYLG generates it income by writing Calls against the S&P 500 Index, using both the Mini contract (XSP) and the full contract (SPX).
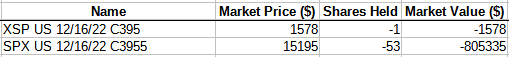
globalxetfs.com XYLG holdings
This should cover 50% of the value of the equities held. As of today, the underlying Index is at 4062, so the options are about 3% OTM.
Distribution review
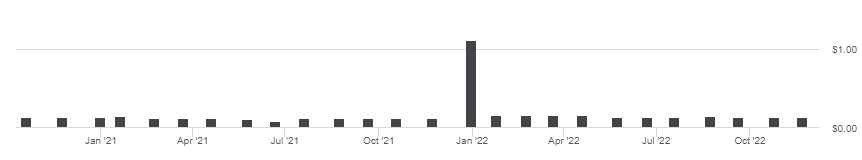
seekingalpha.com XYLG DVDs
Ignoring the big payout, the monthly ones have been running between $.10 and $.15. Ignoring that payout means XYLG yields below 7%; still much higher than SPY. How payouts are taxed from option writing ETFs is sometimes complicated, as the following from Global X indicates:
Due to their investments in both equities and options contracts, Global X’s covered call ETFs elect to use a ‘mixed straddle’ approach for taxation purposes. With a mixed straddle approach, options contracts are treated as a §1256 contract and stocks are treated as a non-§1256 security. This is an important distinction in calculating the required distributions from the fund at year-end, and how those distributions are characterized (e.g. long term or short term capital gains). For more detailed information on the mixed straddle election, please see Form 6781 from the Internal Revenue Service (IRS). Please note that while the Funds elect to use the mixed straddle approach to calculate distributions and determine how they are characterized, the end investor ultimately receives a Form 1099, as is common among ETF investments. The options bucket’s total gains (losses) are treated as a blended 60% long term and 40% short term capital gains (losses).
Source: globalxetfs.com Tax primer PDF
XYLG also issues a 19-a, which indicates the potential sources of the payouts. The current estimate is almost 77% will be classified as ROC in 2022.
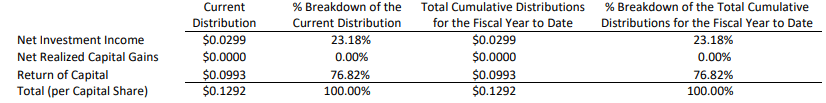
globalxetfs.com XYLG 19-a
Seeking Alpha also rates this ETF as an “A+” fund.
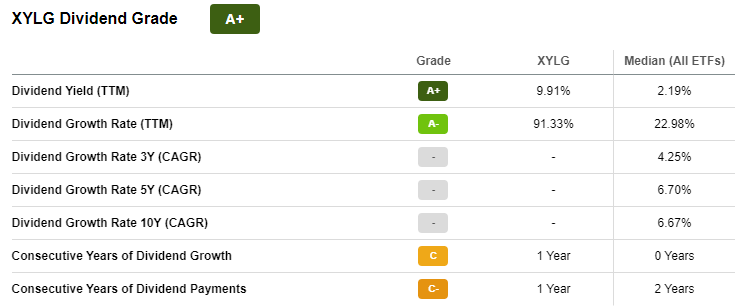
seekingalpha.com XYLG scorecard
Portfolio strategy
Besides income, a second reason to own funds like those reviewed versus SPY is portfolio volatility reduction. The next chart compares JEPI to the S&P 500 Index.
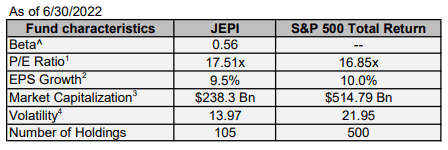
am.jpmorgan.com
Without giving up much in terms of EPS growth or having a higher PE ratio, JEPI’s data shows how much less risk it has versus the Index. XYLG provides two measures: Beta (.81) and StdDev (15.9%).
I Added Global X S&P 500 Covered Call ETF (XYLD) to the mix as mentioned above. XYLD invests like XYLG except (a big one) that it writes options against 100% of its portfolio. While that gives it the best yield, it also has the lowest CAGR.
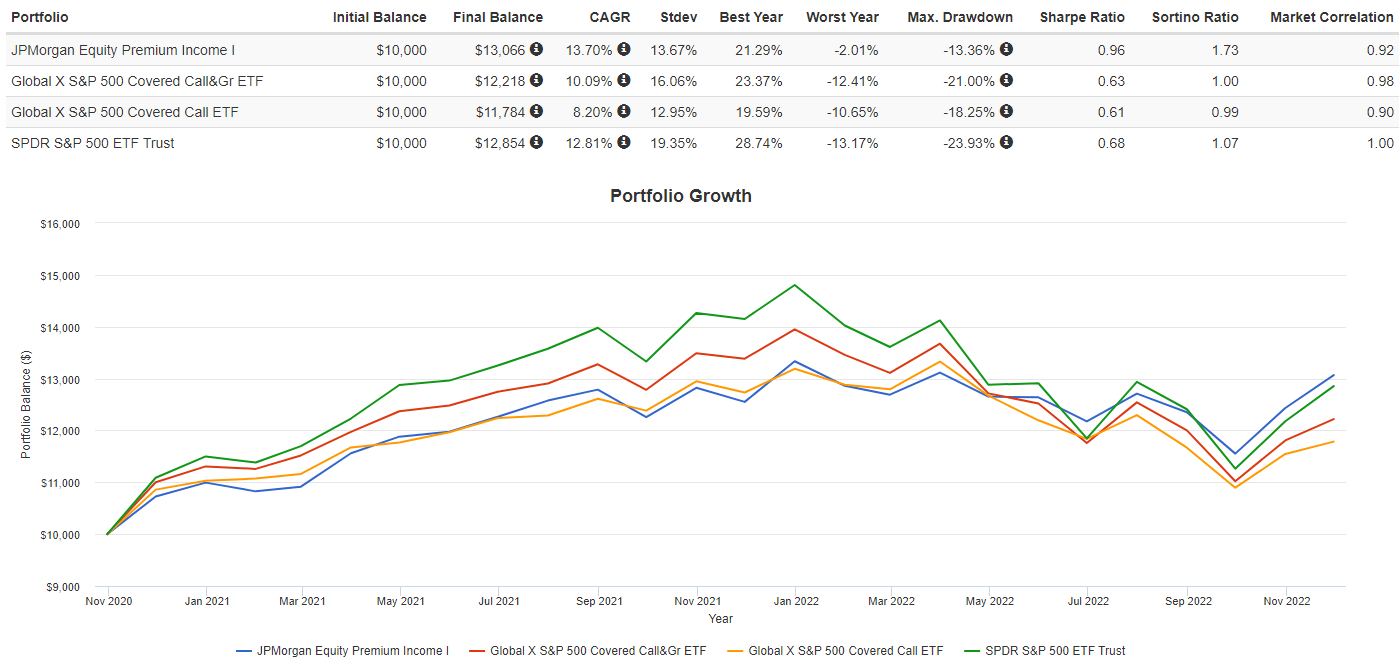
PortfolioVisualizer.com
With JEPIX, representing JEPI at the top over the last two years, I removed the other two ETFs to see if that is true back to 2018. The answer is no; eliminating the first part of the post-COVID recovery changed that.
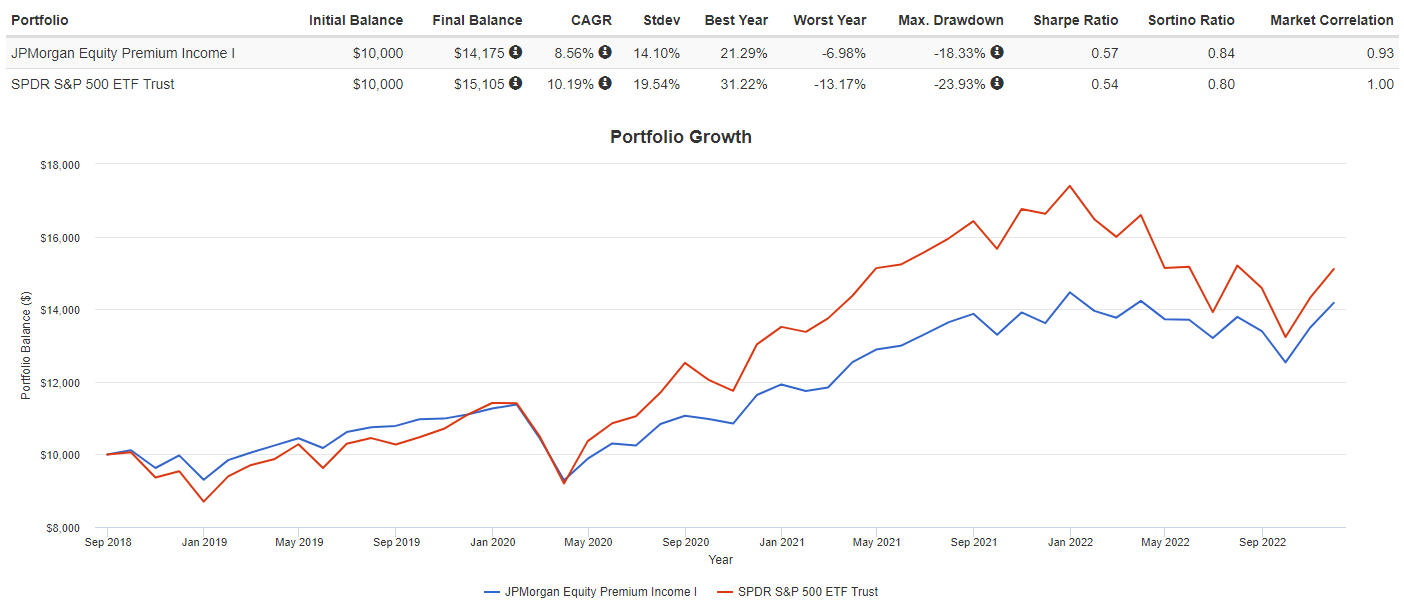
PortfolioVisualizer.com
Final thoughts
I made my choice: JEPI, which I hold for conservative equity exposure in my Health Reimbursement Account, with plan on adding to one of our IRAs.
Investors are naturally left with a choice: income or return and how much to sacrifice one for the other. The answer depends on their needs, risk tolerance, and the rest of their asset allocation. The limited history of all three ETFs does not provide much experience to how each ETF will react to market conditions going forward and we are definitely in uncertain times!
Last spring, I compared JEPI versus SPY for those interested: JEPI Vs. SPY: More Differences Than Just Yield And CAGR
Be the first to comment