


Sundry Photography/iStock Editorial via Getty Images
This article was first published for Dividend Growth Income+ Club members on April 6, 2022.
Investment Thesis
Back on August 6, 2020, with the Guidewire Software, Inc. (NYSE:GWRE) share price at $119.07, I published an article, “Guidewire Software: ‘Leaky Equity Bucket’, Time To Abandon Ship.” From that article,
Simply put, Guidewire Software (GWRE) shares are way overpriced at present. When shareholders begin to understand the company’s growth is due to raising capital through share issues, and not through generation and accumulation of earnings, there could be a rush for the exits. This makes for a shorting opportunity, based purely on an unjustifiably high share price.
One year later, on Aug. 17, 2021, with the share price down to $110.01, I decided to take another look, and published article, “Guidewire Software: No Fix To The ‘Leaky Equity Bucket'”. Per the article I found,
…apart from a 6% decrease in the share price, and commencement of share repurchases, it’s just more of the same. The company continues to report earnings excluding stock compensation. Reported non-GAAP earnings for the nine months ended April 2021 were $8 million, but after taking into account stock compensation the GAAP result was a $66 million loss. This approach has allowed reporting of $394 million in adjusted non-GAAP earnings for the 4.5 years to end of April 2021. But the unadjusted GAAP results over the same period total to a loss of $475 million. Even with this artificial inflation of earnings, P/E multiple on a TTM April 30, 2021, non-GAAP EPS basis is currently 117.42, at current share price. Share repurchases were initiated in the current fiscal year, with 1.12 million shares repurchased for $123.8 million. At the same time, an additional 0.94 million shares were issued to staff with $89 million charged against GAAP equity, but excluded from non-GAAP earnings calculation, as discussed above. Furthermore, the $89 million charge was less than the estimated $110 million market value of these shares based on the cost of share repurchases. Guidewire Software is a classic case of “leaky equity bucket” syndrome. The company is not presently profitable, in real terms, and appears to lack any potential to become sufficiently profitable to justify the current share price, let alone a higher share price. While I’m very bearish on this stock, its ongoing effective capital raising is maintaining liquidity, and this situation could continue for a lengthy period ahead.
Around eight months on, and with the share price down by a further $16.15 to $93.86 at close on Apr. 5, 2022, I decided to take a further look, to see what, if anything, had changed with Guidewire Software. Below are my present conclusions.
Updated Investment Thesis –
Based on analysts’ estimates of future earnings, the stock remains very much overpriced at present, despite the significant falls in the share price. Earnings have been materially overstated over the last 4.5 years due to excluding the cost of share issues to staff. These are not one-off costs – they’re a continuing expense. I can only assume analysts’ non-GAAP EPS estimates similarly exclude these very real costs, thus the forward EPS estimates are likely significantly overstated and the P/E ratios, as high as they already are, are significantly understated. I remain sufficiently bearish on this company to believe it could be attractive to those interested in shorting. Notwithstanding those negative comments, with the large amounts of capital raised over the last 4.5 years, the company has no net debt and is sound from a liquidity aspect. The company may continue to record GAAP losses, but by in effect issuing shares to raise capital to compensate staff, the liquidity position will likely remain sound. That’s not a good basis for investment in the shares of a company that pays no dividend and requires ongoing share issues to survive and maintain liquidity.
My detailed structured financial analysis appears below.
The Dividend Growth Income+ Club Approach
The logo of the DGI+ Club explained:
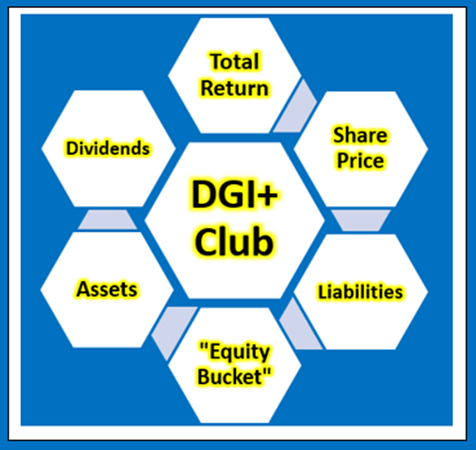
Copyright: Robert Honeywill 2021
Total Return, Dividends, Share Price
The only way an investor can achieve a positive return on an investment in shares is through receipt of dividends and/or an increase in the share price above the buy price – the only way. It follows what really matters in share value assessment is the expected price at which a buyer will be able to exit shares, and expected cash flow from dividends.
Changes In Share Price
Changes in share price are driven by increases or decreases in EPS and changes in P/E ratio. Changes in P/E ratio are driven by investor sentiment toward the stock. Investor sentiment can be influenced by many factors, not necessarily stock specific.
“Equity Bucket”
Earnings are tipped into the “Equity Bucket” for the benefit of shareholders. It’s prudent to check whether distributions out of and other reductions in the “Equity Bucket” balance are benefiting shareholders.
Below, I address:
- Historical Shareholder Returns
- Checking the Guidewire Software “Equity Bucket”
Guidewire Software: Assessing Historical Shareholder Returns
Tables 1.1 and 1.2 below show details of actual rates of return, current and 12 months ago, for Guidewire Software shareholders investing in the company over the last four to six years.
Table 1.1 – Guidewire Software: Historical Shareholder Returns At August 5, 2020
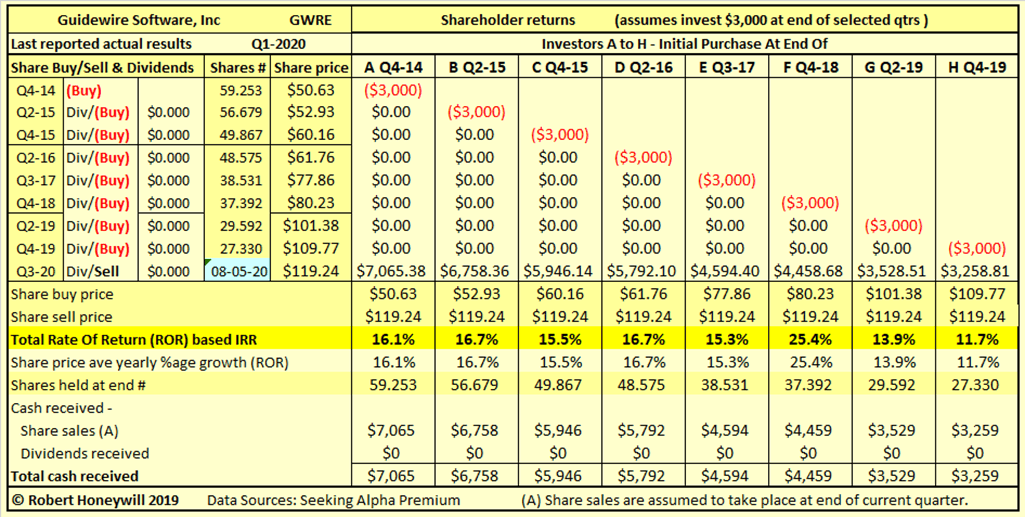
Sources: Seeking Alpha Premium
Table 1.2 – Guidewire Software: Historical Shareholder Returns At August 12, 2021
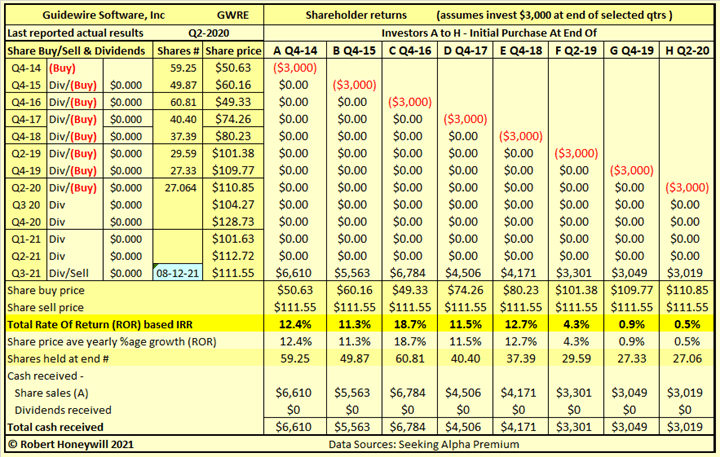
Sources: Seeking Alpha Premium
Table 1.3 – Guidewire Software: Historical Shareholder Returns At April 5, 2022
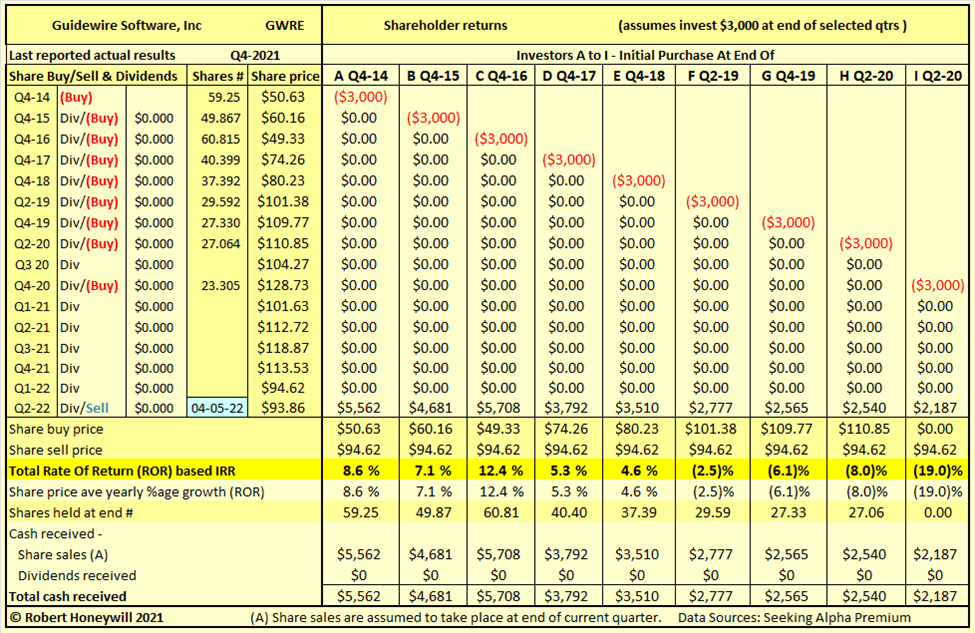
Sources: Seeking Alpha Premium
Due to rolling my table forward a year each calendar year end, all the examples in each table do not have the same investment date. But investor ‘A’ is comparable in each table and investors ‘B’ and ‘G’ in Table 1.2 are comparable to investors ‘C’ and ‘H’, respectively in Table 1.1. Tables 1.2 and 1.3 have the same investment dates for all investors ‘A’ to ‘H’, but with addition of Investor ‘I’ in Table 1.3. In each instance the average yearly return has reduced over time, due to both the fall in share price and the additional time, the duration, the shares have been held. In the case of investor ‘A’ there has been a reduction of 7.7 percentage points in average yearly return from 16.1% to 8.6%. But it must be remembered this 7.7 percentage point reduction in average yearly return applies retrospectively to all 7.5 years the shares have been held. In the case of ‘C’/’B’ a similar pattern can be seen, with average yearly return reducing by 8.4 percentage points over 6.25 years. In the case ‘H’/’G’ the average yearly return reduces from 11.7% to negative (6.1)% over 2.25 years. In Table 1.1, all investors were showing double-digit returns at August 5, 2020. In Table 1.3, all rates of return have reduced, with three investment cases now showing mid-single-digit returns and four showing negative returns. Further declines in share price will result in increasingly reduced and negative returns.
These above rates of return are not just hypothetical results. They’re very real results for anyone who purchased shares on the various dates and held through to Aug. 5, 2020, Aug. 12, 2021, and April 5, 2022. In the above examples, the assumed share sale price is the same for all investors, illustrating the impact on returns of the price at which an investor buys shares and the duration the shares are held.
Normally, at this stage, I would undertake a projection of estimated future rates of return. In the case of Guidewire Software, from a preliminary review, I can readily observe the current share price is unlikely to be able to be justified, based on analysts’ estimates of non-GAAP EPS for 2022 and beyond, or by any other means. Instead, I will go directly to review of the Guidewire Software “Equity Bucket.”
Checking the Guidewire Software “Equity Bucket”
Table 2.1 Guidewire Software Balance Sheet – Summary Format
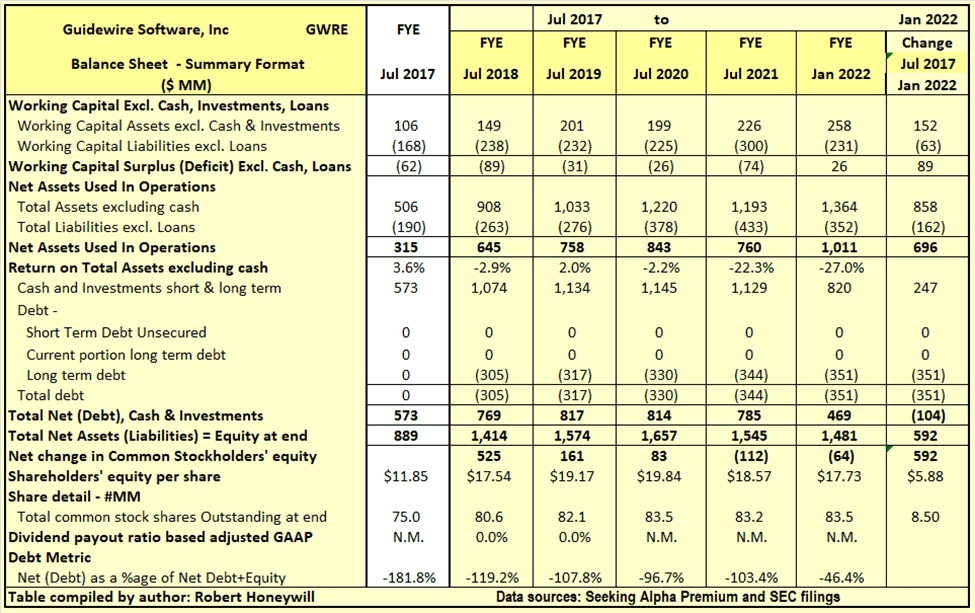
Sources: Seeking Alpha Premium and SEC filings.
Period August 1, 2017 to January 31, 2022 (4.5 years) –
Table 2.1 shows Guidewire Software has increased net assets used in operations by $696 million over the last 4.5 years. This $696 million increase in net assets has been funded by an increase in shareholders’ equity of $592 million and a reduction in cash net of debt of $104 million over the period. Guidewire Software has reported non-GAAP earnings totaling $393 million over the last 4.5 years. In the absence of dividend payments, it might be thought some of the increase of $592 million in shareholders’ equity came from this source. Unfortunately, for shareholders, this is not the case. The $592 million increase in shareholders’ equity over the last 4.5 years is analyzed in Table 2.2 below.
Table 2.2 Guidewire Software Balance Sheet – Equity Section
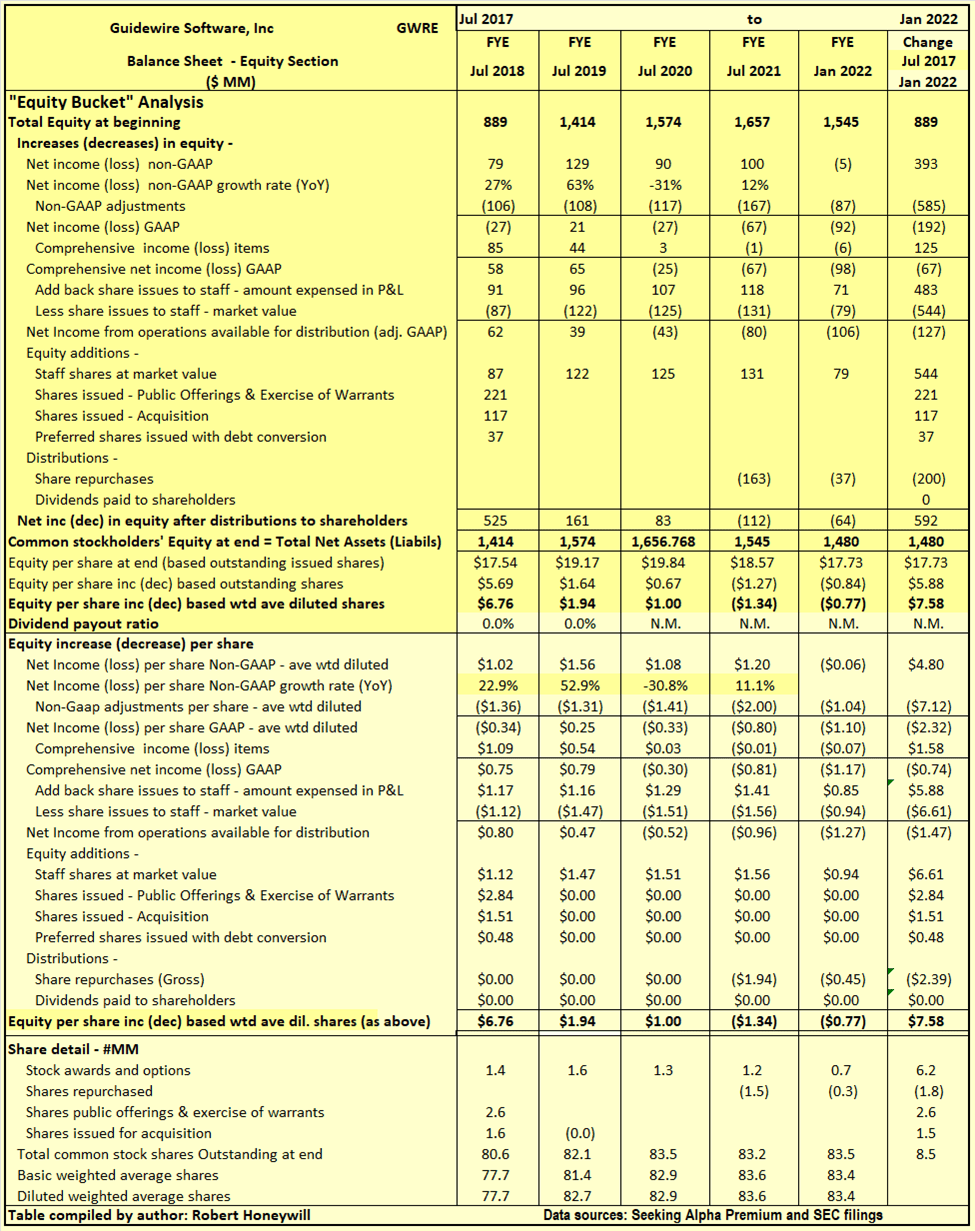
Sources: Seeking Alpha Premium and SEC filings.
I often find with companies, while they produce earnings that increase shareholders’ equity, significant amounts of distributions out of, or other reductions in equity, do not benefit shareholders. Hence the term “leaky equity bucket.” This is happening to a very great extent with Guidewire Software as explained below.
Explanatory comments on Table 3.2 for the period August 1, 2016, to April 30, 2021:
- Reported net income (non-GAAP) over the 4.5-year period totals to $393 million, equivalent to diluted net income per share of $4.80.
- The non-GAAP net income excludes $585 million of items regarded by the company management as unusual or of a non-recurring nature, in order to better show the underlying profitability of Guidewire Software. These adjustments increase reported EPS over the 4.5-year period by $7.12 per share. The impact is to convert GAAP losses of $192 million to the above non-GAAP net income of $393 million by excluding $585 million of expenses from headline profits. Most of the amount excluded relates to stock compensation expense, which is discussed in more detail further below.
- Other comprehensive income includes such things as foreign exchange translation adjustments with respect to buildings, plants, and other facilities located overseas and changes in valuation of assets in pension funds – these are not passed through net income as they fluctuate without affecting operations and can easily reverse in a following period. Nevertheless, they do impact on the value of shareholders’ equity at any point in time. For Guidewire Software, these items were $125 million positive and increased EPS by $1.58 over the 4.5-year period.
- There were share issues to employees, and these were a significant expense item. The amounts recorded in the income statement and in shareholders’ equity, for equity awards to staff, totaled $483 million ($5.88 EPS effect) over the 4.5-year period. However, the cost of share repurchases, to offset the dilutionary effect of these awards, is estimated to be higher by $61 million ($0.73 EPS effect) than the amount recorded for stock compensation expense purposes over the 4.5-year period. This understatement of expense is a material understatement of the real cost of stock compensation. This Ernst & Young publication on returning capital to shareholders expresses a similar concern –
Companies seek to offset executive compensation dilution. Buybacks can replace the shares or fund the options that companies award as compensation. A director recently cautioned that this practice could cause companies to inadvertently increase the cost of executive compensation plans: “If we are using hard dollars to offset stock dilution, we should treat those hard dollars as a compensation expense. Otherwise, we are not recognizing what we are actually spending to compensate our people.”
- This understatement of stock compensation is not a matter unique to Guidewire Software. But the situation with Guidewire Software is further aggravated by the total cost of stock compensation being excluded from reported non-GAAP results. The true economic cost is estimated at $544 million, which, if taken account of, would convert the $393 million non-GAAP net income to a net loss of $151 million over the 4.5-year period. Even if we take the lower figure of $483 million recorded by the company, including that as an expense would reduce non-GAAP net income of $393 million to a net loss of $90 million.
- By the time we take the above-mentioned items into account, we find, over the 4.5-year period, the reported non-GAAP net income of $393 million, EPS of $4.80, has decreased to a loss of $(127) million, $(1.47) EPS, reducing shareholders’ funds by that amount. Despite this loss of $127 million from operating activities, the company has commenced share repurchases. Companies often describe share repurchases, along with dividends, as a distribution of earnings to shareholders. Guidewire has no distributable earnings, so the share repurchase cost could be seen more as distributions to staff by way of stock compensation, and as support for the share price. The $200 million of share repurchases increase the deficit from operations to $327 million.
- The net addition of $592 million to shareholders’ equity, per Table 5.1 above, is comprised of this reduction of $327 million offset by other net additions to equity of $919.0 million as detailed below.
- Additions to equity included shares issued to staff at estimated market value of $544 million, shares issued in a public offering of $221 million, shares issued as consideration for acquisition $117 million, and the equity component of convertible note issue $37 million, totaling $919 million.
Guidewire Software: Summary And Conclusions
Based on analysts’ estimates of future earnings, the stock appears very much overpriced at present. Earnings have been materially overstated over the last 4.5 years due to excluding the cost of share issues to staff. These are not one-off costs – they’re a continuing expense. I can only assume analysts’ non-GAAP EPS estimates similarly exclude these very real costs, thus the forward EPS estimates are likely significantly overstated and the P/E ratios, as high as they already are, are significantly understated. I’m sufficiently bearish on this company to believe it could be attractive to those interested in shorting. Notwithstanding those negative comments, with the large amounts of capital raised over the last 4.5 years, the company has no net debt and is sound from a liquidity aspect. The company may continue to record GAAP losses, but by in effect issuing shares to raise capital to pay staff, the liquidity position will likely remain sound. That’s not a good basis for investment in the shares of a company that pays no dividend and requires ongoing share issues to survive and maintain liquidity.
Be the first to comment