

BsWei/iStock via Getty Images
By Rob Isbitts and Somya Sharma
We rate the ProShares Short S&P 500 ETF (NYSEARCA:SH) a strong buy, based on what we see as an overwhelming, historical level of risk of a major loss in the broad stock market vs. its potential for positive returns.
At a time like this, identifying, understanding and learning how to use single (-1x) inverse ETFs like SH is as important an idea for investors and traders as any we can think of. It has been around since 2006, so it has been battle-tested during the financial crisis from 2007-09, the 2011 and 2018 near-bear markets, the 2020 COVID-19 meltdown, and most recently throughout 2022’s first nine months.
ETF Strategy
SH aims to perform exactly opposite to the S&P 500 Index. That is, if the S&P 500 goes down 1% in a day, SH would be expected to go up approximately 1%. The contrary is also expected: If the S&P 500 rises, say 1% in a day, SH would be expected to decline by about 1%.
Proprietary ETF Grades
- Offense/Defense: Defense
- Segment: Hedged Equity
- Sub-Segment: Inverse S&P 500
- Correlation (vs. the S&P 500): Very High
- Expected Volatility: Moderate
Proprietary Technical Ratings
- Short-Term Risk (next three months): Very Low
- Short-Term Reward (next three months): Very High
- Long-Term Risk (next 12 months): Low
- Long-Term Reward (next 12 months): High
Analytical Highlights
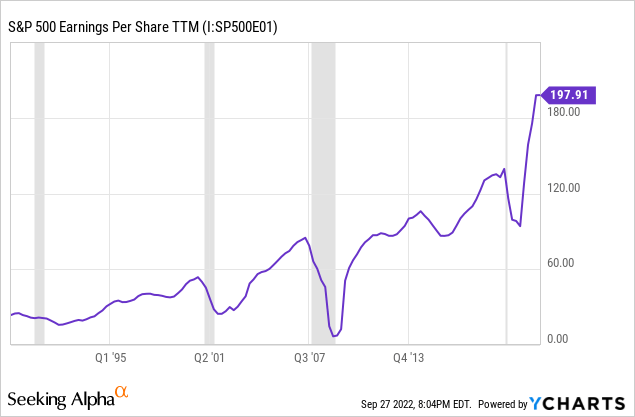
Given that SH is essentially the S&P 500 in reverse, the more overvalued we believe the S&P 500 is the more undervalued we’d expect to view SH. Below is a chart of S&P 500 earnings over the past few decades – the grey-shaded areas show recessions. You can see that S&P 500 earnings drop sharply leading into and during recessions. We think that’s the most likely scenario for the next two to three quarters, at least.
So, while some S&P 500 annualized earnings estimates still hover in the $200 area in the year ahead, we suspect that is well above where they will actually land. Translation: a very overvalued stock market at this stage of the bear market cycle. That’s despite the S&P already sitting about 20% off its all-time high from January of this year.
This ETF’s annual expense ratio of 0.89% might fool some investors. Let’s explain why it shouldn’t. Investors have been conditioned to think that if an ETF has an expense ratio higher than an S&P 500 index fund, it is “too expensive.” But when an ETF provides something that can potentially add true alpha to a portfolio, the “cost” is not so much the expense ratio – it’s the opportunity cost of not taking advantage of an innovative, time-tested ETF like SH.
Case in point: Here is the return path of SH and SPDR S&P 500 Trust ETF (SPY), the most popular S&P 500 Index tracking ETF, so far in 2022.
YCharts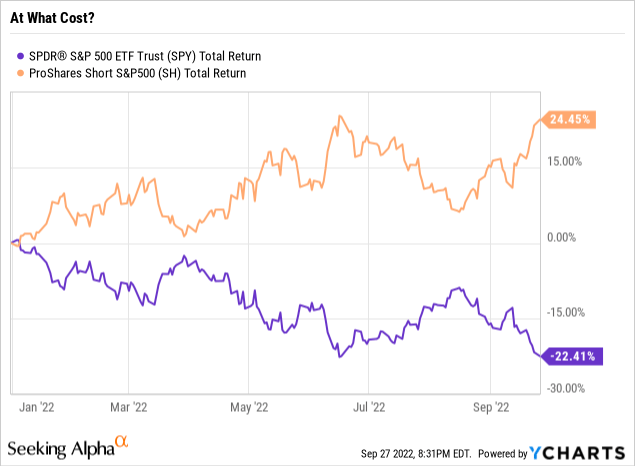
SH aims to accomplish its “inverse” objective by first investing its cash in U.S. Treasury bills. That provides the collateral to execute what simulates a “short” position in the S&P 500 index. Since you can’t invest directly in an index, the fund uses an array of derivative instruments. These include, among others, swap agreements – where the fund enters into agreements with major financial institutions, in which SH gets the opposite return of the S&P 500 as its part of the deal – and futures contracts, specifically shorting S&P 500 index futures.
Other than the aforementioned U.S. Treasury bills, SH does not own income-producing securities. In fact, its derivatives exposure might result in it being “short” the S&P 500’s dividend, which could slightly drag on its return vs. the inverse S&P 500. Countering this is the recent surge in yields on T-bills, which might allow SH to accrue more interest on that collateral. Either way, income and yield are not priority factors in considering an investment in SH.
Recent News
The biggest news impacting SH has been the awful performance of the S&P 500 index in 2022. SH has, by the nature of its construction and intentions, performed very well so far this year. That’s a direct result of the S&P 500 falling by nearly 20% year to date through late September. And that tells us that SH is doing what it says it’s supposed to do. That’s all an investor can ask of any ETF.
That’s the past. The question is: What’s likely to happen in the U.S. large-cap stock market going forward, through 2022 and into 2023? When we review our proprietary technical ratings and assess the larger macro landscape, we always express our bottom-line view as follows: Can the market go up, substantially and sustainably? Yes. Because it always can, at any time. But what truly drives our market outlook, and thus our current ETF rating on SH is our assessment that the risk of a major loss in the S&P 500 continues to be as high as any time in recent memory.
Risks to Our View
The key risk of inverse ETFs like SH lies in an understanding of the math of investment loss. When the market goes up and SH goes down consistently for a period of time, SH’s return is not as simple as the opposite of the S&P 500 when you look out over weeks or months. To us, that simply means one needs to know what they own when using this type of security. And, as with any traditional “long” investment, one needs to do their homework.
The biggest risk to our very bearish outlook on the S&P 500 (and thus our very bullish rating on SH) is something that investors are hoping for, but we give a low probability of occurring: a sudden change of heart by the Fed. As we see it, the Fed – after years of coddling investors with low interest rates – has boxed itself and the investor population into a corner. High, persistent inflation – even if it ultimately lands around 5%-6% – is still way more than consumers are used to.
Conclusion
Whether it’s inflation spiking and possibly remaining high, central banks around the globe making a major policy error, geopolitical hot spots like Russia and China, or high short-term bond yields providing competition for stocks – there is no shortage of worries. But what ultimately “speaks to us” is the price pattern. For the S&P 500, that leans heavily bearish. In turn, that produces a very strong reward/risk tradeoff for SH in the period ahead.
For the first time in nearly 50 years, the world has a significant inflation problem. The Fed has to stamp out inflation, do it as forcefully as possible, and “break” the stock market temporarily if that’s what it takes. Only by so-called “demand destruction” can investors and consumers be weaned off of the expectation of the Fed bailing them out as in 2016, 2018, and 2020.
This should make SH and the array of other bear-market-fighting ETFs very popular with investors, if our forecast is even close to accurate. Our technical, fundamental, and quantitative analysis of the S&P 500 imply so much risk in almost every corner of the U.S. stock market; we simply cannot try to sugarcoat our perspective for investors.
The great news is that the S&P’s loss is SH’s gain – literally. We see SH as one of many tools that exist to help investors not only defend bear markets, but attack them for potential profit.
Be the first to comment