


JHVEPhoto/iStock Editorial via Getty Images
Smart-beta strategies have somewhat of a mixed reputation. There are pundits who argue that the class does not match the hype as sophisticated funds frequently charge premium fees that are unjustified as they lag the market consistently regardless of the macro environment, incapable of minimizing drawdowns amid bear parties and rising more than the market when the conditions are buoyant. Though this might sound a bit blunt, their skepticism is not completely groundless. I have written numerous articles on smart-beta ETFs (equal-, factor-weighted, etc.), and most have barely appealing returns, though strategies they leverage are at times nothing short of beautiful.
The Goldman Sachs ActiveBeta US Large Cap Equity ETF (NYSEARCA:GSLC), the ETF we will be discussing today, is an interesting example of a fund leveraging a peculiar factor-driven equity strategy. Is it another example of a smart-beta strategy with poor returns? Does it have an edge over the iShares Core S&P 500 ETF (IVV) as we are approaching 2023 with the harrowing inflation question and capital scarcity still being the primary (and interconnected) concerns? There are a lot of nuances to assess.
GSLC’s strategy is based on the quarterly-rebalanced Goldman Sachs ActiveBeta U.S. Large Cap Equity Index. In short, the benchmark aggregates four equally-weighted sub-indices designed to reflect the performance of the stocks demonstrating value, momentum, quality, and low volatility characteristics which are assessed using ‘factor scores.’ For instance, for the value factor, a composite of well-known measures like Book Value/Price, Sales/Price, and Free Cash Flow/Price is used. Constituents are drawn from the Solactive US Large Cap Index.
However, despite having a complicated stock-selection schema, the ETF is still only marginally different from IVV. Let me elaborate on that.
In the current version, GSLC has 443 holdings excluding cash vs. IVV’s 503 equities. This might make an impression the portfolio is lighter for a reason as laggards were shown the red light, and material differences in factor exposure should be expected. Reality suggests otherwise.
The major ten holdings account for a quarter of IVV’s net assets, while in GSLC their weight is about 21%, which is a slight tailwind for its Risk profile. However, the top three companies in both are Apple (AAPL), Microsoft (MSFT), and Amazon (AMZN). The differences in weights are measly (the data as of December 13).
| Ticker | Weight in IVV | Weight in GSLC |
| AAPL | 6.5% | 5.9% |
| MSFT | 5.6% | 4.8% |
| AMZN | 2.4% | 2.0% |
GSLC is meaningfully behind IVV regarding allocation to the mega-cap echelon, for better or worse. As per my calculations, its weighted-average market cap is unsurprisingly only $391 billion vs. IVV’s around $461 billion. This should be supportive of a cheaper valuation, yet perhaps at the expense of quality.
What do we have in reality? First, let me touch upon the earnings yield, or a Price/Earnings ratio, perhaps the most popular metric to assess how the market is priced. The one IVV has if we factor in negative yields also is about 4.8% which translates into around 20.8x P/E (Last Twelve Months). Here, GSLC is seemingly ahead, with 5.3%, as of my calculations, a figure reflecting a 3.4% share of the holdings being loss-making.
Next, Enterprise Value/Sales and Price/Sales again imply it is comparatively cheaper; IVV has 5x and 4.9x, respectively, while the Goldman Sachs fund has just 4.7x and 4.4x. Interestingly, both have almost identical forward revenue growth rates, at 11.8% and 11.6%, respectively. For better context, approximately 11.6% of GSLC’s holdings have at least a 20% rate, in my view, a minimum level for a company to be regarded as a high-growth one. Meanwhile, the rate is the exact same for IVV.
It is worth noting that this time, I decided to pass over the debt-adjusted yield (an EV/EBITDA-based one) owing to both funds having meaningful exposure to banks, insurance companies, and the like, companies that cannot be valued using the said ratio.
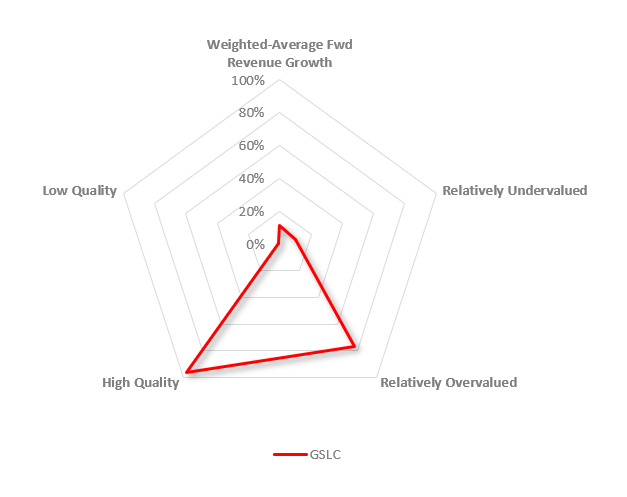
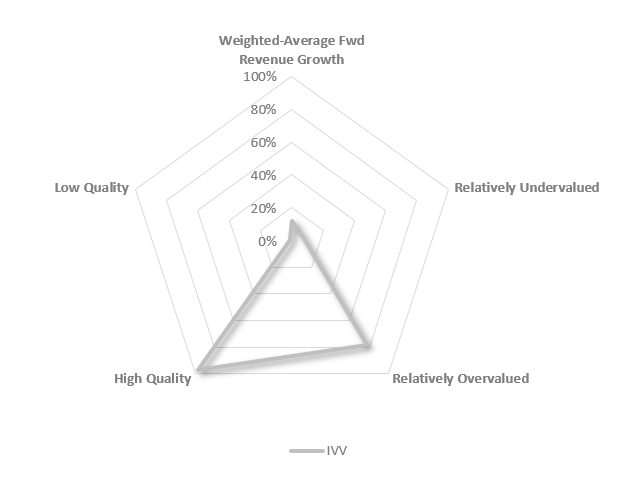
Turning to the Seeking Alpha Quant grades, those of specific interest for me at this point are Valuation and Profitability, mostly due to the inflation issue still being a major threat. Again, as the charts below suggest, there are fairly limited dissimilarities (if noticeable at all).
Created by the author using data from Seeking Alpha and the fund
Created by the author using data from Seeking Alpha and the fund
GSLC does have more than 10% of the net assets parked in stocks with a B- Valuation grade or better, or those I consider relatively undervalued vs. IVV’s 7%. This chimes well with the higher earnings yield touched upon above, yet this level is insufficient anyway. At the same time, relatively overvalued stocks (D+ and worse) account for 78% of IVV and slightly above 77% of GSLC. Finally, top-quality names (no less than a B- Profitability grade) have 97% weight in the iShares ETF and 96.7% in the Goldman Sachs fund, a solid result mostly supported by the size factor or something that could be called a large-cap quality phenomenon.
Performance: mixed picture
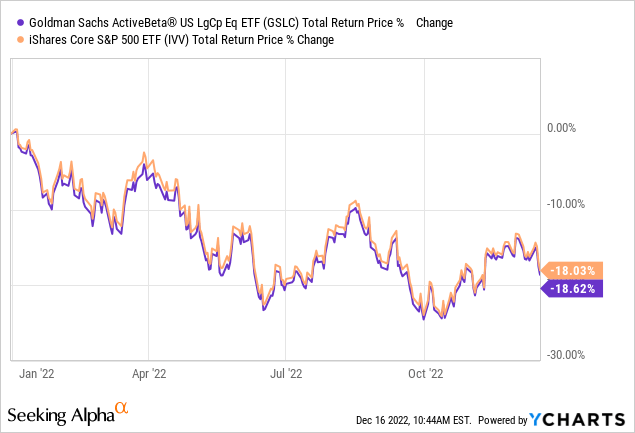
GSLC has delivered a comparatively strong performance since its inception on 17 September 2015, yet nothing extraordinary.
Though with a bit lower standard deviation, more likely owing to the low-volatility component incorporated into its index, GSLC did not deliver alpha, trailing IVV by about 80 bps over the October 2015 – November 2022 period. The max drawdown was deeper and risk-adjusted returns were softer. The following table includes more data for a broader context.
| Portfolio | IVV | GSLC |
| Initial Balance | $10,000 | $10,000 |
| Final Balance | $24,252 | $23,053 |
| CAGR | 13.16% | 12.36% |
| Stdev | 16.14% | 15.82% |
| Best Year | 31.25% | 30.75% |
| Worst Year | -13.18% | -13.79% |
| Max. Drawdown | -23.93% | -24.52% |
| Sharpe Ratio | 0.79 | 0.75 |
| Sortino Ratio | 1.21 | 1.15 |
| Market Correlation | 1 | 0.99 |
The data from Portfolio Visualizer
The next table compares monthly and annual returns, with GSLC’s outperformance highlighted in green.
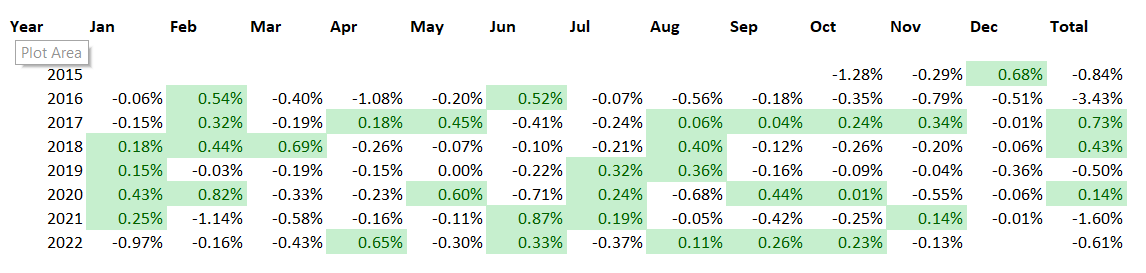
Created by the author using data from Portfolio Visualizer
Interesting issues worth paying attention to are that during the market mini-meltdown in late 2018, it fared marginally better than the S&P 500 ETF, perhaps owing to the value factor exposure that immunized it against a steeper decline somewhat. Yet during 2019 when the trade war became the main narrative, it trailed IVV. Then in the coronavirus-torn 2020, GSLC outperformed it by 14 bps, despite not targeting the growth factor which was in vogue back then. It lagged in 2021 during the heyday of the capital rotation and this year, it is again performing slightly weaker than the S&P 500 fund.
The takeaway here is that its performance is patchy, and consistent alpha is not observable.
Final thoughts
As we are heading into 2023 and the markets are searching for a direction after the recent ‘reality check,’ I see little reason to abandon the value and quality combination. There are mixed signals from the inflation data, and the Fed sounds decidedly hawkish, with higher rates to eliminate supply/demand imbalances and finally contain inflation in the cards. In this regard, topping up allocations to growth-heavy and quality-light portfolios is a bit too early for me.
Regardless, I do not see a strong reason to say GSLC is ideal for the current environment, neither in terms of value nor quality. It has a slightly higher earnings yield than IVV, which investors who are on the lookout for a better-priced large-cap mix with strong quality and adequate growth should take into account. However, I would not say that this is enough to say it is clearly better.
GSLC is an otherwise strong smart-beta ETF, with a nicely calibrated equity mix, yet with performance being mixed. In fact, it had a lower standard deviation over the period discussed, but no consistent alpha and bleaker risk-adjusted returns. It is worth noting that its expense ratio of 9 bps is certainly competitive, though IVV is even cheaper, with a 3 bps ER.
Be the first to comment