

Pgiam/iStock via Getty Images
We’ve now added the Investors Intelligence survey of newsletter writers to our master sentiment index, bringing the total sentiment indicators that make it up to nine. The nine indicators are listed below:
- 5% CBOE Total Puts and Calls Ratio
- 5% CBOE Equity Puts to Calls Ratio
- The CME Commitment of Traders data on the S&P futures
- Buying in the ProShares S&P 500 Inverse Fund (SH)
- NAAIM Exposure Index (National Association of Active Managers)
- Hulbert Rating Service (Stocks)
- Hulbert Rating Service (Nasdaq)
- The AAII Sentiment Survey
- Investors Intelligence Survey
The Investors Intelligence Survey
The Investors Intelligence survey of newsletter writers was started in 1963, twenty years before the American Association of Individual Investor survey. It is the granddaddy of all contrary opinion indicators. The famous Barron’s editor Alan Abelson referred to it constantly in the 1970s and 80s when trading the market was the only effective way for many to make money.
The chart below plots the ratio of bearish to bullish newsletter writers against the Dow Industrials from 1980 to present. The three highest peaks in the ratio, which indicate high levels of bearish sentiment, were at the start of the eighteen-year bull market in 1982, in 1994 right before the start of the six-year, the dotcom bull market, and at the end of the 2008 financial crisis.
Investors Intelligence and the Dow Jones Industrials (Michael McDonald)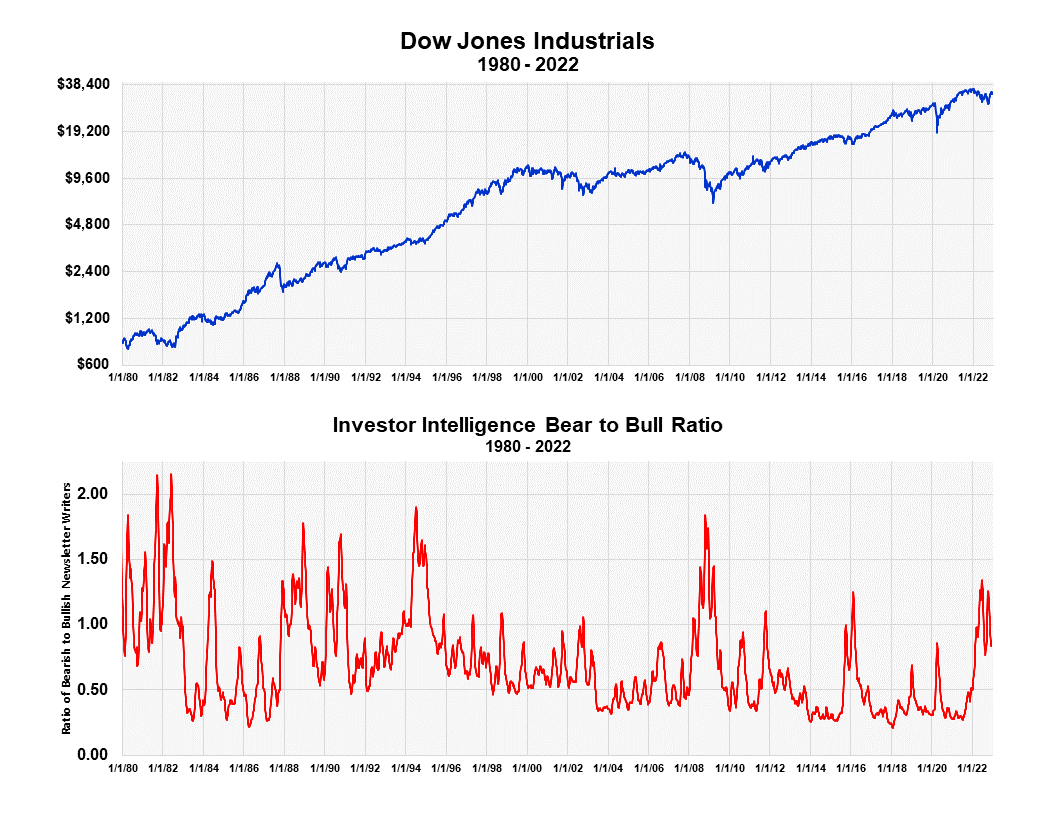
A better way to use this metric is to graph it on the Sentiment King ranking scale. This scale goes minus 10 to plus 10. The green area represents extreme bearish sentiment, the red zone extreme bullish sentiment. You will find a full explanation of the SK ranking scale (here).
SK Ranking of Investors Intelligence vs the Dow Jones (Michael McDonald)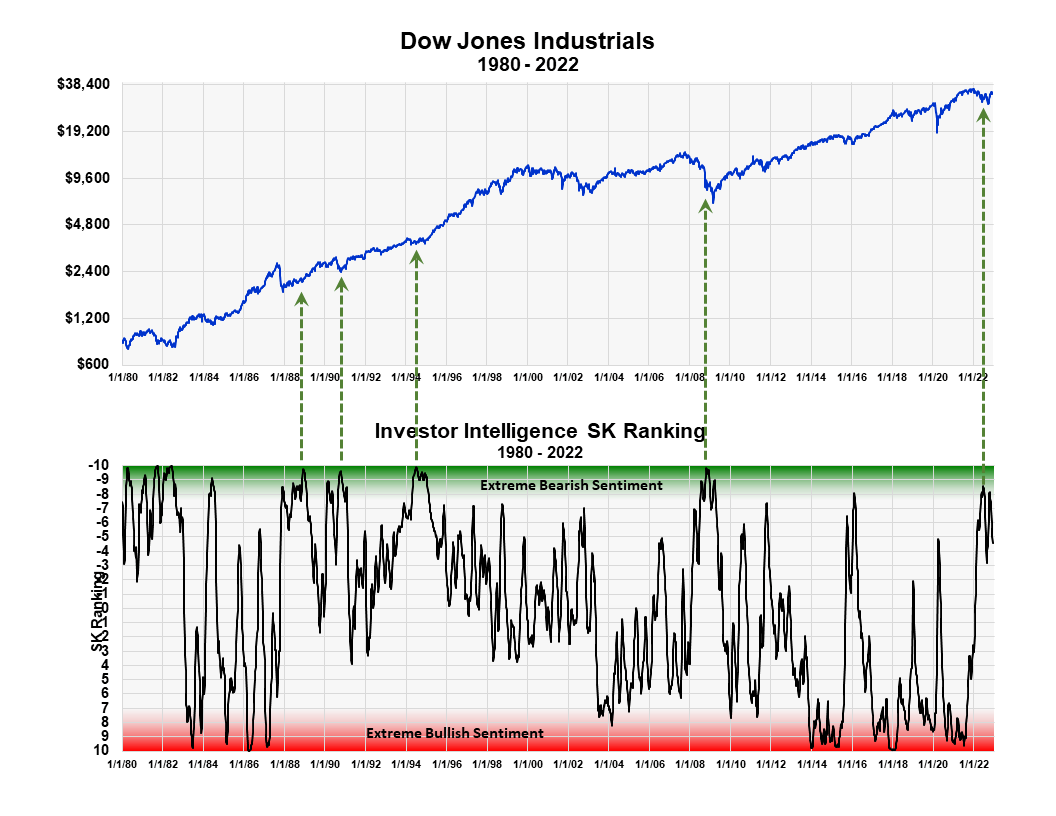
I’ve highlighted five periods in the last forty years when the Investors Intelligence ranking went to extreme bearish levels. It includes the current period. According to this indicator, newsletter writer bearish sentiment is high enough to signal a major market low.
The 1987 Crash
The first green arrow on the left points to the period after the infamous 1987 market crash.
I have a personal history with the 1987 crash since I was the tongue-tied, announcer on KWHY-TV, the Los Angeles financial station, that Monday morning. I had the unenviable duty of trying to explain the biggest one-day market crash in history, and there was zero information about it. No one knew anything. It’s an understatement to say I simply babbled along, saying nothing significant, and embarrassed myself.
In any event, over the following year, I pulled myself together, and I told listeners every week that it had to be a wonderful, long-term buying opportunity. I based that opinion solely on the Investors Intelligence readings that you see on the charts above. The analysis proved right, but the psychological damage to investors had been done; few were interested in stocks no matter what. It took another four or five years before negative sentiment thawed and investors began to consider stocks again.
The 1990 Recession
In August 1990, Iraq invaded Kuwait, causing oil prices to increase. Prices in the housing market also declined. The Dow Jones Industrial Average dropped 18% in three months, from 2,911.63 on July 3 to 2,381.99 on October 16, 1990. The recession lasted approximately 8 months. The peak in the ratio of bearish sentiment occurred on October 12th, which was the exact low in the market.
The High Level 1994 Consolidation
The graph highlights another very important point concerning contrary opinion. It’s highlighted by the third arrow from the left.
It’s natural for investors to become negative when prices decline. However, when they get extremely bearish and prices haven’t declined, that’s possibly the strongest buy signal the theory of contrary opinion can ever generate. It happened in 1994. Worries about inflation and interest rates made everyone extremely bearish, even though prices only corrected around 7%. Looking at the chart, it was really a flat price period over the entire year. Everyone was expecting prices to decline, which they didn’t. That bearish sentiment was a prelude to the largest five-year bull run at the time, which became the dot com bull market.
The 2008 Financial Crisis
The two-year, bear market associated with the 2008 real estate and financial crisis was the largest price decline centered around an economic event since the Great Depression. Prices declined over 50%. The highest ratio of bearish to bullish opinion in the Investors Intelligence index occurred on October 24th, 2008. This was five months before the actual low on the S&P 500, which occurred the first week of March 2009.
2022
The peak in the ratio this year occurred the week ending June 17th, 2022. It was followed by a second, lower peak that occurred at the end of the October 14th lower peak. But there were local lows in price.
The Master Sentiment Index
Adding this classic sentiment indicator to our Master Sentiment Indicator as the 9th indicator hasn’t changed its reading, or the conclusion, which was summarized in this article we wrote about last week (here). We will be updating the MSI, with the Investors Intelligence included, at the end of 2022.
Be the first to comment