

kanawatvector
Written by Sam Kovacs.
Introduction
Intel Corporation (NASDAQ:INTC) has been getting a lot of attention lately, for all the wrong reasons.
Maybe I should have listened to my own advice and stayed away.
In November 2020, I wrote an article titled “If Intel breaches $45, all hell breaks loose.”
Well it did breach $45, and all hell did break loose.
But I didn’t stay away. Instead we started building a position in our Hybrid portfolio, and later in our High Yield portfolio, which now holds an average cost of $34.
Intel currently trades at $27, as you can see in the MAD Chart below (click here to learn more about MAD Charts).
INTC MAD Chart (Dividend Freedom Tribe)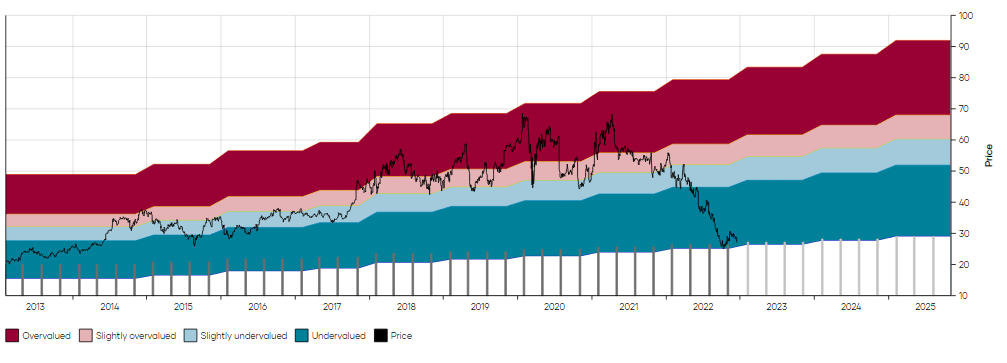
Intel currently yields 5.38%, but just 3 months ago it yielded as much as 5.8%.
At no time in the past 29 years, since Intel started paying a dividend, has it yielded anywhere near this much.
When dividend yields shoot up, it is natural for investors to ask if it is a signal from the market that the dividend is no longer sustainable, and will, therefore, be cut.
Dividend investors might even scare themselves by looking at a couple quarters of free cash-flow numbers without breaking them down.
But I want you to rest assured, the dividend won’t be cut.
Why the dividend won’t be cut
Intel’s dividend likely won’t be cut for two reasons:
- It doesn’t need to be.
- Management said it doesn’t want to cut it.
Let’s break down these two reasons.
The first one is purely arithmetic. Below is the logic which I first presented to members of the Dividend Freedom Tribe on the topic:
As a reminder, for simplicity we can say that:
FCF = Operating cash-flow – CAPEX
There is only a big red flag with negative FCF if operating cashflow is negative.
During the past quarter Intel generated $1bn in operating cashflow. During the past 4 quarters, Intel generated $13bn of operating cashflow.
The negative cashflow is driven entirely by large CAPEX spending, which is likely to continue for years to come, as Intel seeks to reestablish dominance in semi’s and become the leading foundry in the U.S.
So during the past 12 months, operations generated enough cash to finance the dividend twice.
Of course, the large CAPEX still led to a massive dip in cashflow, which led to a $6bn debt issuance this year, and a reduction in cash balances.
Intel still has $23bn in cash and short term securities, which is enough to finance 15 quarters of dividends.
Finally let’s remember that Intel has an A+ credit rating, meaning that it has ample access to capital markets at competitive rates.
So you sort of get this situation where there is no real need to cut the dividend, and no incentive to cut the dividend either.
Intel has been paying a dividend for the past 29 years, and has never cut it.
To do so now when there is no need, would send an extremely negative signal to the market for no good reason.
The second reason comes down to the fact that dividend decisions are at the discretion of a company’s management.
Intel is able to continue paying its dividend. For it to continue doing so, management needs to be willing to pay the dividend.
Thankfully, less than two weeks ago, while presenting at UBS’ Global TMT conference, CFO David Zinsner put all concerns at bay when he said (emphasis mine):
Yes. I mean, I think, obviously, there’s a Board decision ultimately. So, it’s being a little out of turn probably. But I would say that our thinking, given the amount of investment that we’ve got to make is that growing the dividend, obviously, it doesn’t make a ton of sense.
And our goal is that to get to this 20% free cash flow as a percent of revenue as our optimal model. And once back in that place, of course, you might think differently about dividend growth. But until then, this is probably at the level we want. I think it is important. I think the Board feels it’s important. It gives investors a yield when we’re in an investment phase with the Company.
[…]
That said, I guess the only other copy I could say is that, we do — our best ROI is to invest in those in four years is to get our product portfolio to the right place is to leverage our manufacturing infrastructure for foundries. Those are the higher ROI opportunities. So, if something got dramatically different in terms of our cash flow, of course, that might change the calculus on the dividend, but that’s not the case today.
So there you have it, Intel will most likely not increase its dividend, but there is no plan for a dividend cut as a cut is both unnecessary and unwanted.
How you can get an extra 10% to 16% yield
The only problem though, is that if like us, you enjoy your dividends to grow each year, you might be somewhat frustrated with the lack of dividend growth which can be expected for the next couple of years from Intel.
Well fear not, because there is a very simple, and relatively rather safe way for you to boost your income from Intel with options.
Before you click away because “options are not for you,” keep in mind I lay out the strategy below in very clear terms even if you haven’t traded options before.
We’re in the process of building tools for the members of the Dividend Freedom Tribe, so that they can confidently boost their portfolios incomes with options, through selling covered calls and cash secured puts.
For Intel, I’m assuming that, like me, you own shares in the company. So we’ll be focusing on selling a covered call.
And like me, I’m assuming that you own at least 100 shares. This is important because when you sell an options contract, it covers 100 shares.
For a stock like Broadcom (AVGO), selling covered calls would apply to fewer retail investors, as it would suggest having $58,000 invested in the stock (100x the share price of $580).
But with Intel, as the share price is only $27, you only need a $2,700 position to be able to implement an option strategy.
Our strategy is simple: we’re going to sell a call option at a strike price greater than today’s price, to collect a premium today.
We’re selling someone the right to buy shares from us, at a certain price (the strike), by a certain date (the expiration date).
The premium we collect today is the source of our extra yield.
If Intel’s price goes above the strike price, we can expect to get assigned, which means we will have to sell our shares at the strike price.
The thing is, we do not want to sell our shares. We believe Intel is undervalued, and we’re content with holding the shares until that is no longer the case.
So we need to pick a strike price which is high enough above the current price, that we believe it is unlikely for Intel to rise above it before the expiration date.
The difference between the chosen strike price and the current price is our “margin of safety.”
As long as the price doesn’t appreciate by more than the margin of safety, we’ll get to keep our premium.
What do we do once the option contract has expired and we’ve kept our premium? Well we sell another one of course.
As you can imagine, yield and margin of safety have an inverse relationship. The more yield you get, the less margin of safety.
The question becomes: how much margin of safety is enough?
This will change on a stock-by-stock basis.
What we look at, is over the past 6 years (this is arbitrary and sufficient to have a very large sample base), the distribution of changes between a stock price, and the price within the next X days.
For INTC, and for the purpose of this article, we’re looking at 7, 14, 21, 28, 35, and 42 day changes, as this lines up with the days to expiration.
Below is the distribution chart of differences between the price, and the max price within the next few days.
Dividend Freedom Tribe Prototype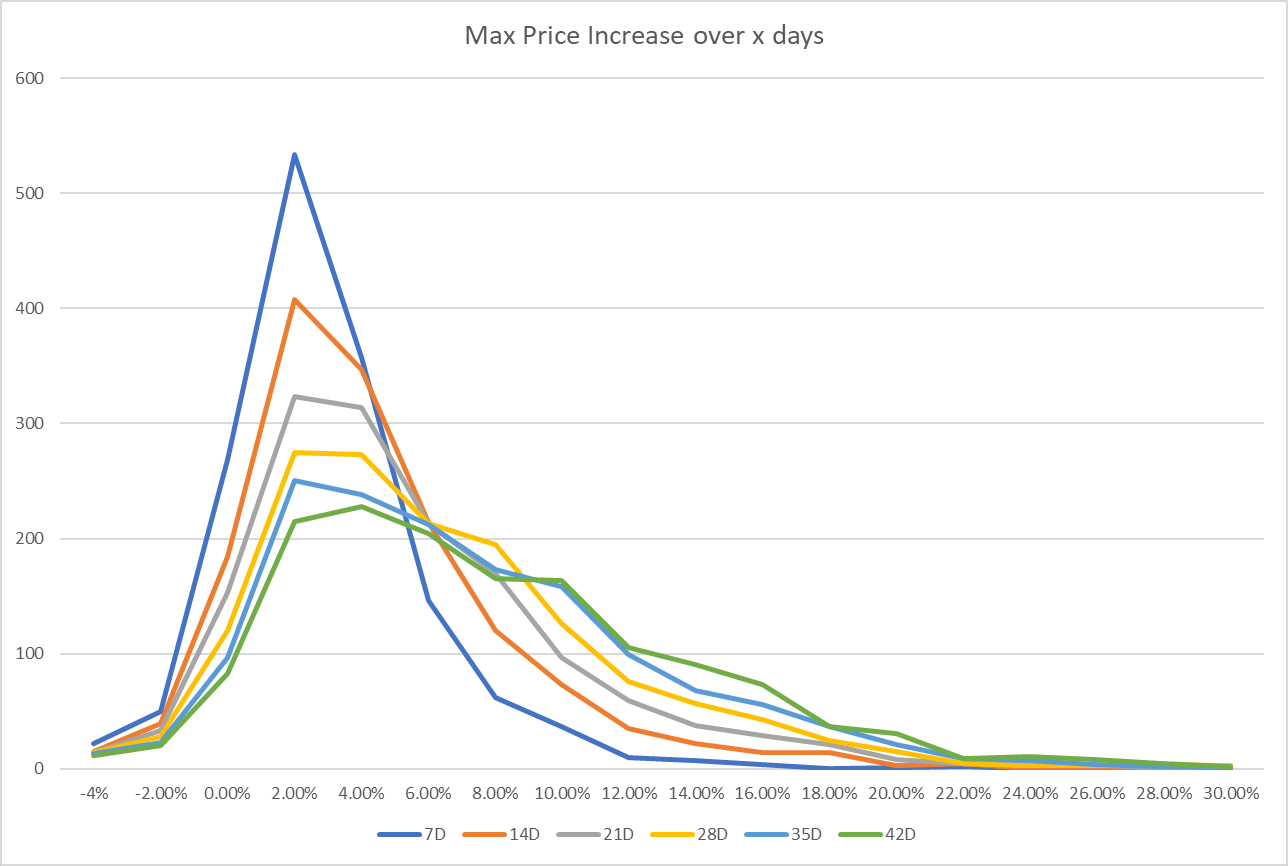
As you can see, the tail fattens as you add more days.
This is obvious. A stock can increase by more in 42 days than it can in 7 days.
While a 10% increase nearly never happens over 7 days (less than 2% of the time), it happens 25% of the time over 42 days.
The table below shows the percentiles for INTC over each time period.
| 1% | 2% | 3% | 4% | 5% | 10% | 15.00% | 20.00% | 25.00% | 30.00% | 35.00% | 40.00% | 45.00% | 50.00% | 55.00% | 60.00% | 65.00% | 70.00% | 75.00% | 80.00% | 85.00% | 90.00% | 95.00% | 96.00% | 97.00% | 98.00% | 99.00% | Maximum | |
| 7D | -4.55% | -3.10% | -2.50% | -2.17% | -1.89% | -1.04% | -0.54% | -0.17% | 0.15% | 0.45% | 0.70% | 0.95% | 1.26% | 1.49% | 1.79% | 2.12% | 2.49% | 2.90% | 3.26% | 3.79% | 4.51% | 5.42% | 7.46% | 8.05% | 8.73% | 9.50% | 11.59% | 21.19% |
| 14D | -3.88% | -2.92% | -2.16% | -1.70% | -1.56% | -0.65% | -0.10% | 0.36% | 0.69% | 1.00% | 1.37% | 1.74% | 2.18% | 2.57% | 2.99% | 3.33% | 3.85% | 4.33% | 4.98% | 5.77% | 6.78% | 8.34% | 10.89% | 11.94% | 12.92% | 15.02% | 16.74% | 24.50% |
| 21D | -3.67% | -2.63% | -2.04% | -1.62% | -1.30% | -0.41% | 0.17% | 0.61% | 1.08% | 1.44% | 1.99% | 2.43% | 2.89% | 3.35% | 3.90% | 4.49% | 5.18% | 5.86% | 6.69% | 7.53% | 8.94% | 10.57% | 13.96% | 14.89% | 15.92% | 17.06% | 20.28% | 30.98% |
| 28D | -3.68% | -2.33% | -1.79% | -1.53% | -1.19% | -0.14% | 0.46% | 0.95% | 1.42% | 2.10% | 2.67% | 3.21% | 3.70% | 4.26% | 4.89% | 5.65% | 6.35% | 7.07% | 7.86% | 8.95% | 10.38% | 12.58% | 15.36% | 16.09% | 17.42% | 18.74% | 23.67% | 32.70% |
| 35D | -3.64% | -2.13% | -1.63% | -1.29% | -0.93% | 0.19% | 0.80% | 1.30% | 1.89% | 2.59% | 3.19% | 3.77% | 4.39% | 5.14% | 5.78% | 6.53% | 7.51% | 8.33% | 9.16% | 10.27% | 11.83% | 13.97% | 16.68% | 17.66% | 18.74% | 20.70% | 24.70% | 36.27% |
| 42D | -3.64% | -2.07% | -1.47% | -1.05% | -0.66% | 0.40% | 1.03% | 1.74% | 2.30% | 3.05% | 3.68% | 4.24% | 5.09% | 5.76% | 6.47% | 7.38% | 8.36% | 9.17% | 10.19% | 11.75% | 13.19% | 14.80% | 18.03% | 18.71% | 19.98% | 22.99% | 26.50% | 36.27% |
This depends on your risk appetite, and on your intentions regarding the stock.
If you are happy to sell a stock because you believe it is overvalued, then a margin of safety which will not get called away 60-70% of the time is sufficient.
This allows you to sell options which are only slightly out of the money, which usually carry a higher yield.
But here, with Intel, this isn’t the case. We want to hold onto our shares. So I’d suggest going with a margin of safety which allows you to keep the premium 90% of the time.
In doing so, the odds are on your side.
This means, that if you sell an Intel option with the following days to expiration, then you want a margin of safety of at least:
- 7 days: 5.4%
- 14 days: 8.3%
- 21 days: 10.5%
- 28 days: 12.5%
- 35 days: 13.9%
- 42 days: 14.8%
In the table below, I used our tech (which is available freely to DFT members) to extract the options for Intel which have a margin of safety of at least 5% and a yield of at least 5%.
The details are below.
|
Contract Name |
Exp Date | Last Price | Strike | Bid | Ask | Days before exp | Margin Of Safety | Yield |
|
INTC221223C00029000 |
12/23/2022 | 0.08 | 29 | 0.1 | 0.1 | 7 |
6.81% |
16.32% |
| INTC221223C00030000 | 12/23/2022 | 0.04 | 30 | 0 | 0 | 7 |
10.50% |
6.72% |
| INTC221230C00029000 | 12/30/2022 | 0.17 | 29 | 0.2 | 0.2 | 14 |
6.81% |
15.84% |
| INTC221230C00030000 | 12/30/2022 | 0.08 | 30 | 0.1 | 0.1 | 14 |
10.50% |
7.20% |
| INTC230106C00029000 | 1/6/2023 | 0.27 | 29 | 0.3 | 0.3 | 21 |
6.81% |
17.28% |
| INTC230106C00030000 | 1/6/2023 | 0.14 | 30 | 0.1 | 0.1 | 21 |
10.50% |
8.64% |
| INTC230113C00029000 | 1/13/2023 | 0.42 | 29 | 0.4 | 0.4 | 28 |
6.81% |
20.41% |
| INTC230113C00030000 | 1/13/2023 | 0.23 | 30 | 0.2 | 0.2 | 28 |
10.50% |
11.04% |
| INTC230113C00031000 | 1/13/2023 | 0.12 | 31 | 0.1 | 0.1 | 28 |
14.18% |
5.76% |
| INTC230120C00029000 | 1/20/2023 | 0.53 | 29 | 0.5 | 0.5 | 35 |
6.81% |
20.36% |
| INTC230120C00030000 | 1/20/2023 | 0.31 | 30 | 0.3 | 0.3 | 35 |
10.50% |
11.72% |
| INTC230120C00031000 | 1/20/2023 | 0.18 | 31 | 0.2 | 0.2 | 35 |
14.18% |
6.72% |
| INTC230127C00029000 | 1/27/2023 | 0.8 | 29 | 0.8 | 0.8 | 42 |
6.81% |
25.29% |
| INTC230127C00030000 | 1/27/2023 | 0.52 | 30 | 0.5 | 0.5 | 42 |
10.50% |
16.16% |
| INTC230127C00031000 | 1/27/2023 | 0.33 | 31 | 0.3 | 0.3 | 42 |
14.18% |
10.24% |
| INTC230127C00032000 | 1/27/2023 | 0.2 | 32 | 0.2 | 0.2 | 42 |
17.86% |
6.56% |
Based on Intel’s historical movements, you should keep your shares between 90% and 95% of the time.
That’s a good risk adjusted trade.
Say you want to be a lot more aggressive, and instead pick the 35 days to expiration contract with a $29 strike price. Here, you have the same margin of safety, but would be getting a 20.3% yield.
Only based on historical movements, you’d only expect to keep your shares 60% of the time.
The incremental increase in annualized yield does not truly compensate us enough for the risk of having our shares called away. So it is not the most attractive option.
Two more of the options in the table strike me as fitting.
The 28 days to expiration option with a strike of $30. This one provides a 10% margin of safety, potential for 11% annualized yield, and you’d expect to keep your shares 85% of the time.
The 42 days to expiration option with a strike price of $31. This one provides a 14% margin of safety with potential for a 10% yield, and you’d expect to keep your shares just about 90% of the time.
Conclusion
Options can be a brilliant way to increase income of positions of firms which are undergoing transitions, and multi-year investment phases, such as Intel.
We’re continuing to build out the tools needed for dividend investors to maximize the income from their positions and boost returns by trading options safely.
Intel might pay a flat 5% yield for years to come. You could go from 5% to 15% without missing out on upside if you sell relatively short time to expiration options with good yields.
Be the first to comment