

Alena Kravchenko
Introduction
Recent earnings calls have spent significant time on Google’s (NASDAQ:GOOG) (NASDAQ:GOOGL) YouTube ad segment generally and the retail ad portion of it specifically. My thesis is that Google as a whole looks relatively stable, given the issues we’re seeing with other companies during these challenging times.
Putting Segments In Perspective
The YouTube ads segment is meaningful for Google but we have to keep it in perspective with the most important segment which is Search & other ads:
Revenue by segment (Author’s spreadsheet)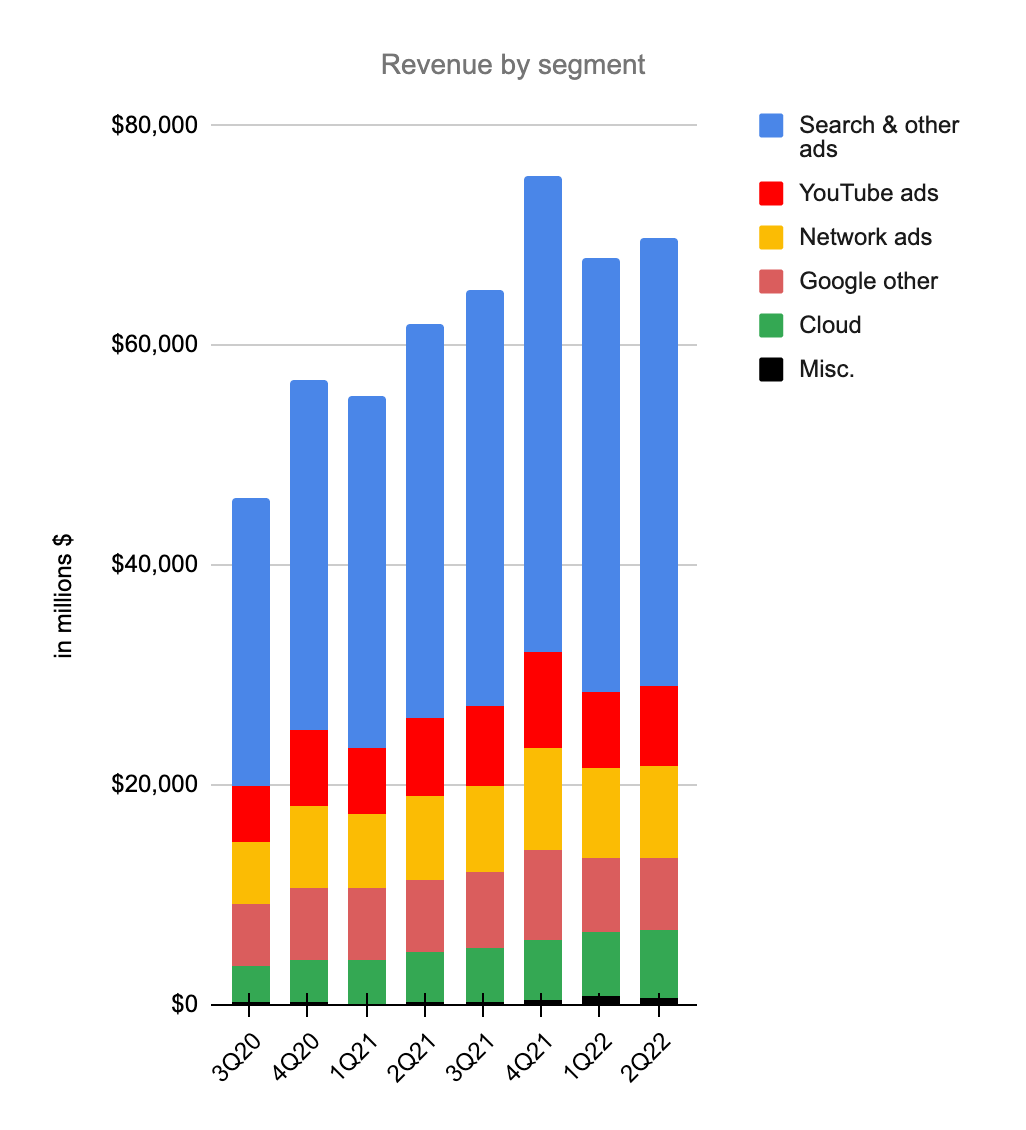
As we can see from the chart above, all of the small segments combined have less revenue than the Search & other ads segment. Looking at the last 8 quarters, Google Cloud has a higher growth rate than any segment but it still has an operating loss of almost $1 billion per quarter. The enormous Search & other ads segment has the next highest growth rate and its quarterly revenue has jumped from $26.3 billion in 3Q20 to $40.7 billion in 2Q22. Investors worry about the government punishing Google because of their Network ads segment but this $14.4 billion increase in quarterly Search ad revenue is much more than the entire $8.3 billion 2Q22 revenue for the Network ads segment. The YouTube ads segment saw quarterly revenue rise from $5 billion in 3Q20 to $7.3 billion in 2Q22. Quarterly revenue growth for the Google other segment has been more modest, going from $5.5 billion in 3Q20 to $6.6 billion in 2Q22.
Sometimes the small segments have modest growth but Google as a whole has been solid the last 8 quarters. Accounting for a mere 11% of revenue in 2Q22, the YouTube ad segment was discussed disproportionately in the 2Q22 earnings call relative to the Search & other ads segment which accounted for 58% of revenue.
YouTube Ads
Brian Nowak from Morgan Stanley (MS) asked about commerce opportunities on YouTube in the 4Q21 call and CEO Sundar Pichai answered by naming Walmart (WMT) and Target (TGT):
We have introduced a creator tagging pilot program so that viewers get a choice to browse, learn and shop products featured in their favorite videos; piloted shopping live streams with brands like Walmart and Target; and more broadly, including product feeds more globally in video action campaigns.
We’re in uncertain times with high inflation and profit warnings from Target and Walmart whose second quarters go through July, behind the more common quarterly endings in June. The warning from Target came on June 7th when they lowered their second quarter operating margin guidance from 5.3% down to 2%. The bad news from Walmart came on July 25th when they said operating income for the second-quarter is expected to fall 13 to 14%. Google investors are concerned that Walmart and Target are cutting back on YouTube ads but this didn’t stop Google from posting great overall revenue numbers for 2Q22.
Ross Sandler from Barclays expressed concerns about Walmart in a question during the 2Q22 call:
So maybe just following up on the retail segment. So some of the biggest retailers in the world like Walmart are really struggling and are looking to cut costs and sounded to me from what Ruth just said about supply chain inventory inflation that they might be cutting on YouTube.
Senior VP Philipp Schindler addressed the question, reminding everyone that Google’s approach to retail involves multiple ad channels, not just YouTube:
I think it’s also worth clarifying when we talk about retail growth, we’re talking about our overall approach to retail, which runs through all of our ads products and surfaces and our shopping strategy is just one important piece of that.
Senior VP Schindler went on to say that omnichannel is the future where retailers build a digital presence to drive both online and offline sales with Google’s help through tools like local inventory ads. He then went on to say that Performance Max is helpful for shopping campaigns. The December 2021 Performance Max video shows that the tool is not an abstruse concept; Google simply uses automation to show the most relevant ads in the most effective channels. VP Schindler stressed that the Search & other ads segment, not just YouTube, is a meaningful part of the process:
Additionally, we’re midway through the migration from smart shopping campaigns into Performance Max, which we also mentioned and advertisers have been pleased with increased reach and the increased performance. And our focus really has always been on building tools and features that help both offline and online businesses connect directly with these customers across our platforms, and we’re excited about what’s next for retail commerce across our services, especially Search and YouTube. And we will remain focused on building helpful great products and experiences for both users and these businesses.
Search & Other Ads
The Search & other ads segment is the heart of the company. Statcounter shows that Google has enjoyed about 90% of the search engine market share for over a decade:
Search market share (Statcounter)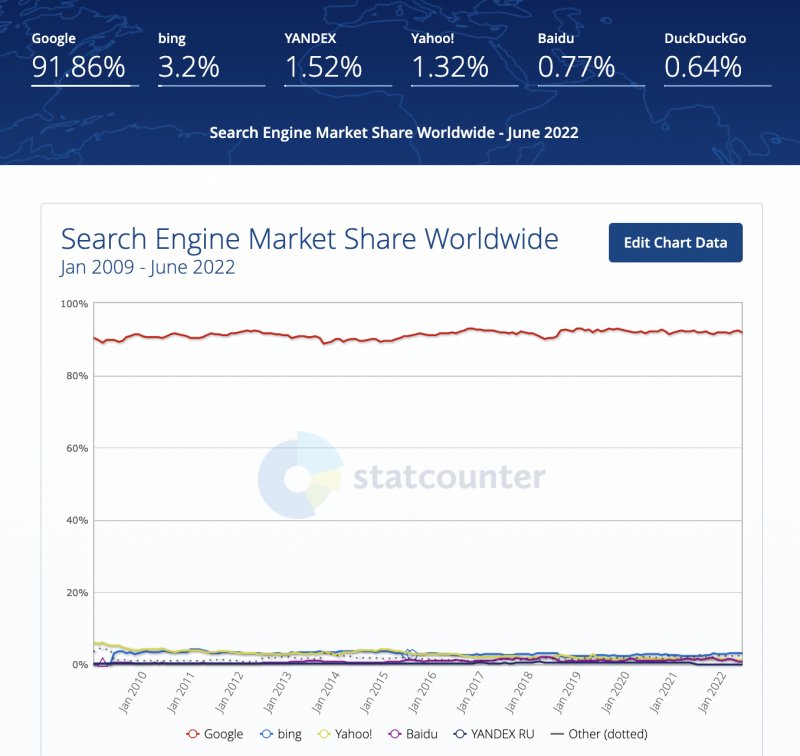
Recently I was looking back at an old article about Google’s revenue breakdown from 2011. Back then they had revenue from the entire company of $37.9 billion for the entire year whereas they had $40.7 billion in revenue from the Search & other ads segment alone in the 2Q22 quarter! I’m sure the breakdown has changed since 2011 but retail, travel and finance/insurance continue to be important. Here are those 2011 segment numbers for reference:
Ad campaigns (WordStream)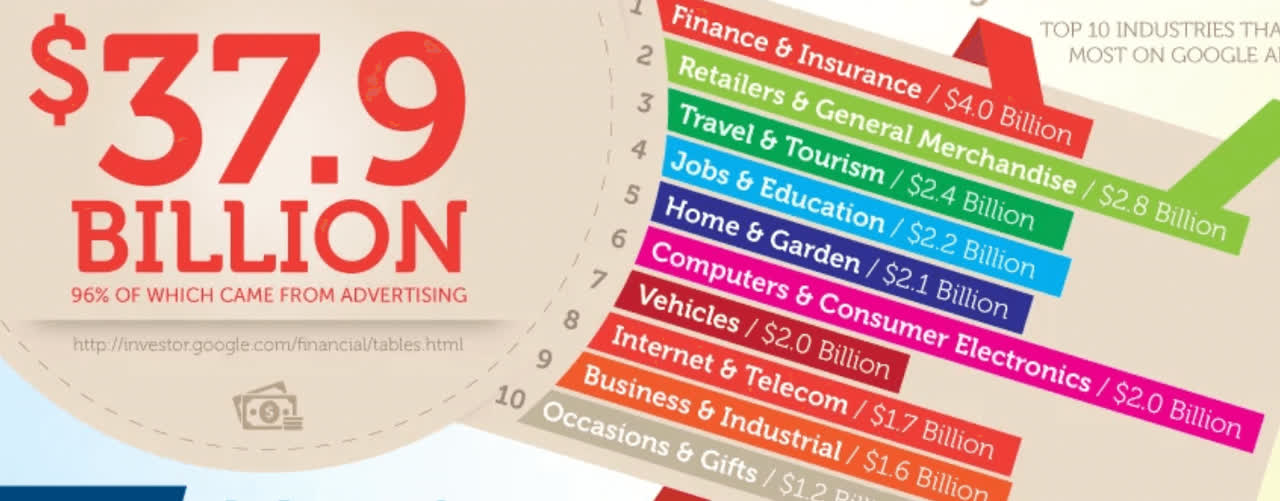
Valuation
It is important that we look at both the overall economics and the per-share economics from a valuation standpoint. The per-share economics can be impacted substantially by dilution if buybacks are not doable and stock-based compensation (“SBC”) is high. Like many companies, Google accepted recent growth with alacrity and over-hired. The 2Q22 10-Q shows that Google went up from 144,056 employees in 2Q21 up to 174,014 employees in 2Q22. It is important that they get the number of employees right and I’d like to see them use more cash compensation such that they can get their SBC as a percentage of revenue down from 7% for 1Q22 [$4.9 billion/$69,685 million] closer to the 4% range we see at Microsoft (MSFT):
SBC as a % of revenue (Author’s spreadsheet)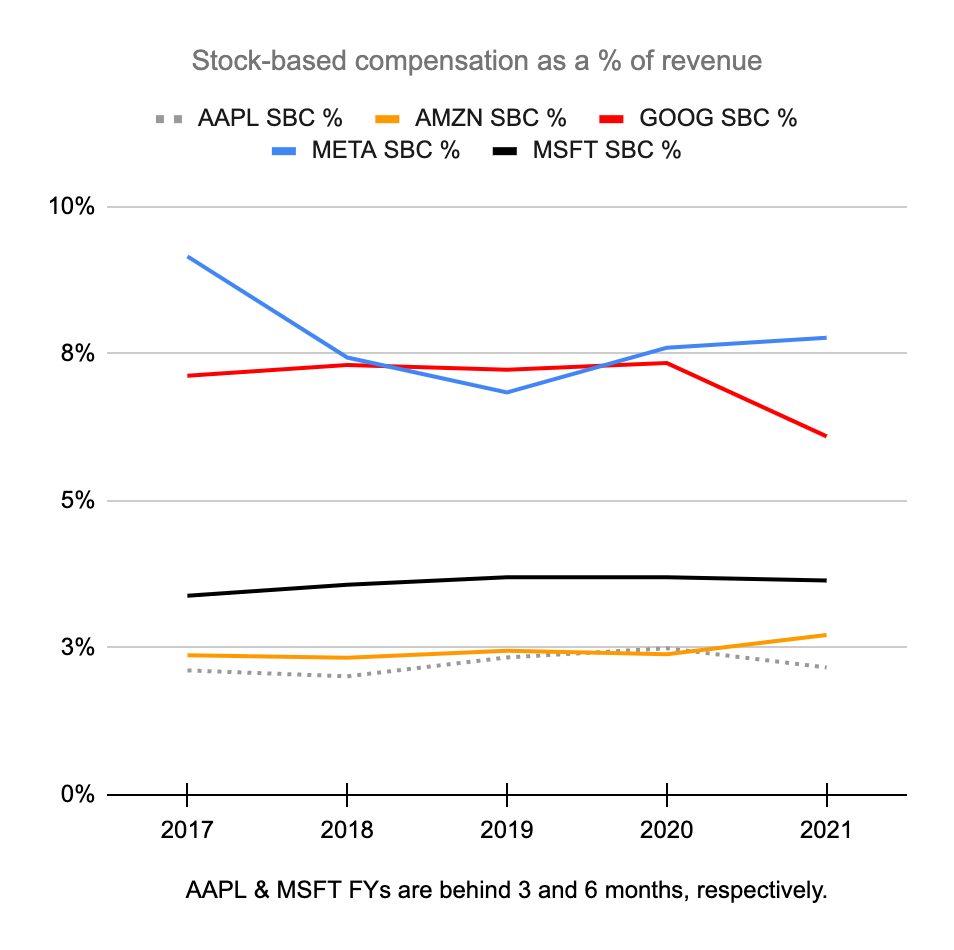
The 2021 10-K cash flow statement shows stock buybacks of $18.4 billion, $31.1 billion and $50.3 billion for 2019, 2020 and 2021, respectively. Trailing-twelve-month (“TTM”) buybacks have been $54.6 billion or $28.5 billion + $50.3 billion – $24.2 billion. Other companies like ASML (ASML) have slowed down with buybacks going from €2.1 billion in 1Q22 down to €1.2 billion in 2Q22; it’s nice that Google hasn’t decelerated with buybacks, going from $13.3 billion in 1Q22 up to $15.2 billion in 2Q22. CFO Ruth Purat answered a question from Brent Thill of Jefferies about the buybacks in the 2Q22 call:
I mean at the heart of the capital allocation strategy is really what we’ve been talking about on this call, investing in long-term growth and driving cash flow. So we have the opportunity to continue to invest and return capital to shareholders. We’re very pleased that we were able to increase the authorization up to $70 billion. And do continue to believe it’s yet another valuable tool in the overall set of investments that we make. So pleased to have it.
The F/X hit is harder on operating income than revenue per comments from CFO Purat in the 2Q22 call. TTM operating income is $82.4 billion or $39.5 billion + $78.7 billion – $35.8 billion. Keep in mind that this would be higher were it not for the Google Cloud and Other Bets segments. Google Cloud had TTM operating losses of $3,323 million [$(1,789) million + $(3,099) million – $(1,565) million]. Other Bets had TTM operating losses of $5,579 million [$(2,841) million + $(5,281) million – $(2,543) million]. As such, the TTM operating income without losses from the Google Cloud and Other Bets segments is $91.3 billion. Google’s continued resiliency while other companies struggle makes me the operating income multiples of 18 to 20 from my June article were a bit pessimistic. I think the valuation of these core segments is 20 to 22x their operating income or $1,825 to $2,010 billion. Google Cloud and Other Bets have valuations that add to this but it’s hard to determine the exact degree.
The 2Q22 10-Q shows a sum of 6,881 million A and B shares as of July 22nd which we multiply by the July 27th GOOGL share price of $118.08 to get a sub total of $813 billion. There are also 6,163 million C shares which we multiply by the GOOG share price of $118.78 to get a sub total of $732 billion. These sub totals add up to a market cap total of $1,545 billion. The enterprise value is $96 billion less than the market cap. This is because the $125 billion in cash and securities is only partially offset by $14.7 billion in long-term debt, $11.7 billion in long-term operating lease liabilities and $2.3 billion in short-term operating lease liabilities.
My valuation range is well above the market cap and the enterprise value without even making considerations for Google Cloud and Other Bets. As such, I think the stock is a good buy at today’s levels if it can be held for long periods of time.
Be the first to comment