

Drew Angerer
Introduction: Why is Alphabet Stock Down?
Alphabet Inc. (NASDAQ:GOOG, NASDAQ:GOOGL) (“Google”) reported Q3 2022 results after markets closed on Tuesday (October 25). Shares fell more than 6% in after-market trading, with Class C shares finishing the session at just 3% above their 52-week low:
|
GOOG Share Price (Last 5 Years) 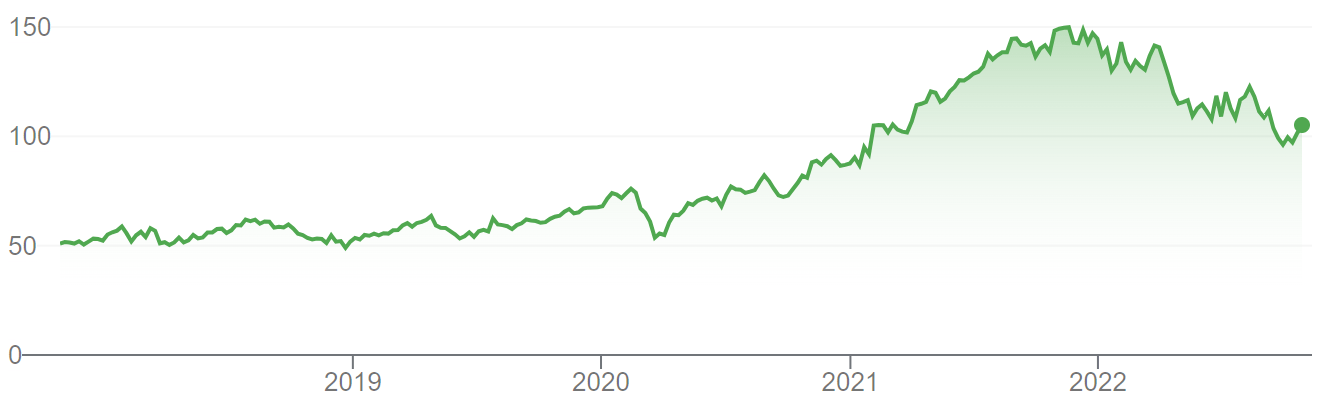 Source: Google Finance (26-Oct-22). |
We initiated our Buy rating on Alphabet in January 2021. Class C shares have gained just 3.6% since then, after a decline of 32.0% year-to-date. (Alphabet has two classes of publicly-traded shares, A and C, with the same economic rights and similar prices; in this article, we refer to Class C share prices only).
Alphabet’s Q3 2022 results showed clear signs of an economic slowdown. Year-on-year revenue growth slowed to 6.1% for the group and 2.5% in Advertising. This was partly due to a 5 ppt currency headwind, but demand also declined among some advertisers. EBIT fell 18.5%, as year-on-year cost growth remained high due to the ongoing effect of new hires in prior quarters. We expect currency headwinds and the ad market slowdown to get worse, while cost growth is likely to moderate rather than reverse. We now expect declines of 10% in EBIT and 22% in EPS in 2022.
However, the fundamental strength of Alphabet’s growth engine is undiminished, and we expect a low-teens EPS growth to resume in 2023. On 2021 financials, Alphabet shares have a 15.6x P/E and a 4.1% Free Cash Flow Yield. Our reduced forecasts indicate a total return of 144% (32.3% annualized) by 2025 year-end. Buy.
Alphabet Buy Case Recap
We believe Alphabet can deliver a low-teens EPS CAGR for the foreseeable. This includes a low-teens revenue growth driven by multiple businesses:
- Search & Other growing at mid-single-digits or higher, with the advertising sector growing at GDP or faster, and Google continuing to gain share thanks to its competitive advantages, including its technology and network effect
- YouTube Ads growing at strong double-digits; this is a relatively new product growing at 30%+ a year in recent years, thanks to still-rising user consumption and continuing improvements in ad technology
- Network growing at mid-single-digits, driven by similar drivers as those of Search & Other
- Google Cloud growing at strong double-digits, based on increasing demand for cloud computing and Google Cloud’s differentiated strategy and ability to leverage Alphabet’s unique advantages
These revenue growth assumptions are significantly lower than Alphabet’s track record and likely conservative:
|
Alphabet Revenues & Revenue Growth by Segment (2017-21) 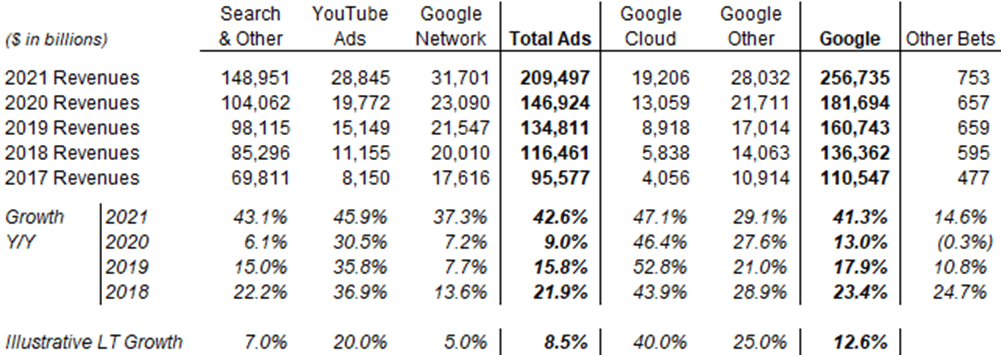 Source: Alphabet company filings. |
We expect EBIT to grow slightly faster than revenues over time, thanks to both economies of scale and operational leverage in Alphabet’s platform. We also expect EPS to grow faster than EBIT, as buybacks continue to reduce the share count each year. The overall result is a long-term low-teens EPS growth.
Alphabet’s current P&L likely understates its profitability, as the company remains in investment mode; losses at Google Cloud and Other Bets alone are equivalent to approx. 9% of group EBIT (as of Q3 2022). Equity investments in various new ventures, which do not contribute to group EBIT, had a reported value of $30.7bn. Standard metrics like P/E therefore tend to overstate Alphabet’s valuation.
Q3 2022 results showed clear signs of an economic slowdown, with earnings in decline as year-on-year cost growth remained high due to the ongoing effect of new hires in prior quarters.
Google’s Macro-Driven Revenue Deceleration
Alphabet’s year-on-year revenue growth slowed to 6.1% for the group and 2.5% in Advertising in Q3, after each growing more than 40% in the prior year:
|
Alphabet Revenue & EBIT by Segment (Q3 2022 vs. Prior Periods) 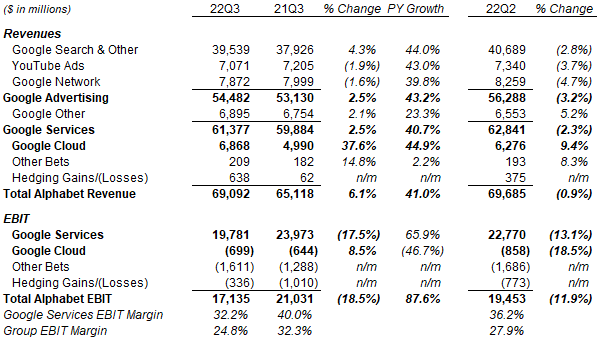 Source: Alphabet company filings. |
Revenues also fell 0.9% for the group and 3.2% in Advertising from Q2. Outside the seasonal post-holiday dip each Q1, this was the first sequential revenue decline at Alphabet since Q2 2020, the first full quarter after COVID-19 lockdowns:
|
Google Advertising Revenues by Quarter (Since 2019) 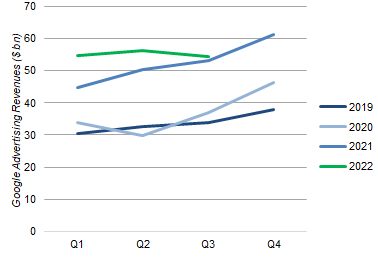 Source: Alphabet company filings. |
Management attributed the advertising revenue deceleration to currency headwinds, a strong prior-year comparable as well as ”a pullback in spend by some advertisers.” first observed in YouTube and Network in Q2 results, which had got worse and became observable in Search too in Q3
The strong U.S. dollar was a 5.1 ppt headwind on group revenue growth in Q3; excluding this, year-on-year revenue growth was 11.2% for the group, likely near 10% for Search and positive even for YouTube and Network. However, currency was also a 3.7% headwind in Q2, so currency alone only explains a small part of the sequential slowdown. Similarly, while Advertising revenues did grow 43.2% in the prior Q3, they also grew 69.9% in the prior Q2:
|
Google Advertising Revenue Growth by Quarter (Since 2020) 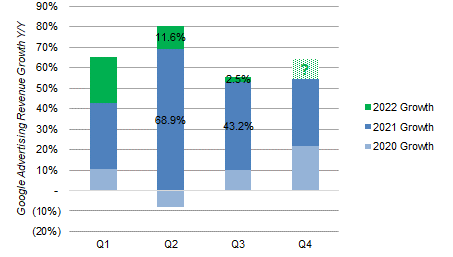 Source: Alphabet company filings. NB. Growth rates include the impact of currency. |
Alphabet discloses ex-currency revenue growth rates for the group (but not for individual segments) and, on these figures, Q3 represented a clear step-down in revenue growth from previous quarters:
|
Alphabet Group Revenue Growth by Quarter –ex-Currency (Since 2020) 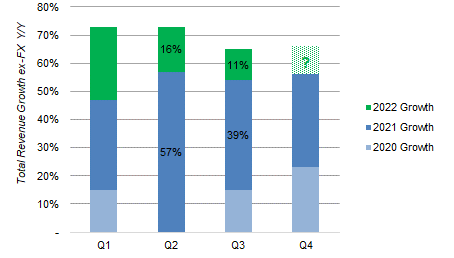 Source: Alphabet company filings. |
A meaningful part of the revenue deceleration is thus attributable to a slowdown in advertising demand in Q3. As Chief Business Officer Philp Schindler explained on the call
On the second quarter earnings call, we noted a pullback in spend by some advertisers in YouTube and Network, and these pullbacks in spend increased in the third quarter. In Search and other, the largest factor in the deceleration in Q3 was lapping the outsized performance in 2021 … [but] we did see a pullback in spend by some advertisers in certain areas and search ads”
We believe there are clear signs of an economic slowdown. An example of advertisers’ pullback is in financial services, in subcategories including insurance, loan, mortgage and crypto, likely the result of higher interest rates and weaker investor sentiment. There were also “lower revenues from app promo spend on YouTube, Network and Play ads in Search and other” as a result of user engagement in gaming normalizing downwards from pandemic highs. Even in Google Cloud, where revenues grew 37.6% year-on-year (up from 35.6% in Q2), demand is weakening:
Certain customers are taking longer to decide, and some have committed to deals with shorter terms or smaller deal sizes, which we attribute to a more challenging macro environment.”
– Ruth Porat, Alphabet CFO (Q3 2022 earnings call)
We expect the revenue growth to decelerate further in Q4. Porat stated expectations for “an even larger headwind from foreign exchange” and another tough prior-year comparable on the call, and we expect the economy to slow further.
However, we believe the fundamental strength of Alphabet’s growth engine is undiminished. Excluding currency, revenue growth was likely positive in all Advertising lines. Most of the factors behind the deceleration in Advertising revenues are macro-related, Google continues to dominate in Search, and YouTube is making good progress in new areas such as connected TV and Shorts. Google Cloud revenue growth was again in strong double digits.
Ongoing Cost Headwinds From Previous Hires
Alphabet’s EBIT fell 18.5% year-on-year in Q3, as cost growth remained high due to new hires in prior quarters:
|
Alphabet Group P&L (Q3 2022 s. Prior Periods) 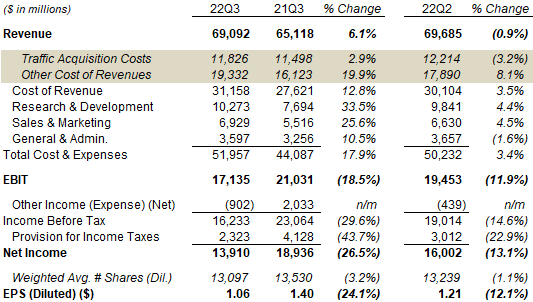 Source: Alphabet company filings. |
Alphabet finished Q3 with 186.8k employees, up 24.5% year-on-year and up 7.3% from Q2. Excluding 2.6k gained with the Mandiant acquisition, the 12.8k sequential increase was roughly the same as the 10.1k seen in Q1.
Alphabet’s EBIT has now declined for three consecutive quarters since peaking in Q4 2021:
|
Alphabet EBIT by Quarter (Since Q2 2019) 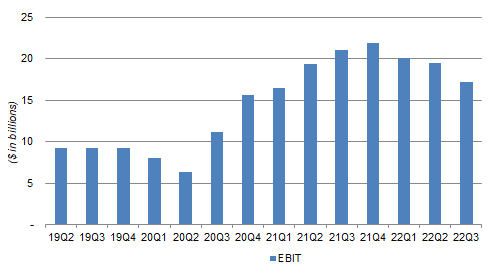 Source: Alphabet company filings. |
Alphabet has started taking actions on costs. However, sequential cost growth has largely remained the same in Q3, except in Traffic Acquisition Costs, which fell partly due to the (dollar) decline in YouTube revenues:
|
Alphabet Costs by Quarter (Since Q4 2019) 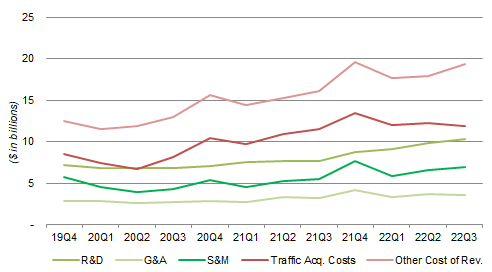 Source: Alphabet company filings. |
Cost growth is likely to moderate rather than reverse, management still sees the need to invest and is focused on “redeploying” rather than “reducing” headcount. “Headcount additions will slow to less than half the number added in Q3” in Q4, but will still be positive. Management expects the benefit of slower hiring to “become more apparent in 2023.”
Reducing Our Alphabet Forecasts
We now expect declines of 10% in EBIT and 22% in EPS in 2022, the latter largely due to investment losses.
Year-to-date, group EBIT is roughly flat (down 0.3%) year-on-year, but Net Income is down 17.3% due to investment losses, which turned “Other Income” of $9.50bn last year to an “Other Expense” of $2.5bn:
|
Alphabet Group P&L (Q3YTD 2022 s. Prior Periods) 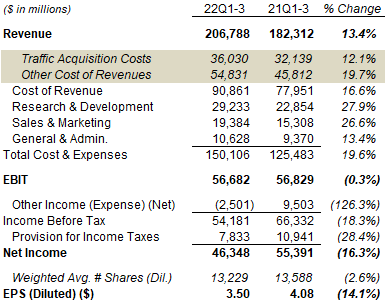 Source: Alphabet company filings. |
Year-to-date, Alphabet had reported $3.25bn of net investment-related losses, with losses of about $2bn each on debt and equity securities, offset by lower estimates of future performance fees:
|
Alphabet Other Income/(Expense) (Q3 YTD 2022 s. Prior Periods) 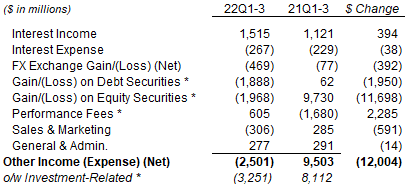 Source: Alphabet company filings. |
For Q4 2022, if we assume revenues to be flat year-on-year dollars, costs to rise by the same $9.4bn sequentially as in Q4 2021 (when headcount grew 6.5k), and a neutral “Other Income/Expense,” then EBIT would fall 36.0% and Net Income would fall 42.6%:
|
Alphabet Group P&L (Q4 2022 Forecasts vs. Prior Year) 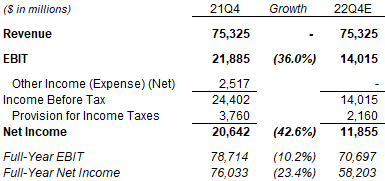 Source: Alphabet results release (Q4 2021). |
These figures imply declines of 10.2% in EBIT and 23.4% in Net Income for the full year. Helped by buybacks, the implied EPS decline is around 22%.
Each investment loss is by nature one-off, and we do not expect the same losses to recur. In 2023, simply not repeating the $3.25bn investment-related losses for Q1-3 2022 would be worth near 5 ppt in Income Before Tax growth.
Alphabet Stock Forecasts
We reduce our 2022 forecasts significantly on both slower operational growth and higher investment losses. However, we keep the same growth assumption for 2023, as the lower 2022 base offsets weaker macro assumptions, and a higher growth assumption from 2024 onwards, representing a rebound from the 2022-23 deceleration
Our key assumptions now include:
- For 2022, Net Income to decline 23.4% (was flat)
- For 2022, share count of 13,229m (was 13,282m)
- For 2023, Net Income to grow 10% (unchanged)
- From 2024, Net Income to grow at 12.5% each year (was 10%)
- From 2023, share count to fall by 2.5% a year (was 2%)
- P/E at 35x at 2025 year-end (unchanged)
- No dividends (unchanged)
Our new 2025 EPS forecast is $6.61, 18% lower than before ($8.10):
|
Illustrative Alphabet Return Forecasts 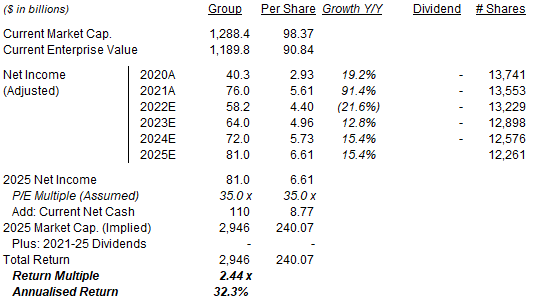 NB. Share price figures are for Class C shares. Source: Librarian Capital estimates. |
With shares at $98.37, we expect an exit price of $240 and a total return of 144% (32.3% annualized) by 2025 year-end.
With Alphabet’s sharp de-rating year-to-date, the bulk of our forecasted return is expected to come from a recovery in the P/E re-rating to 35x. (The P/E was at 34x at our initiation in January 2021.) However, if we were to assume a 20x P/E, the total return would still be 43% (12.0% annualized).
Valuation: Is Alphabet Overvalued?
Class C shares finished after-market trading at $98.37. Relative to 2021 financials, this means a P/E of 15.6x and a Free Cash Flow (“FCF”) Yield of 4.1%, after adjusting out $110bn of net cash (worth 8.6% of the market capitalization). On last-twelve-month financials, the P/E is 17.8x and the FCF Yield is 3.1%:
|
Alphabet Net Income & Cash Flows (Since 2018) 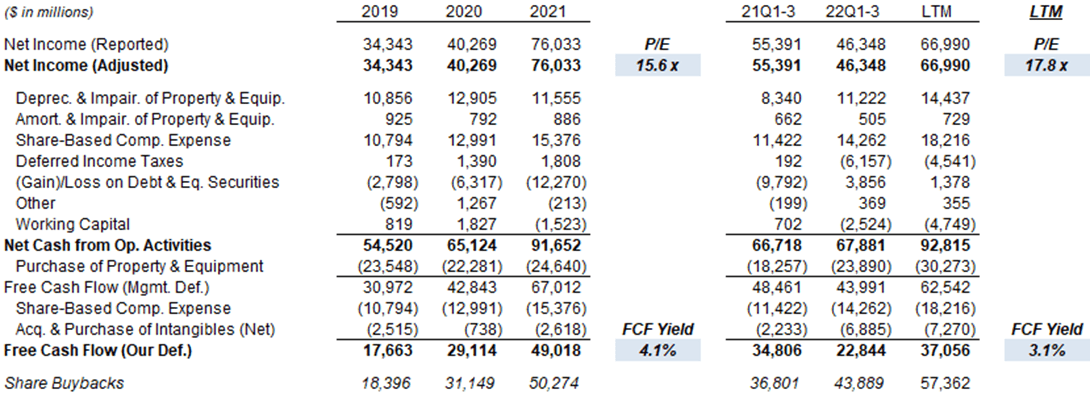 Source: Alphabet company filings. |
On our 2022 forecasted EPS of $4.40, the P/E is 22.3x.
However, all these metrics are imperfect in some ways, with CapEx currently running at a multiple of depreciation and amortization (lowering FCF Yield) and investment losses reducing EPS (raising the P/E).
In addition, neither P/E nor FCF Yield take into account the value of Alphabet’s “Other Bets,” reported as “non-marketable securities” with a value of $30.7bn at Q3 2022, or 2.4% of its market capitalization.
Alphabet does not pay a dividend, but has been repurchasing its shares. Buybacks have been progressively increasing, exceeding $57bn in the last 12 months, equivalent to 4.5% of the current market capitalization.
We continue to believe that Alphabet’s proven resilience (including during COVID-19) and its continuing double-digit EPS growth will justify a P/E of at least 35.0x. We believe Alphabet stock remains undervalued.
Conclusion: Is Alphabet A Buy?
We reiterate our Buy rating on Alphabet stock.
Be the first to comment