

Gold and Crude Oil Talking Points:
Gold prices were lower on Wednesday in Asia despite the previous session’s huge Wall Street losses, incurred in turn as US investors seemed finally to accept that the coronavirus’ spread will exert major economic drag. It seems the market expects risk appetite to rebound, with some impulse to take profit on gold’s impressive gains evident.
Still, regional stock markets were mostly lower, with the Nikkei plunging on return from Monday’s holiday. South Korea’s Kospi snapped back from its own virus-related losses. However, the revival of both US and European stock futures saw gold retreat from its session peaks, even though the market clearly remains well supported in this nervy environment.
Headlines permitting the market will look ahead to Tuesday’s US consumer confidence data. With China mired and Europe sluggish, the US consumer looms large as a possible growth driver. The index is expected to have ticked up modestly in February, to 132 from last month’s 131.6.
| Change in | Longs | Shorts | OI |
| Daily | -7% | -3% | -5% |
| Weekly | 1% | -2% | 0% |
Crude oil prices were higher, with the market steadying after Monday’s sharp falls. Investors remain weighed down by concerns that the coronavirus will see further falls in demand for an energy market already well supplied, with traditional producers apparently in no hurry to deepen or lengthen production cuts.
US oil inventory is expected to have risen for a fifth straight week according to a Reuters poll.
| Change in | Longs | Shorts | OI |
| Daily | 6% | -5% | 3% |
| Weekly | -15% | 0% | -12% |
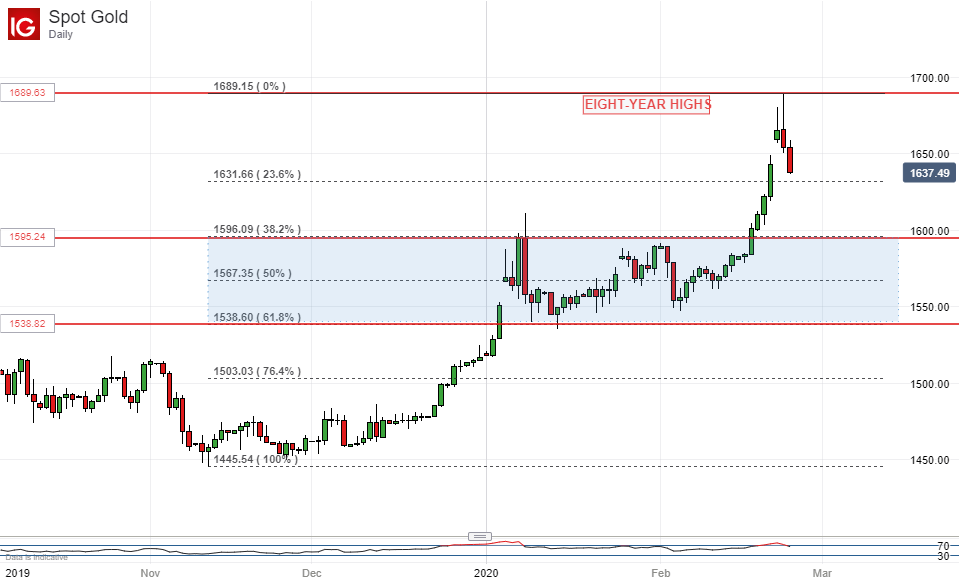
Gold Technical Analysis
Prices are heading back toward near-term support at $1631.66/ounce. That’s the first, 23.6% Fibonacci retracement of the rise from November’s lows up to this week’s top. However, the market has been climbing very steeply since mid-February, perhaps getting overextended in the process.
The market will probably still find clear support in the range between $1595.24 and $1538.82. That band was traded for much of 2020, before the more recent, sharper rises were seen. It also comes in between the second and fifth Fibonacci retracement of the rise. Given the fundamental picture it seems highly unlikely that gold will slide as far as that range base, but some consolidation in its upper reaches looks quite probable.
Crude Oil Technical Analysis
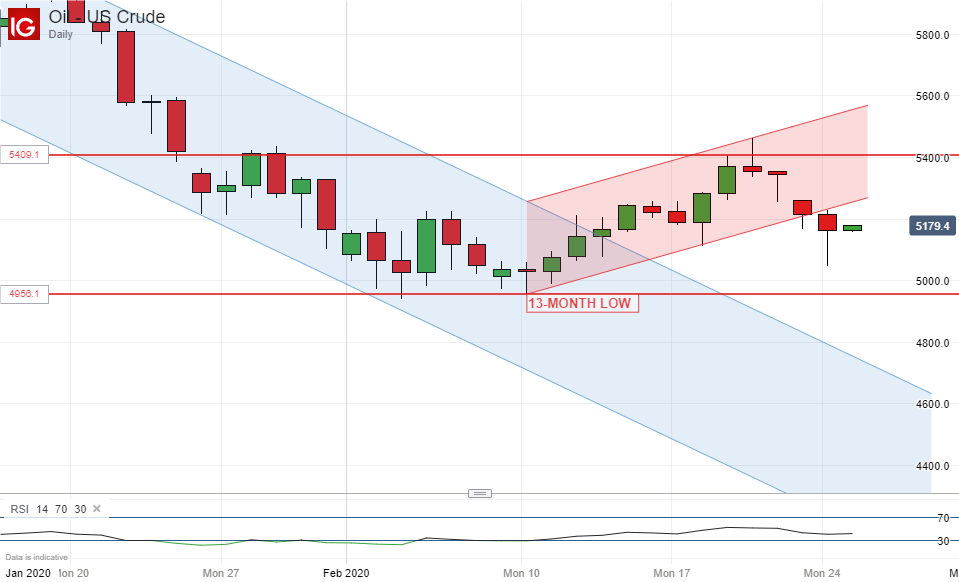
Prices seem to have topped out once again at January 28’s peak of $54.09/barrel, with the latest falls large enough to break late February’s uptrend channel to the downside. Support awaits at early-February’s notable low and is likely to beckon unless the bulls can gird themselves to sustainably top that key resistance point.
Commodity Trading Resources
— Written by David Cottle, DailyFX Research
Follow David on Twitter@DavidCottleFX or use the Comments section below to get in touch!
Be the first to comment