

GOLD ANALYSIS
- Fed Chair Powell speech later today.
- Inflation data could be the catalyst markets have been waiting for.
- Safe-haven stimulus may be growing.
- IG client sentiment backs move higher.
BULLION FUNDAMENTAL BACKDROP
Spot gold tracks higher this morning on the back of a softer dollar and a pullback in U.S. Treasury yields. Markets brace themselves for Fed Chair Powell’s re-nomination speech later today where he will surely take the full might of the senate around topics including inflation, labor market and the overblown balance sheet. The manner in which Mr. Powell responds to these questions could hint at the “hawkishness” of the Fed and consequently give markets some directional bias going forward. Balancing both a supportive growth environment while combating inflation is the crux of the matter ad near impossible but a line needs to be drawn at some point.
A more aggressive Fed may point to a stronger dollar and could hurt any gold upside as real yields should extend its recent upward trajectory – rising real yields traditionally reflect a negative correlation with bullion due to the increasing opportunity cost of holding gold (non-interest bearing asset).
TREASURY REAL YIELD CURVE RATES 5,10-YEAR:
Source: Nasdaq Data Link
Omicron is still very real across the globe despite the relatively mild symptoms associated with the new variant. Record numbers are being seen in many countries including the U.S. and may play into the hands of the precious metal and its safe-haven allure.
GOLD ECONOMIC CALENDAR
Barring Fed Chair Powell’s speech; tomorrow holds the weeks most anticipated economic data release, U.S. inflation for the December period. An estimate beat could increase markets rate hike expectations and cement the much talked about 4th rate hike for 2022. Again, this should weaken gold prices. The same is true for an inflation miss which could bring back the transitory rhetoric leaving the dollar open to a break lower from its recent range bound move.
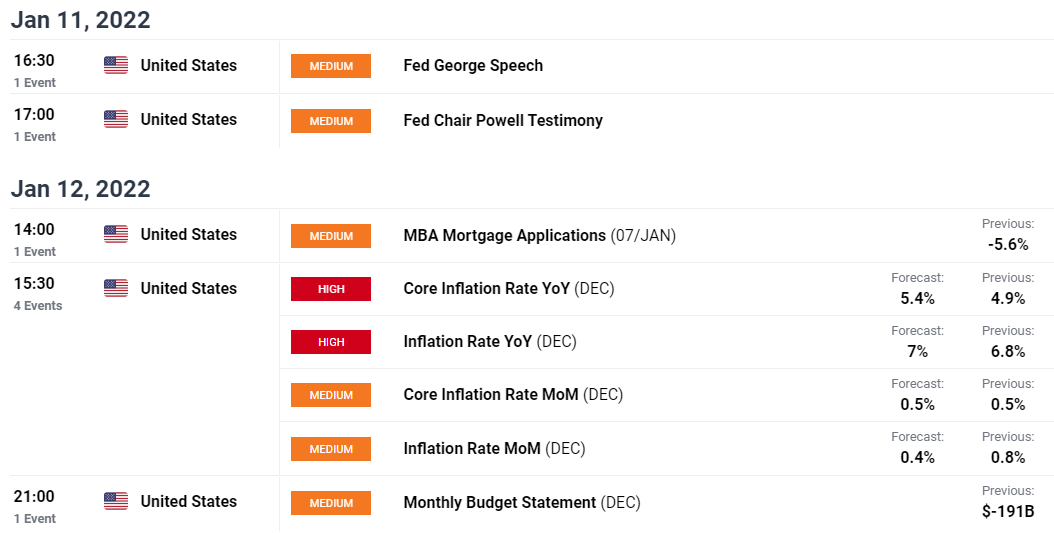
Source: DailyFX Economic Calendar
TECHNICAL ANALYSIS
GOLD PRICE DAILY CHART
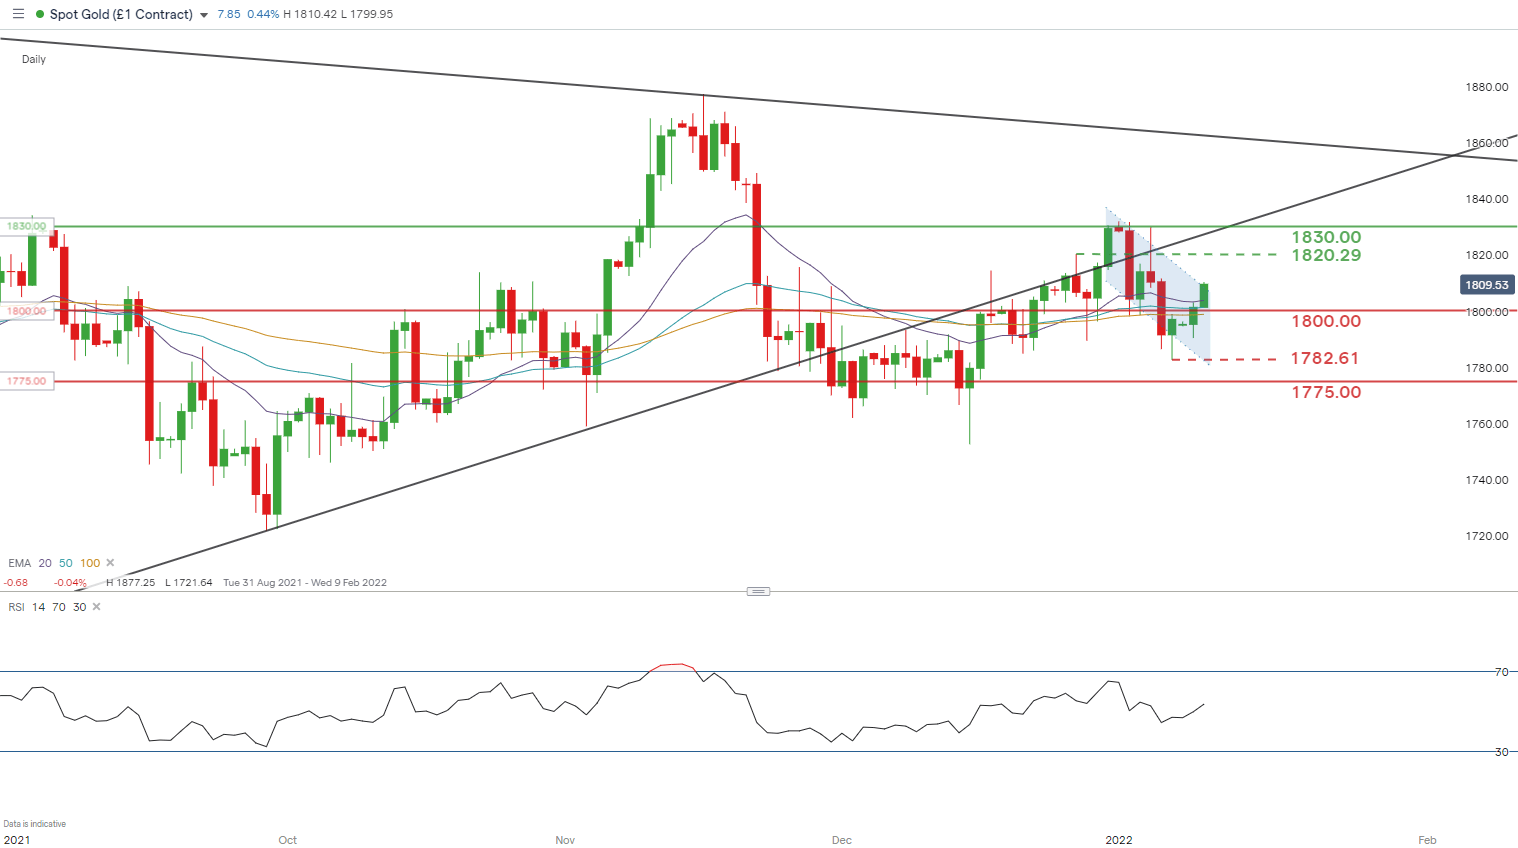
Chart prepared by Warren Venketas, IG
Gold price action reveals market indecision since late November 2021 as traders flirt with the 1800.00 psychological level. This week, gold bulls pushed above this key area of confluence while fundamentals take the reins. Both outcomes are on the cards for traders this week but technical chart patterns echo a bull flag breakout (blue) unfolding. A candle close above flag resistance could bring into consideration the December swing high at 1820.29.
Resistance levels:
Support levels:
IG CLIENT SENTIMENT BULLISH
IGCS shows retail traders are currently distinctly long on gold, with 71% of traders currently holding long positions (as of this writing). At DailyFX we typically take a contrarian view to crowd sentiment and the fact traders are net-long is suggestive of a short-term bearish inclination however, with the recent move out of longs relative to shorts means the current outlook favors gold upside.
Contact and follow Warren on Twitter: @WVenketas
Be the first to comment