The Norwegian-based Equinor ASA (NYSE:EQNR) reported its third quarter 2022 results on October 27, 2022.
Note: This article is an update of my article published on August 30, 2022. I have followed EQNR on Seeking Alpha since January 2017.
This article aims to have a detailed look at the company’s fundamental recent history, including the third-quarter earnings, and draw credible conclusions about what to expect in 2023 and how to navigate the industry successfully.
Indeed, 2022 was an exceptional year that generated a whopping trailing 12-month free cash flow of $30,847 million.
Still, this great accomplishment is somewhat weakening, and oil companies like EQNR will likely battle strong headwinds in 2023 with a possible painful recession and diminishing demand. However, one positive characteristic of EQNR is its powerful natural gas segment assuming solid prices, which starts to be doubtful for the next two years.
1 – 3Q22 result Snapshot and commentary
Equinor reported strong third-quarter results. Earnings easily beat analysts’ expectations. Equinor generated $4.53 billion in generic free cash flow this quarter, and revenues were $43.63 billion, nearly doubling the revenues of 3Q21 of $23.26 billion.
After posting significant revenues and cash flow, Equinor proposed a fourth tranche of the share buyback program of $1.83 billion.
Also, due to the increase in commodity prices and ongoing recovery, Equinor’s Board of Directors proposed a quarterly dividend of $0.20 per share and added an extra $0.70 per share in 3Q22 for a total of $0.90 per share.
I see our strategy as even more relevant now than before, and you should not expect any changes to the strategy as I am coming into this role. We will continue to drive value creation, which is always more important than volume targets. The numbers this quarter and for the coming quarters will be impacted by all the changes so closely. One factor we will monitor closely is the inflation and cost increases. This is a growing concern. We see bottlenecks and delays, lower efficiency and risk of a drop in quality in the global supply chain.
Equinor produced an 11% increase in Norwegian gas production in 3Q22 as part of its effort to help energy security in Europe. This significant production increase benefited EQNR, which sold its gas at a whopping $42.34 per million British thermal units. Unfortunately, natural gas prices dropped during 4Q22 and are still depressed now. I expect the fourth quarter results to be down sequentially.
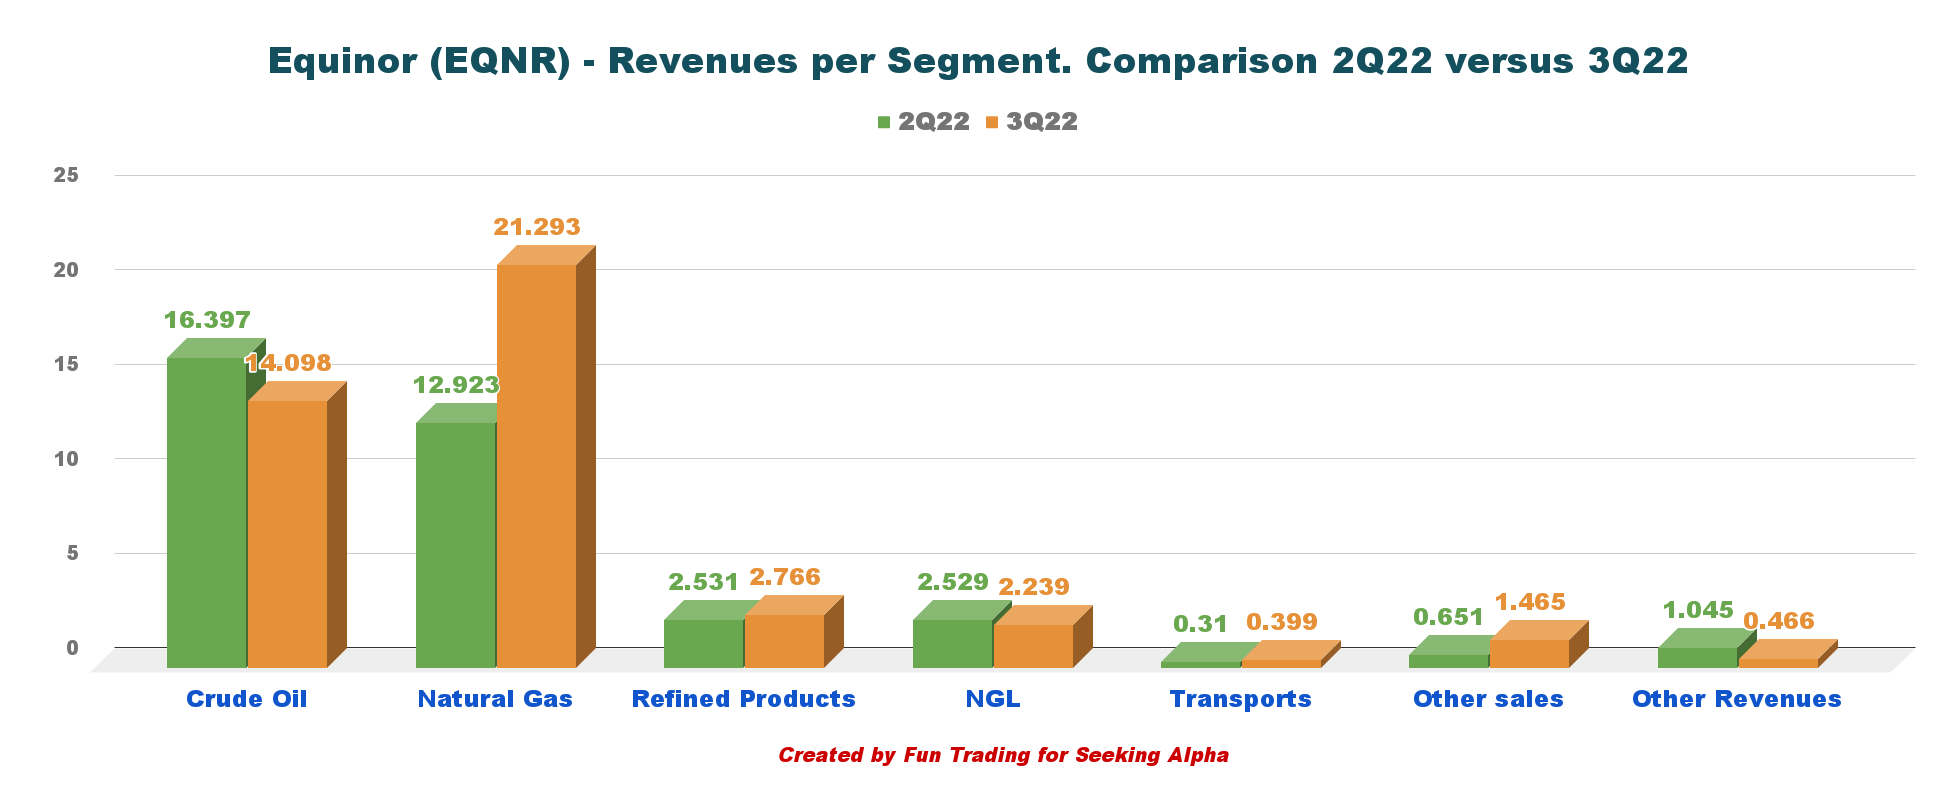
The integrated company is primarily an oil and gas producer with a robust crude oil segment, as we can see below:
EQNR Quarterly revenues per segment 2Q22 versus 3Q22 (Fun Trading)
Equinor is the perfect play in the natural gas segment due to its strategic location and the war in Ukraine, forcing the European countries to turn away from Russia’s natural gas and find alternatives. The company is well-positioned to profit from this situation. However, on the other hand, Equinor is vulnerable to natural gas weakness, as we have been experiencing recently. Hart Energy indicated recently that natural gas could slump through late 2024.
Natural gas production is primed to boom in 2023 and beyond, but prices will endure an extended rough patch, East Daley Analytics says in its annual Dirty Little Secrets forecast for energy markets and the midstream sector.
The oil and natural gas prices are now below from they were a year ago.
EQNR Brent and NG price one-year (Fun Trading StockCharts)
Also, European natural gas prices are at pre-Ukraine war levels of €74/MWh in mid-January, down nearly 50% from their December peak and a fifth of record levels set in August. The slide can be explained by warmer-than-expected temperatures reducing concerns over shortages and the need for gas rationing. Subsequently, record LNG imports and a rise in renewable capacity from wind power in Germany, coupled with lower consumption and energy-saving measures, enabled storage to stay full. Gas storages across Europe are 83.2% full as of January 7. This situation is not helping EQNR for the next two quarters.
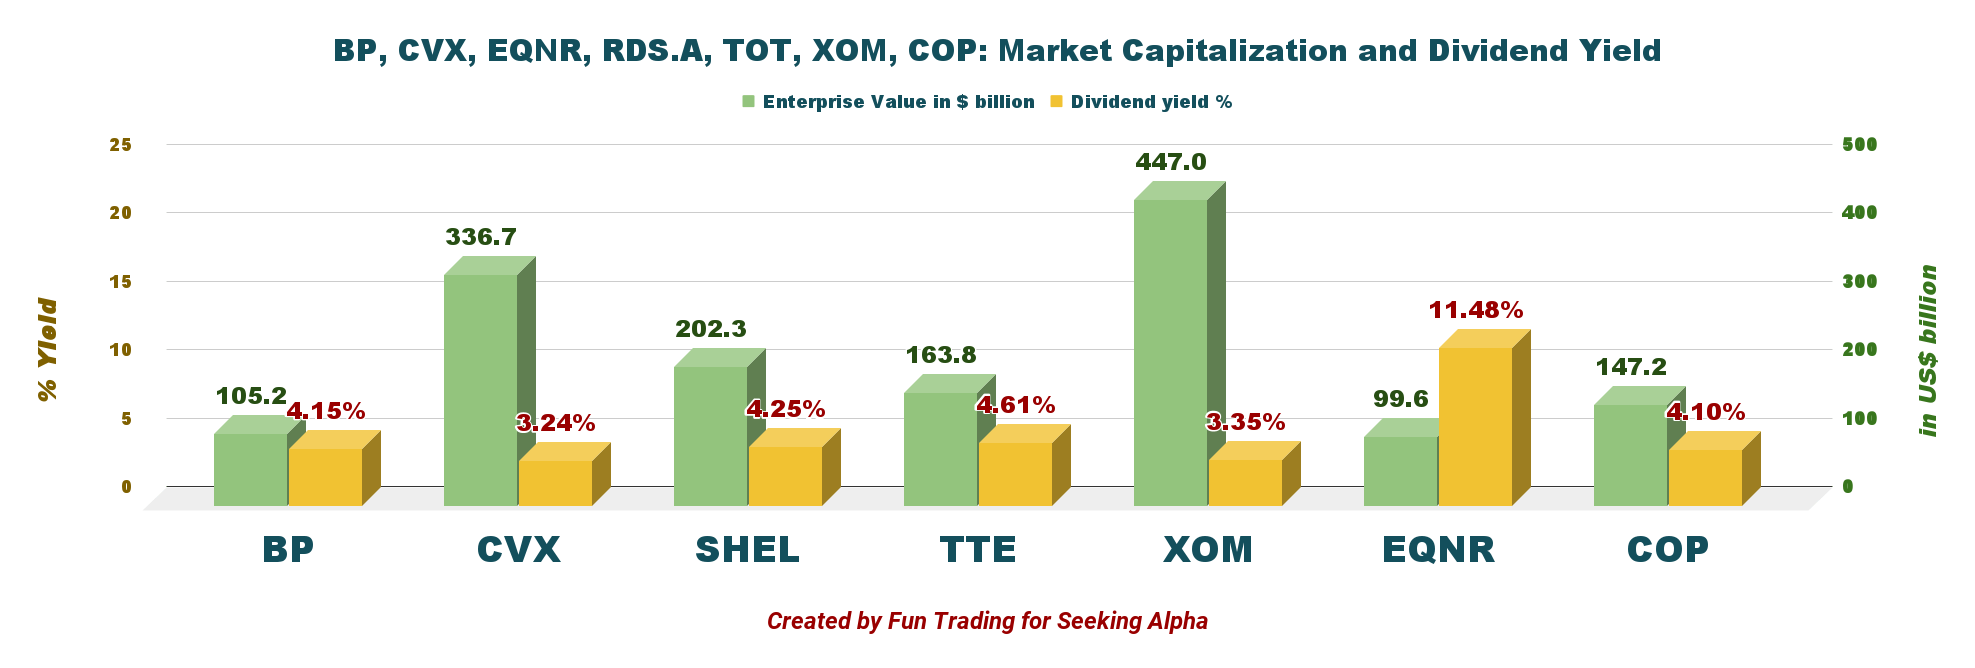
2 – EQNR compared to its peers
Equinor is one of the smallest in market cap amongst its peers and pays a solid dividend with a Foreign withholding tax of 25%, altering its attractiveness for dividend-oriented investors. However, with the extra $0.70 per share for 3Q22, the dividend yield is now 11.5%. However, the extra dividend will undoubtedly be cut in 4Q22.
EQNR Dividend comparison (Fun Trading)
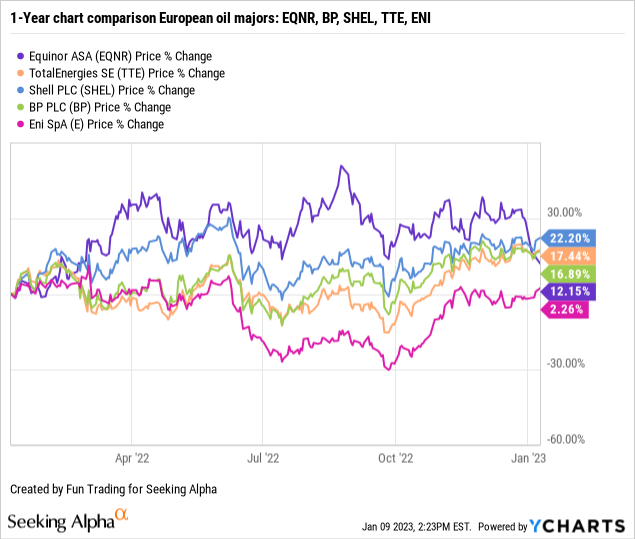
3 – Stock Performance
EQNR’s long-term performance shows that EQNR has underperformed its peers besides ENI, with a 12% increase on a one-year basis.
Note: Cash dividend of $0.20 and increased extraordinary cash dividend to $0.70 per share for the third quarter of 2022 and a fourth share buyback tranche of $1.83 billion
Financials: Revenues, Free Cash Flow, Debt, And Production
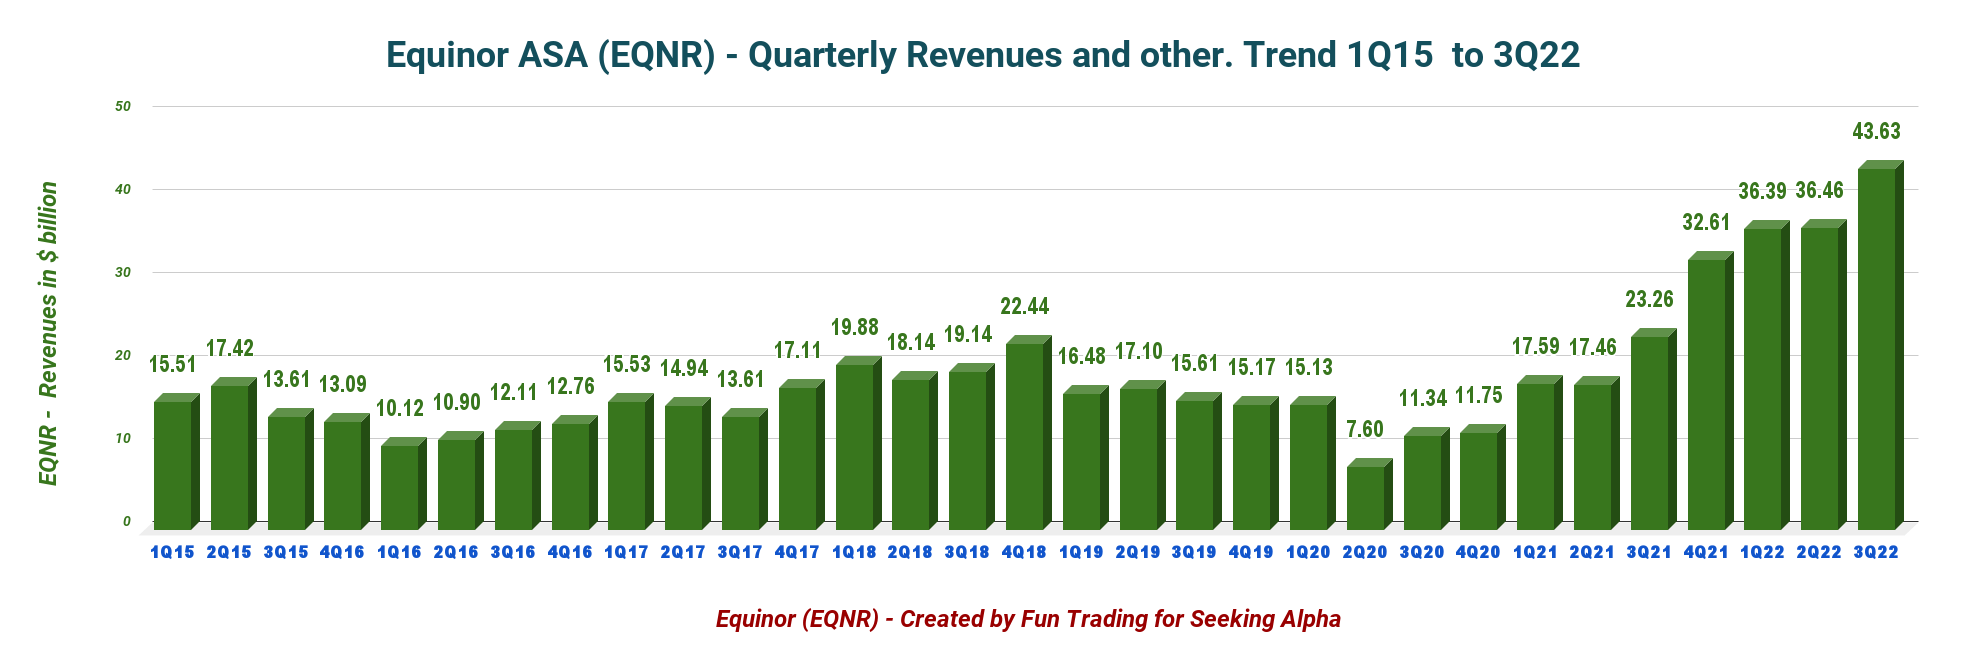
1 – Historical Revenues and others were $43.63 billion up until 3Q22
EQNR Quarterly revenue history (Fun Trading)
Revenues and others were $43.633 billion, up from $23.264 billion in the same quarter a year ago and up 19.7% sequentially (please look at the graph above). The strong quarterly results were due to higher commodity prices. However, as I said earlier, the 4Q22 will be down significantly.
Net income was $9,384 million, or $2.97 per diluted share, up from $0.43 per diluted share in the same quarter last year. The company said in the press release:
The realisation of significantly higher gas prices and elevated crude prices, coupled with high production levels, resulted in the increase in net operating income and adjusted earnings
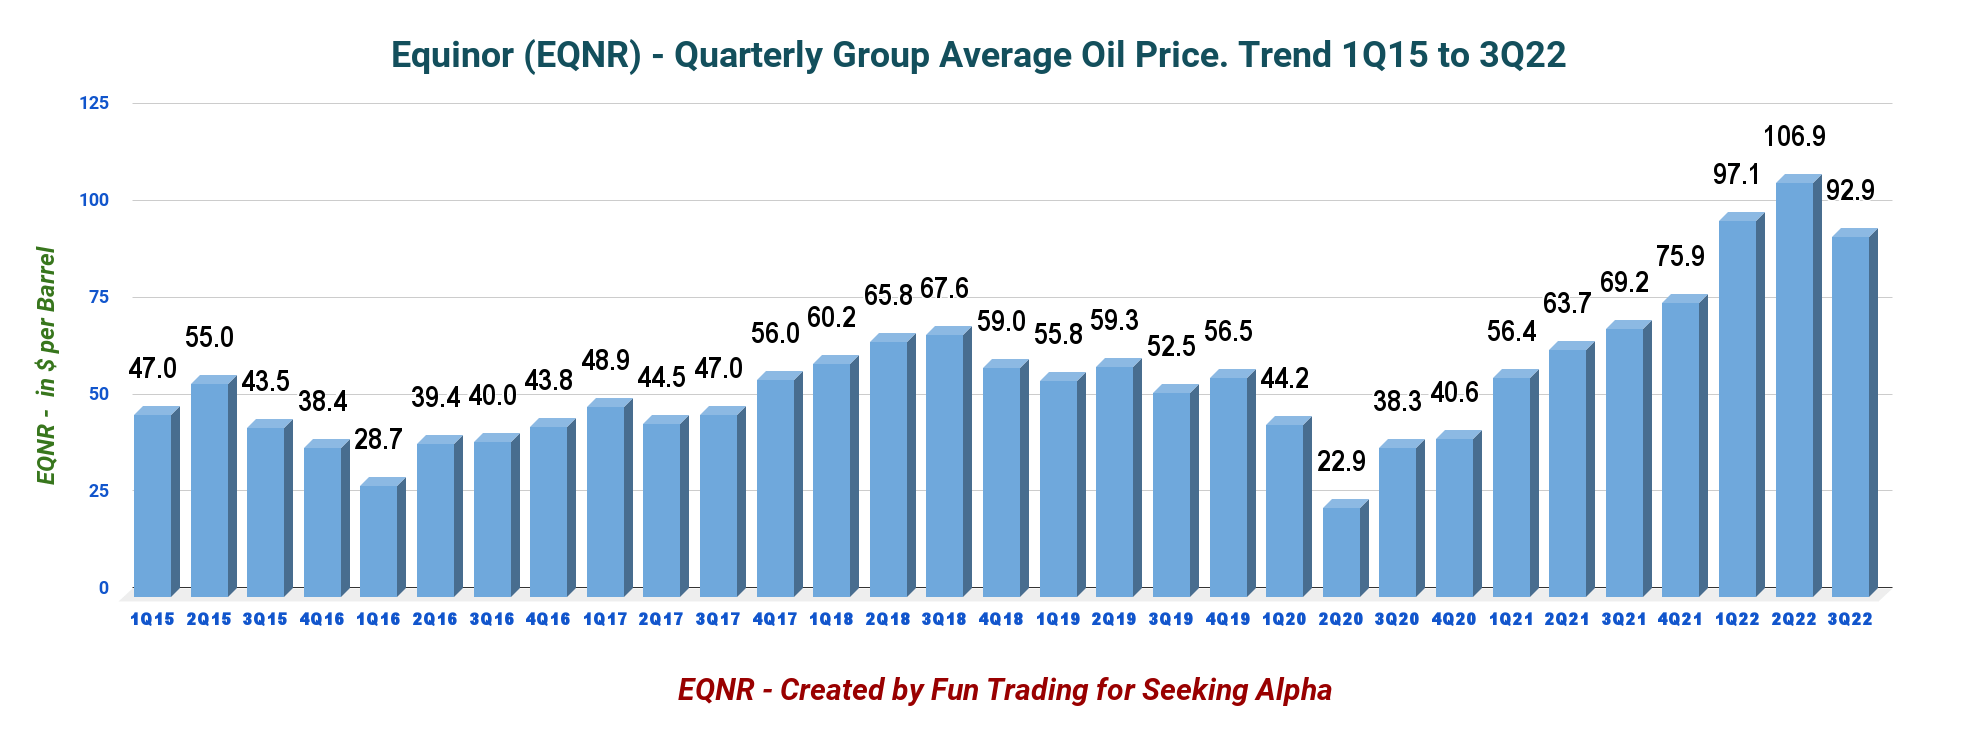
The average European invoiced gas price in the third quarter was $42.34 per million Btu for Europe ($13.91 last year) and $7.01 for North America. The group average oil price was $92.9 per Boe. It was a massive improvement from a year ago.
EQNR Quarterly Oil price history (Fun Trading)
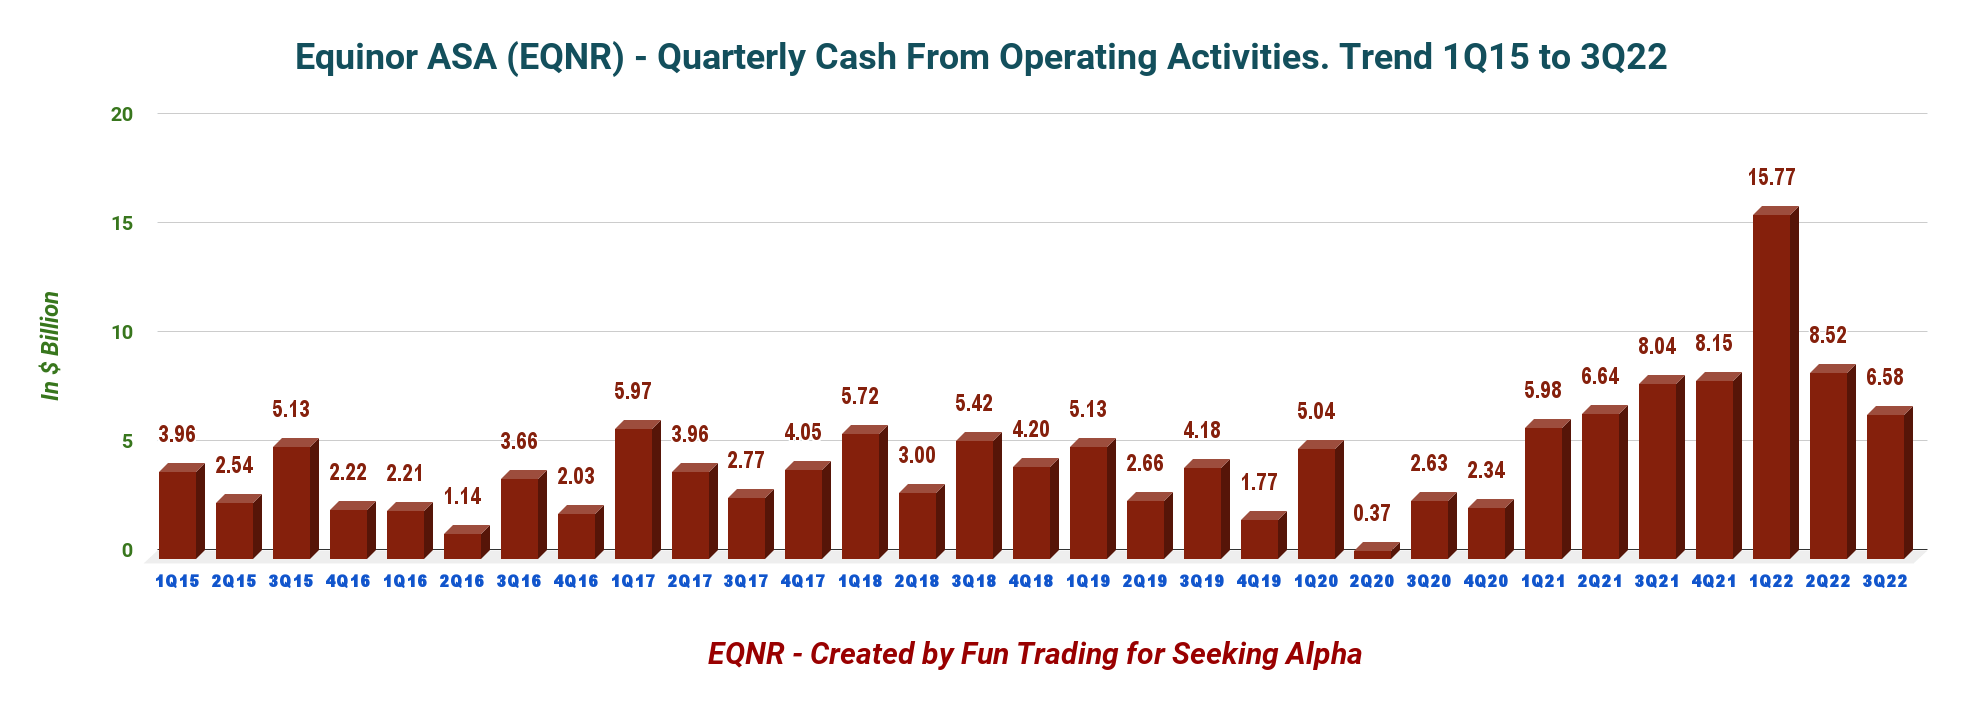
1.7 – Cash from operating activities was $6.578 billion in 3Q22.
EQNR Quarterly cash flow from operations history (Fun Trading)
2 – 2022 Guidance and Outlook (Unchanged sequentially)
Organic CapEx is estimated at around $8.5 billion for 2022, an annual average of around $10 billion for 2022-2023, and a yearly average of about $12 billion for 2024-2025.
Production for 2022 is still estimated to be around 1% above the 2021 level.
Equinor’s goal is to keep the unit of production cost in the top quartile of its peer group.
Scheduled maintenance activity is estimated to reduce equity production by around 40 Mboep/d for 2022.
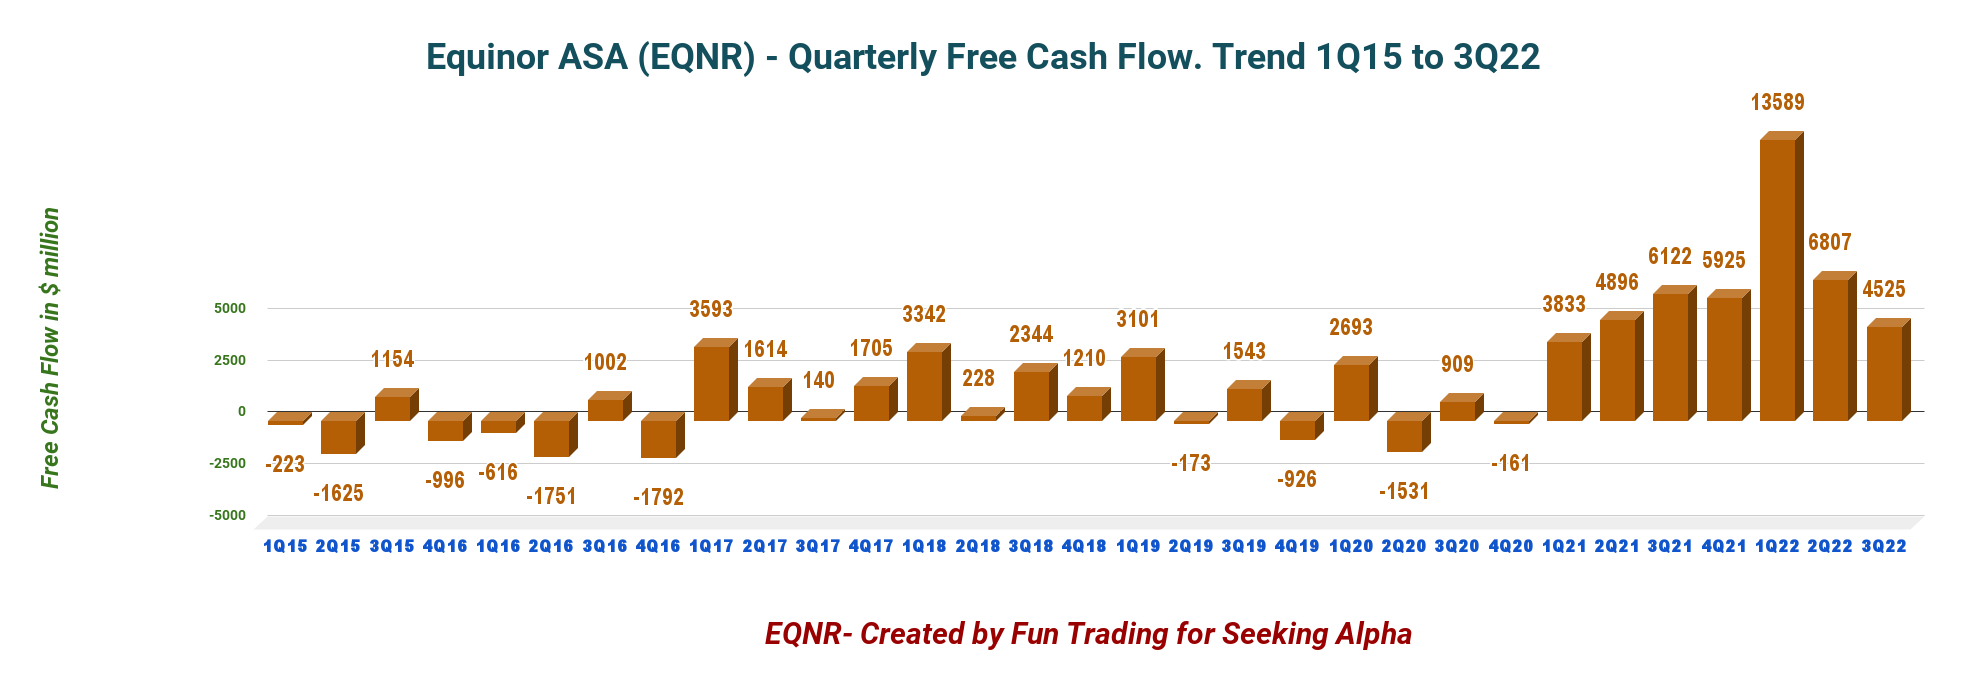
3 – Free Cash Flow was $4,525 million in 3Q22
EQNR Quarterly Free cash flow history (Fun Trading)
Note: I use the generic free cash flow, not including divestitures. It is the cash flow from operations minus CapEx. The company has a different way of calculating the free cash flow.
The company’s free cash flow was $4,525 million in the third quarter of 2022, with a trailing 12-month free cash flow of $30,847 million.
Equinor announced a quarterly dividend of $0.20 per share, unchanged from 2Q22. Also, its board declared a special quarterly cash dividend of $0.70 per share for the third quarter of 2022.
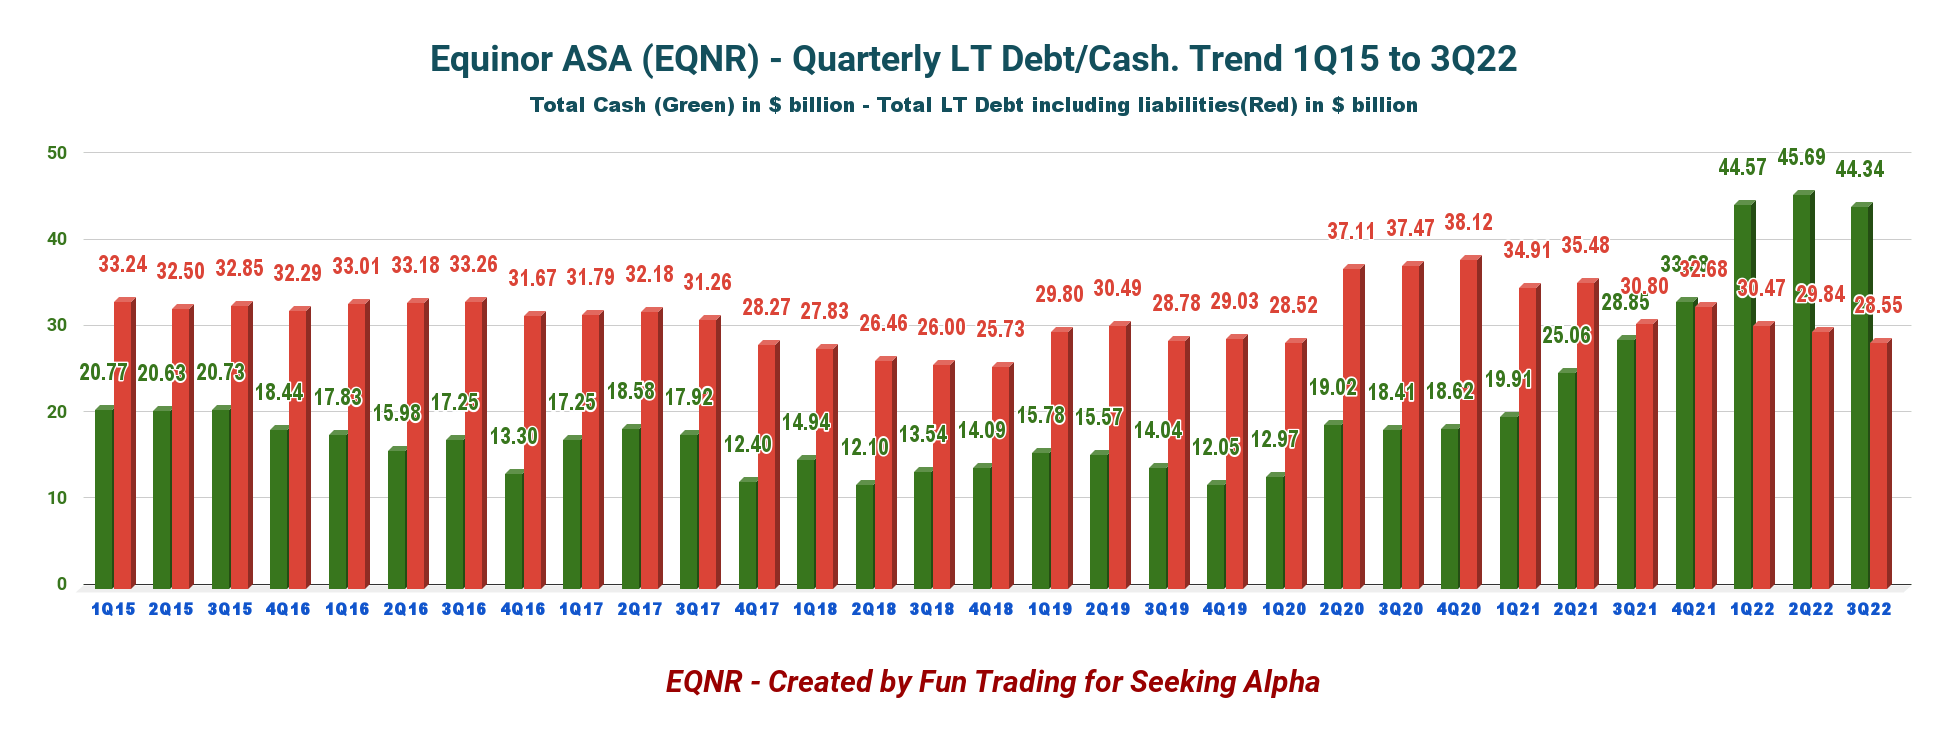
4 – No Net Debt in 3Q22. Excellent profile.
EQNR Quarterly Debt versus Cash history (Fun Trading)
Note: The debt indicated above in the graph is the gross interest-bearing debt plus liabilities.
As of September 30, 2022, Equinor reported $44.343 billion in cash, cash equivalents, and securities. The company’s long-term debt amounted to $28.545 billion at the quarter-end. The company has no net debt.
5 – Production Upstream and Investment in Renewables
5.1 – Oil Equivalent Production
EQNR Quarterly oil equivalent production history (Fun Trading)
The third quarter production was 2,021K Boep/d, up from 1,996K Boep/d in the same period in 2021 and up sequentially. Gas production was 1,009 Boep/d or about 50% of the total output.
Equinor share for power generation was 294 GWh this quarter, down from 304 GWh last year.
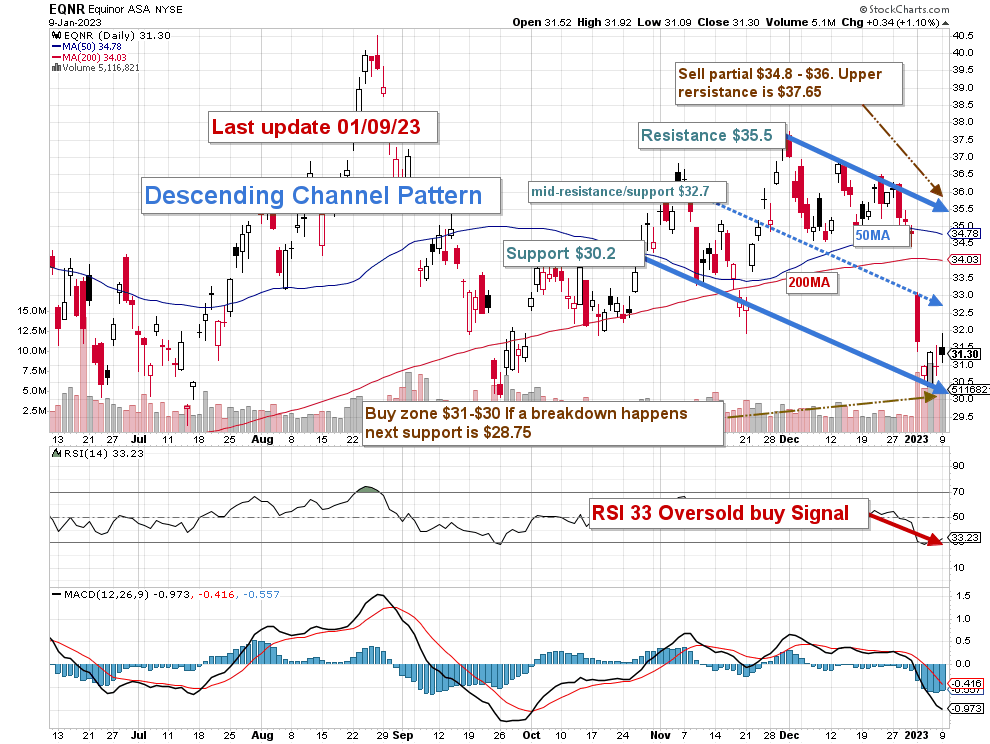
Technical Analysis And Commentary
EQNR TA Chart short-term (Fun Trading StockCharts)
Note: The chart is adjusted for the dividend.
EQNR forms a descending channel pattern with resistance at $35.5 and support at $30.2.
The overall strategy that I usually promote in my marketplace, “The Gold and Oil Corner,” is to keep a core long-term position and use about 35%-40% to trade LIFO while waiting for a higher final price target to sell your core position.
The trading strategy is to sell about 35% or more at between $34.8 and $36 with possible higher resistance at $37.65 and accumulate between $31 and $30 with possible lower support at $28.75.
EQNR is highly correlated to oil and gas prices, and your selling or buying decision must factor in these critical components. EQNR experienced a steep downside in early January due to lower natural gas prices.
Wholesale European gas prices, as measured by the benchmark Dutch futures contract, have dropped almost 48% since mid-December to trade at €71 ($74) per megawatt hour on Friday — roughly where they stood on February 15 last year, a little over a week before Moscow’s unprovoked assault on its neighbor. Prices are now nearly 80% below their all-time August high of €346 ($364) per megawatt hour.
I believe long-term investors should use weaknesses to accumulate this company long-term.
Warning: The TA chart must be updated frequently to be relevant. It is what I am doing in my stock tracker. The chart above has a possible validity of about a week. Remember, the TA chart is a tool only to help you adopt the right strategy. It is not a way to foresee the future. No one and nothing can.
Author’s note: If you find value in this article and would like to encourage such continued efforts, please click the “Like” button below to vote for support. Thanks.
Please note that foreign exchange and other leveraged trading involves significant risk of loss. It is not suitable for all investors and you should make sure you understand the risks involved, seeking independent advice if necessary.


Be the first to comment