

claffra/iStock via Getty Images
Introduction
Gold (XAUUSD:CUR) has been seen as a monetary commodity from the start of civilization. Gold is said to be many things: it’s a shiny metal that has historical monetary value and is consistently said to be an inflation hedge and/or crisis hedge against the monetary system we’ve set up. Gold works well as a portfolio diversifier and adds skew, with its historically low correlation to bonds and equities, a relatively small allocation may reduce your portfolio’s risk characteristics.
Gold performs well when monetary policy is loose, there are significant exogenous events that force assets to reprice risk (e.g. war and political instability) and inflation. The current environment we have in the next 3-6 months is very tight, uncertainty is significant and inflation may or may not be transitory.
While many are holding gold for good reasons, some are pure gold bugs that think that gold is the only real investment. I believe, there is an interesting opportunity in the options space for gold, through puts on SPDR Gold Trust (NYSEARCA:GLD) and other ETFs or Gold futures. In my opinion, there is a sufficiently high likelihood (30-40%) that gold might decline in value significantly (15-25% drop) in the next 3-6 months. Gold also has a lower likelihood (10-20%) of crashing upwards (50-100%). This is from a mix of the monetary policy outlook, historical comparisons and asset price correlations. If my outlook is correct to a certain degree, then put options for gold might be very underpriced and are not pricing in a ‘crash down’ risk for gold.
How gold acts during different time periods: Reaction to SPX moves and correlation to real rates
Figure 1 Top shows the log base 2 of gold price (every 1 value move represents either a 100% move up or a 50% move down in price) vs Z-Score of the ratio of SPX/Gold which tells us about the mean reverting nature of gold and S&P500 price. Figure 1 Bottom shows the impact of real rates (orange, inverted axis) on gold price. We can see that gold tends to significantly go up during periods when real rates are negative. While in the long term this suggests gold may have a long ways to go upwards. We can see that when real rates trend downwards or shows potential signs of peaking, gold reacts violently, frequently declining 15-35% within 6-12 months. (Author)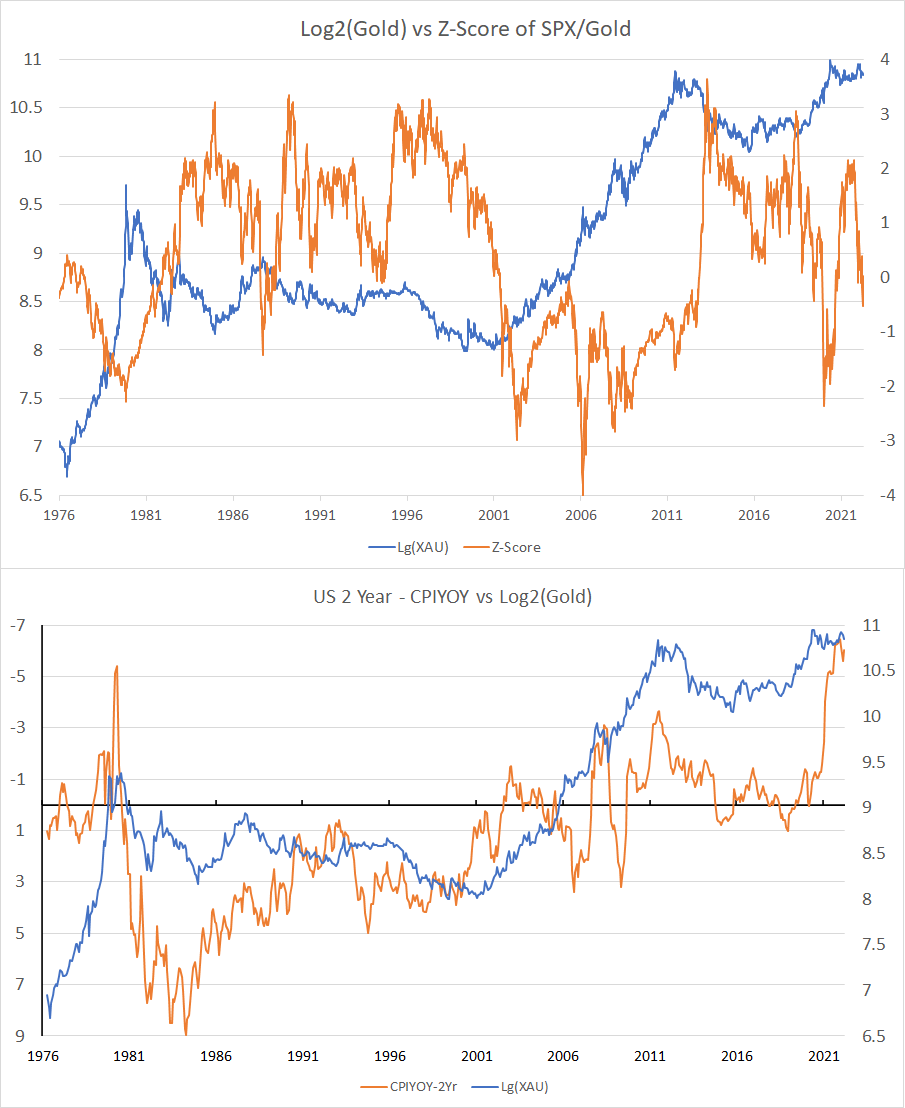
Historically, gold has moved up from risk-off events, geopolitical crises, and times when our monetary system was thrown into question. Gold is, in a sense, a crisis hedge. Gold price action responds positively to times when people notice fat tails exist and may come to negatively affect their portfolios. In figure 1, we can observe that, historically, gold and SPX momentum diverges significantly (up or down), it usually ends up mean reverting. This suggests that when stocks go down, gold is sold in portfolios to buy stocks at a discount leading to the price going down.
I would also argue, that if we look at gold from a monetary angle, then we could just value gold against inflation and terminal rates to determine short-term moves. Figure 1 shows that when inflation peaks and terminal rate expectations (2-Year as proxy) start to go up so the Fed can achieve its 2% inflation target, gold almost always reacts very negatively in % terms, losing 30-60% of its value in the following years.
The next 3-12 months: Binary Choices, likely only one outcome
Figure 2 shows gold price action (log base 2, weeks from date stated) during the financial crisis overlayed to right now. We can see that when the coast seemed clear (right before more cracks start to show up), gold has a tendency to crash. (Author)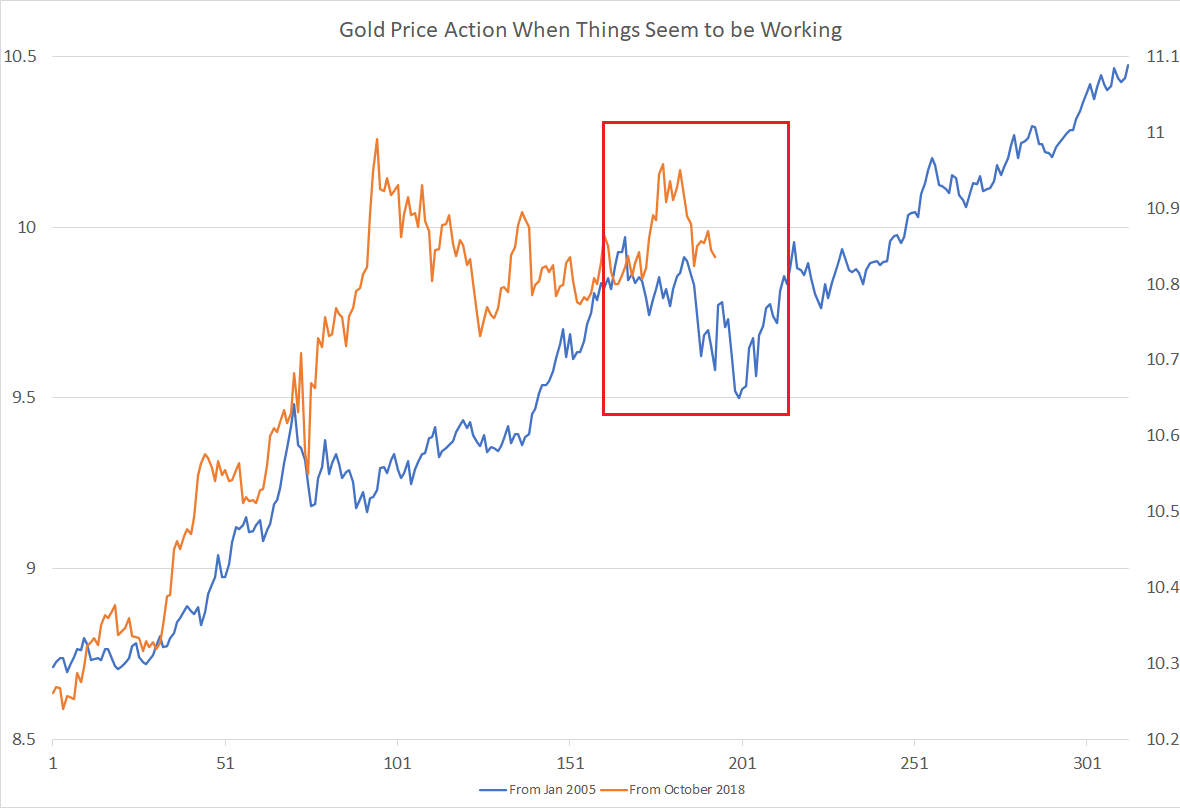
In my opinion, at least temporarily, in the next 3-12 months, markets might start to price in the Fed accomplishing what macro investors have been saying is impossible, that they’ve tamed inflation. This could be due to forward inventory purchases and an obvious result of retailers stocking up too much stuff, in the short term, we might see slower inflation. Another could be due to the Fed and gas prices really starting to ruin consumer confidence enough to stop spending and tighten household budgets. Consumer credit is rapidly growing after prices failed to trend downwards since early this year and may just contribute to household budgets tightening and reducing spending.
If inflation starts to trend downwards, then it would appear the Fed has accomplished their job and will continue to keep policy rates tight until the US reaches 2% inflation. They will likely be fine with it undershooting it given inflation had overshot significantly. This would mean that the Fed has regained credibility and gold prices might react negatively in the medium term. If inflation keeps trending upwards, then the Fed will hike even more, which would spur recession risks, which are historically linked to negative gold price action. In my opinion, this is another “heads I win, tails you lose” scenario. I don’t believe markets will look over this if we just look at history and how gold price action reacts to Fed moves.
I believe we’re in a situation in figure 2, where things are looking like the Fed has things under control. Interest rates and equity volatility are trending downwards, the dollar is weakening from risk-on inflows (current moves appear to be temporary, but these things move in short-term cycles, we might see oil easing in price). If this is the path that we will take in the next few months, and the Fed responds as I’ve laid out above, then gold may have a significant short-term downside, likely 15-30% in 3-6 months.
Ignore the noise. Remember history and what happened in the last crisis(es)
Looking back at figure 1, it’s always important to remind ourselves of the different bull runs gold has had and what those periods were defined by:
- 1970-1980s Gold de-pegged from the USD and other major currencies. This was a time of high inflation, a wage spiral and a government that can’t stop spending. This was the largest bull run for gold, full stop. Real Rates (measured by 2 years – CPI year over year) were deeply negative.
- 2000-2010 Fresh off the Asian and Russian crises and a stock market crash, the Fed was trying to spur inflation by keeping real rates lower. Gold prices started rising during this time, the housing bubble was inflating and gold accelerated further when the Fed pushed real rates more negative. Gold prices overshot this correlation between real rates due to the market pricing in a financial crisis. However, when QE and the US government managed to save the situation (or delay according to some people), gold rapidly retreated.
- 2019-now Real rates were negative starting from the Fed trying to prevent contagion from the REPO crisis and went even further on during the start of the COVID-19 pandemic. However once the situation stabilized, what we saw was a deflationary environment and gold proceeded to rapidly decline significantly in % terms and now is trading in a stable range of 1700-2100.
Where are we now? Well, now that the Fed is rapidly hiking rates and saying that cooling down inflation is ‘unconditional’ (read as I don’t care about your asset prices). Due to this, I believe gold looks a lot more vulnerable to a short-term rapid decline in value against the USD.
The TIPS Market is expecting long-term normalisation of inflation
Figure 3 Top shows an overlayed chart of Gold and TIPS ETF, the market is now pricing in sharply less, but still high, inflation and historically this has led to gold underperforming in line with the fund price. Figure 3 bottom shows a regression of this weekly chart and shows a strong relationship, which was used to extrapolate a gold price if relative value of gold to TIPS remains relevant. (Author)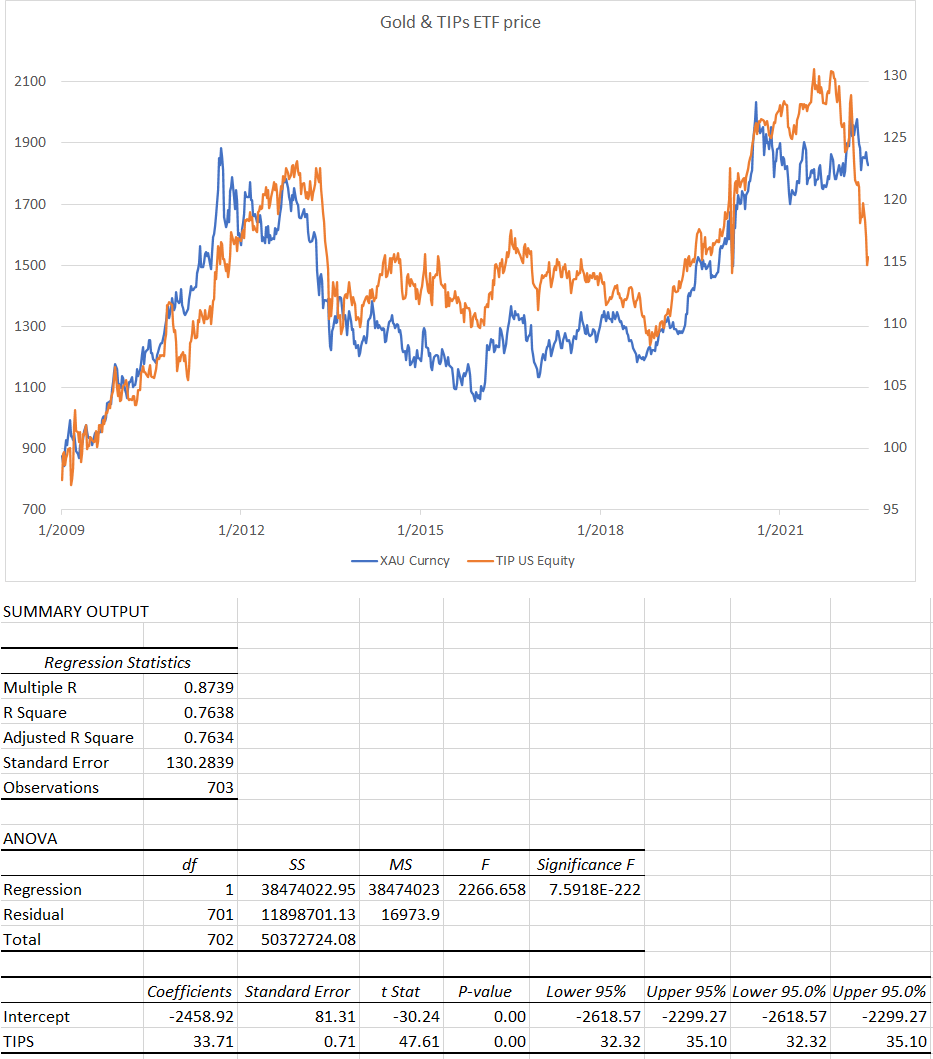
Treasury Inflation-Protected Securities were invented by the Fed to address the fact that we needed a ‘market’ based expectation mechanism for future inflation. Many other countries now have their own sovereign securities that have various mechanics to protect investors from the effects of inflation more directly. In the US, the US TIPS work by increasing/decreasing the value of the principal along with the headline CPI Index. If inflation were to increase by 8% from today to next year, the value of your bond would be 8% higher than it was. In addition, TIPS tend to also have a fixed coupon.
The advantage of TIPS is that it allows market participants to ‘price in’ inflation. This means that bonds of TIPS often have negative yields on the fixed coupon. This negative yield, back-calculated, then informs us of what the market thinks inflation is going to be through the prices. For example, if a zero coupon TIPS bond is maturing next year at -4% yield, this means that inflation is expected to be 3% assuming the risk-free yield is 1%.
Recently we’ve seen headline inflation rise to the highest ever in 40 years blamed on supply chain constraints and a too-loose Fed. I believe that at least while the Fed is front loading rate hikes aggressively, the market pricing for inflation will continue to trend downwards and if inflation were to tick lower (as it could very well do the next few quarters), gold may crash in the short term. Figure 3 shows that since 2009, TIPS and gold have traded in a very tight band.
I believe this is because markets are pricing gold as an inflation hedge. Now, looking at figure 3 again, we already see iShares TIPS Bond ETF (TIP) trading significantly downwards as long-term inflation breakevens (over 5 years) have declined significantly since March of this year completely going the opposite way of crude oil. If we use the regression outputs, given that TIP is trading at 115, gold could be trading at 1,420 ± 130, giving a downside to gold at 15-30%.
Gold Miners have led gold and they’re showing signs again that gold may underperform
Figure 4 shows the 3 periods where gold miners either underperformed together or were leading indicators of gold underperforming in price. (Author)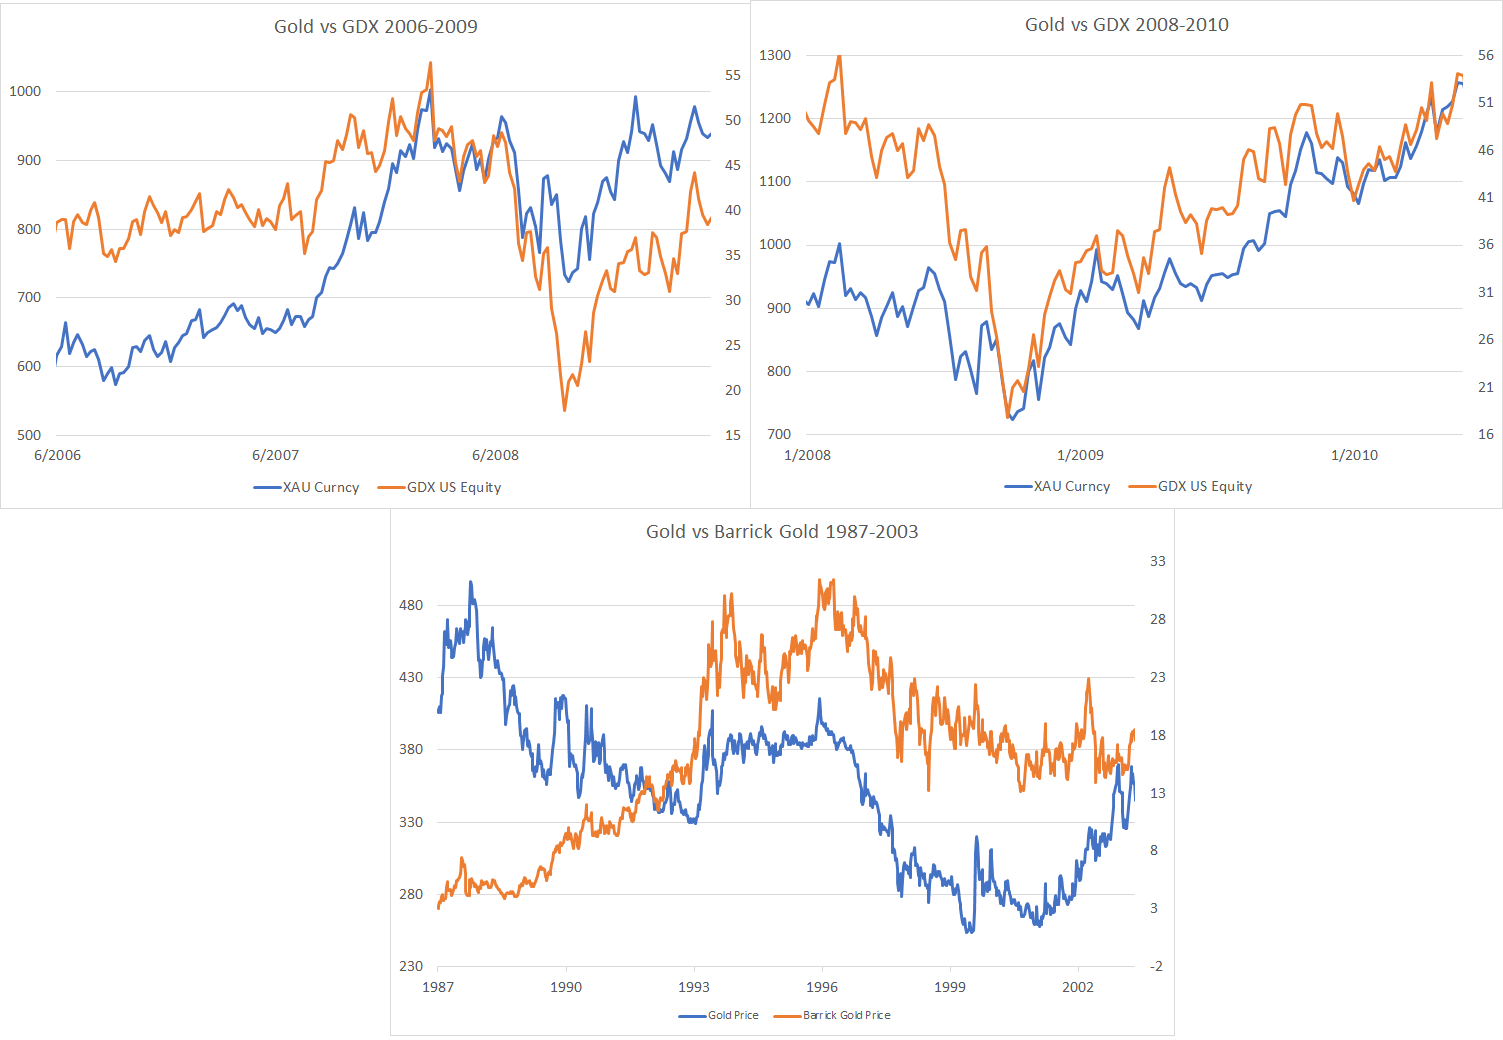
Gold Miners are normally a great way to gain exposure to Gold during a gold bull run. Historically, gold miners have had a high correlation to gold long term and a regression shows that for every 1% move on gold, gold miners generally move 1.6-1.8%. The alpha is negative, which shows that gold miners can be thought of as a levered gold position, at least if you look at it naively.
Gold miners are interesting since you could value them by discounting the future profits of the gold miners. This means that the future expectations of gold miners will be much higher than the breakeven price for the gold miners. Then, it stands to reason that gold miners may indicate the future direction for gold since future profits of gold mining companies rely on gold prices being higher than their breakeven mining price. Since the breakeven prices for gold mining are much more likely to go up than down in the future, then gold mining stocks should also be more sensitive to gold price. Gold also does not have significant industrial uses and relies mostly on retail demand (e.g. China & India), sovereign demand, and speculative demand.
Is there evidence of what I suggested? Figure 4 shows a VanEck Gold Miners ETF and Barrick Gold (GOLD) in different periods going down in price first or coincident to gold, and I’ve only picked very strong declines. These drops are significant (30-50%) peak to through. While it would be premature to say if this will occur within 3-6 months since there are significant macro headwinds: high inflation, recession, the prospect of more wars, and global famine to put a few out there. However, I do believe in a relatively short period of time, we may see gold react negatively to a very aggressive Fed and this might lead to a significant downside for gold.
Gold Beta currencies have shown that what matters now is rate differentials
Figure 5 shows a composite currency (Swiss Franc and Japanese Yen) against gold. It shows that the currency has tended to trade very closely with each other until the monetary policy of Japan and Switzerland started to shift (they remained in a low-rate environment while the US had periods of rising rates). It shows that there is a significant divergence and a recent rapid decline in the gold beta currencies. This might be a leading indicator to gold underperformance in price in the near term. (Author)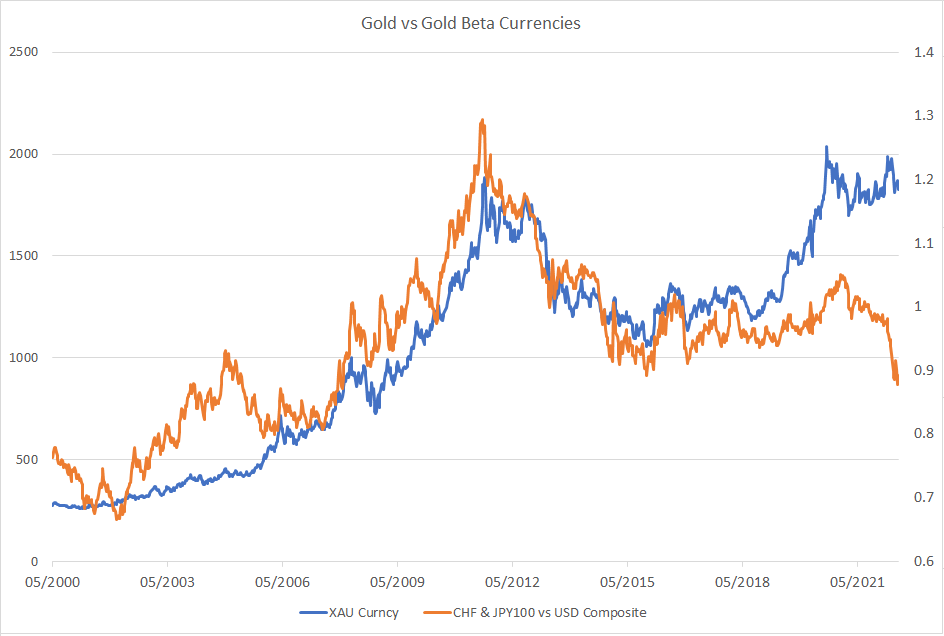
Gold is a non-interest-bearing asset. Historically we’ve seen gold moving with risk-off currencies like JPY and CHF. The correlation is very high most of the time. Now that JPY and CHF are rapidly losing value due to interest rate differentials. We’re seeing the difference between gold and those currencies widening significantly, which may indicate that either JPY or CHF may rapidly appreciate in value or gold may depreciate significantly. With rate differentials very high and the Japanese and Swiss economies. From US rates alone, Gold might significantly weaken when compared to the gold beta currencies.
Portfolio dynamics suggest that gold may reflexively go down with other assets from rebalancing and hedging flows
This portion consists of two observations of market dynamics. Central banks and physical gold buyers tend to be the “put money under my bed” types of players. They are passive holders and do not meaningfully contribute to price action quarter over quarter. Most portfolio managers and retail investors use gold as a moderately low allocation (5-15%) to hedge their portfolios since it’s relatively uncorrelated to many common asset classes, has low carry cost, and is ubiquitous.
The issue with this is that in the short-medium term when the large portion of the portfolios (bonds & stocks) significantly decrease in value (like right now), gold theoretically has been sold to buy depreciated bonds and stocks at discounts, if things start to turn up (i.e. Fed pivots). Since central banks and physical buying don’t significantly impact the derivative and spot market. Then ETF holders and derivative holders would have to sell at a time when people may not be able to buy it in size, if you want a deeper dive into this, you can listen to Mike Green explaining it.
More evidence of this is found within the disparity between the put/call open interest in gold. Calls are definitely more popular than puts, from a dealer hedging their short call positions, this means that they’re delta hedging the upside by being long gold. The issue is when there is a downturn, it tends to feed onto itself since dealers won’t need to hedge it as much and will dump their long gold positions. This may lead to correlations going positive, if geopolitical tensions and the terminal rate outlook look like they’ll ease, even temporarily.
This is a short-term call
Figure 6 shows a chart of weekly GLD price action. I illustrate potential downside price targets on the event of a rapid decline in price. (Trading View, Author)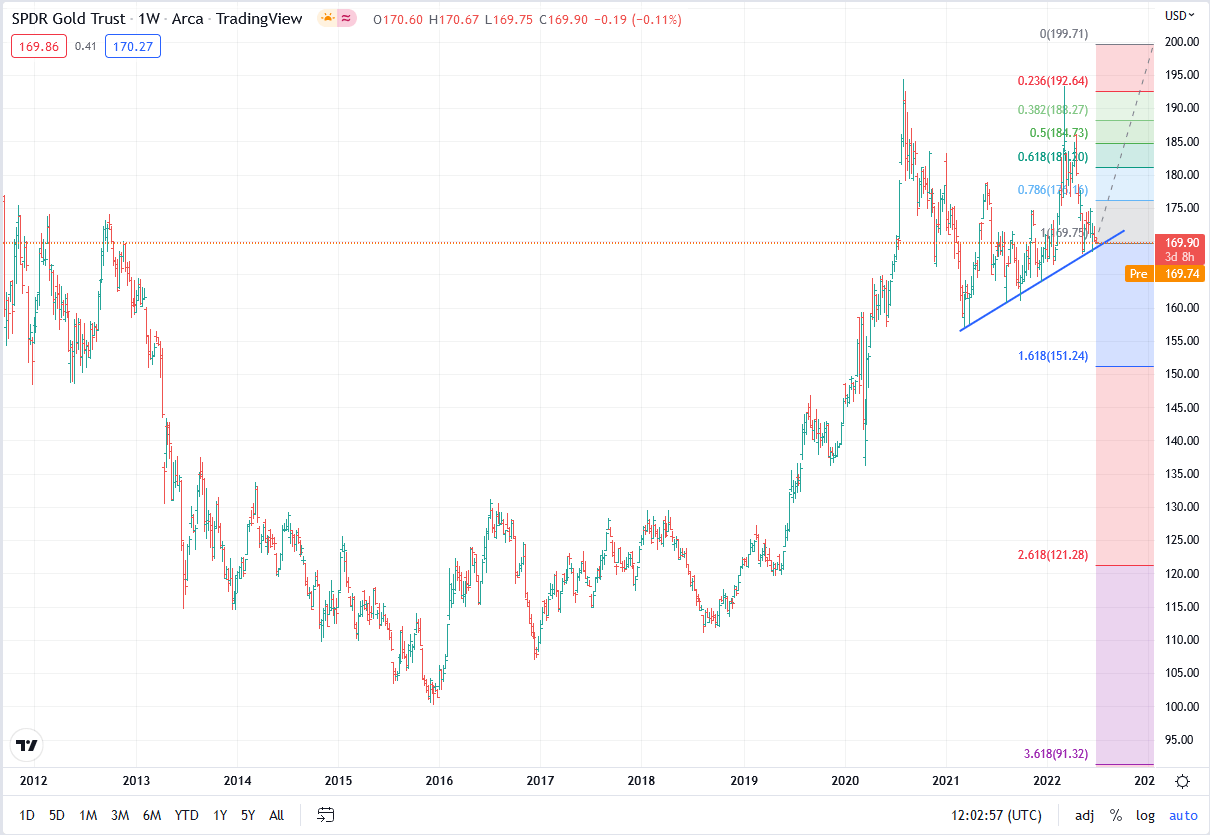
I have to say that this is not a call for long-term holders of gold for portfolio diversification reasons to start trading gold short-term. I have a lot of positions that give me a lot of exposure to inflation being persistent and above 3% in the next 2-5 years. This writing is for those who want a hedge against the Fed potentially getting it right (at least in the next 3-6 months) and suppressing inflation a lot faster than what market participants expect, which would be strongly negative for gold. Since the potential for a crash-up scenario is still on the table for gold, being short gold is not advisable in my opinion. However, with the potential for gold to crash downwards, LEAP out of the money puts look very attractive.
What’s the trade?
I definitely don’t recommend shorting gold. The expected returns just aren’t good enough knowing the risks. If Fed credibility or geopolitical tensions get worse, then gold may have a 20-50% upside. I’ll put that, tentatively at a 10-20% probability. However, the asset correlations and arguments I’ve laid out show gold may have a significant short-term downside. Add to this, the fact that the gold bulls’ main argument is dollar debasement, monetary Armageddon or world Armageddon.
I will put the bear case for gold at a 40-60% chance. 4-month out of the money puts on gold ETFs and futures pricing in 20% annualised implied volatility, this means that the market is saying that there is a 67% chance that gold ETF GLD price will fall between 150-190 at the end of 4 months. Another trade is to short the 25 delta puts and buy 2 10 delta puts on the 6-month as a long gamma strategy. The vol structure of gold gives the trade quite a lot of upside with a little downside if you roll every 3 months.
Having a position of about 0.5-2% of your portfolio in 6-month 10-20 delta puts on this could help if your portfolio is heavily exposed to long inflation (e.g. long oil/miners, short bonds, short consumer discretionary, long value). Since the recommendation is generally a portfolio hedge rather than a call to short gold, the only risk here is the premium and liquidity risk associated with investing in options.
Conclusion and summary
I believe gold has the potential to significantly lose value (15-25%) in the next 3-6 months if the market participants believe that the Fed has gotten inflation under control due to a confluence of factors discussed in my writing. Since gold has a smaller but still significant chance of crashing upwards (10-20%), shorting gold would not be advisable. I believe 3-6 month out of money (10-20 delta) put options are underpriced at 15-20% volatility.
Thanks for reading and please give your thoughts and opinions. I’ll try to answer them as best I can.
Be the first to comment