

Gold, US Dollar, Treasury Yields, Inflation, Initial Jobless Claims Technical Outlook – Talking Points
- Gold prices remain under pressure in APAC trading as strong USD, higher yields weigh
- Initial jobless claims data is on tap, with a higher number potentially sparking a rebound
- XAU/USD is approaching critical levels that may dictate the near-term price direction
| Change in | Longs | Shorts | OI |
| Daily | 5% | 3% | 4% |
| Weekly | 12% | -9% | 8% |
Gold prices fell around 1.3% on Wednesday as higher Treasury yields and a rising US Dollar added headwinds to the metal. That move wiped out gains from the previous two days and dragged prices down to a fresh October low near the 1,628 mark. Now, the 2022 low from September at 1,614.92 is within striking distance, providing bullion bears with an enticing opportunity to target the 1,600 level.
The policy-sensitive 2-year Treasury yield closed above 4.5% after a higher-than-expected inflation report crossed the wires across the Atlantic and caused a wave of bond selling. The United Kingdom’s consumer price index (CPI) for September crossed the wires at 10.1% from a year before. That was slightly higher than the 10.0% consensus forecast. Rate traders see hot UK inflation as a hawkish signal for the Federal Reserve.
Discover what kind of forex trader you are
Higher interest rates bode poorly for gold, a non-interest-bearing asset. Even more so for higher US rates (due to the impact on the US Dollar, not to mention the size of the Treasury market). That said, gold prices may struggle over the short term until economic data suggests inflation may abate soon. That could come from a soft high-impact economic data print from the United States, but the calendar only offers high-frequency labor market numbers.
An uptick in US initial jobless claims would likely spark a pullback in FOMC bets, which should clear the way for higher bullion prices. That data for the week ending October 15 is due out at 12:30 UTC. Analysts expect to see 230k initial claims, according to a Bloomberg survey. That would be up from 228k the week prior. However, it would likely take a higher-than-expected figure to send bullion higher.
Recommended by Thomas Westwater
Top Trading Lessons
Gold Technical Outlook
Gold is on track to test the September low (1,614.92), with prices within 1% of the level while pacing lower throughout Asia-Pacific trading. The MACD and RSI oscillators are both trending lower, underscoring the move’s bearish momentum. The 1,600 psychological level would present a major test for XAU if the September level breaks.
Alternatively, those levels may offer a staging point for prices to rebound. If so, the 23.6% and 38.2% Fibonacci retracements and the falling 20-day and 50-day Simple Moving Averages are on the table as potential resistance.
XAU/USD Daily Chart
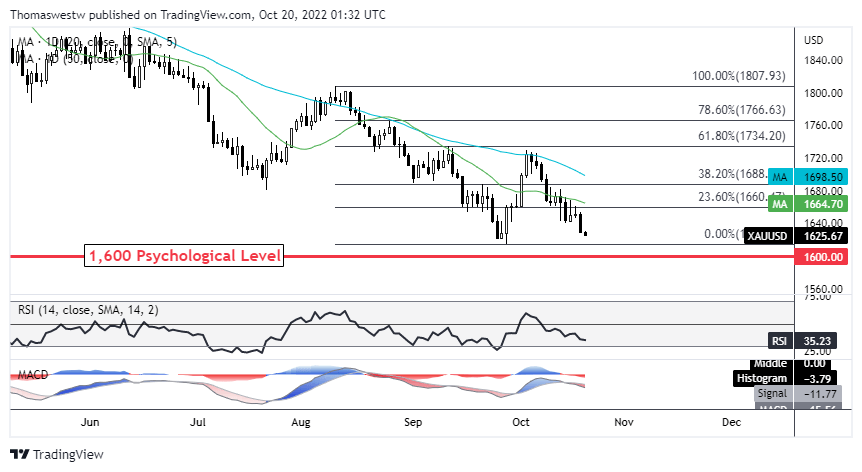
Chart created with TradingView
— Written by Thomas Westwater, Analyst for DailyFX.com
To contact Thomas, use the comments section below or @FxWestwater on Twitter
Be the first to comment