

Nodar Chernishev
Net Lease REITs have widely outperformed the REIT average thus far this year. According to Hoya Capital Income Builder, Net Lease REITs on average have lost only (-2.95)% this year, while the average REIT has lost (-18.39)%.
Hoya Capital Income Builder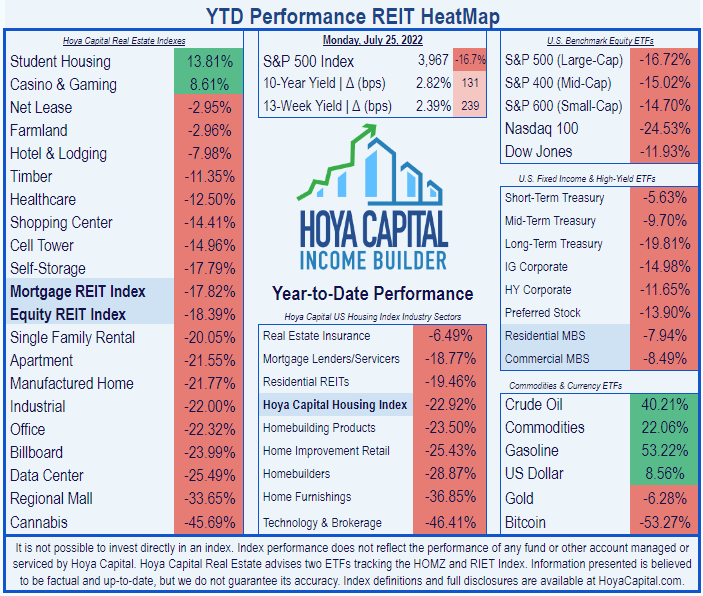
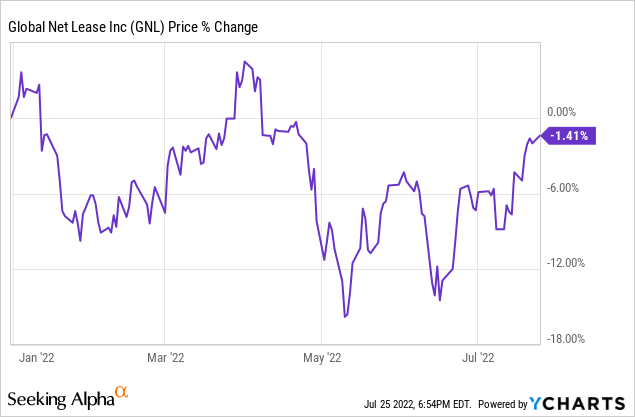
Global Net Lease (NYSE:GNL), in turn, has outperformed the Net Lease average, losing just (-1.4)% in total return YTD.
This article examines growth, balance sheet, dividend, and valuation metrics to understand this very diversified and truly global company.
Meet the company
Global Net Lease
Founded in 2011 and headquartered in New York, Global Net Lease seeks to own and manage mission critical real estate, triple-net leased to single tenants with investment-grade fundamentals. GNL’s portfolio includes 235 properties in the U.S. and Canada, and 74 in Europe, with a total of 39.3 million square feet, diversified across 11 countries and 50 industries, with financial services and auto manufacturing leading the way. The company enjoyed 98.7% occupancy as of May, 2022.
Company investor presentation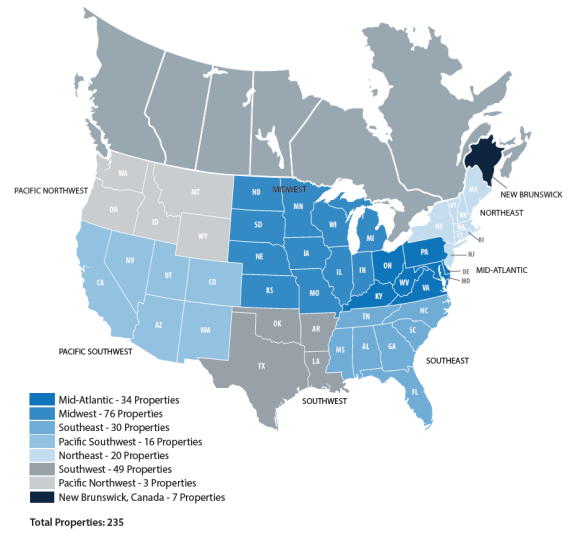
Company investor presentation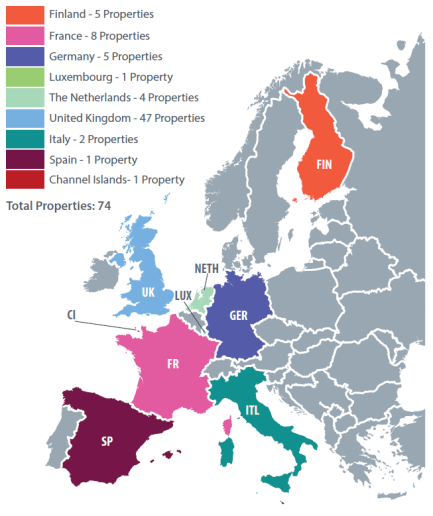
The weighted average lease term is 8.4 years, and 94% of GNL’s leases feature annual rental increases, including 28% with ladders that are based on the Consumer Price Index.
GNL is externally managed by AR Global. Management’s compensation is based in part on the operational performance of the REIT.
The majority of GNL properties (55%) are industrial or distribution facilities. In fact, since 2020, over 81% of GNL’s acquisitions have been this type of property. But 42% of the portfolio is office space, which faces a long-term sag in demand, and 3% is retail.
Company investor presentation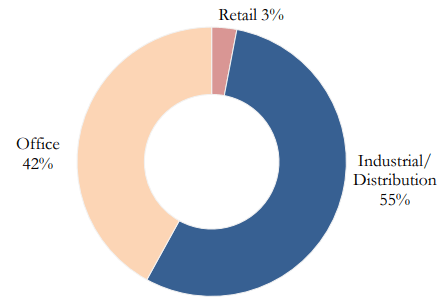
Although GNL purports to focus on investment-grade tenants, only 62% of their customers fit this description.
Company investor presentation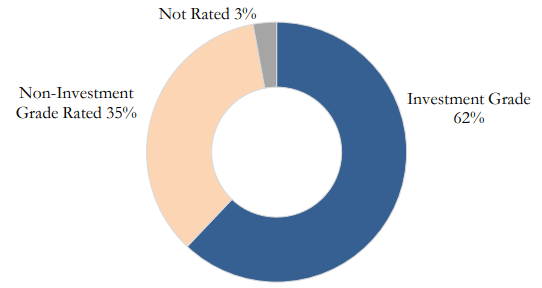
The majority (60%) of GNL properties are in the U.S., with Michigan leading the way at 14.7%, but 21% are also in the U.K., with the balance in Europe and Canada. GNL operates only in countries with sovereign debt ratings of A or better, except for Italy, at BBB.
Company investor presentation
GNL’s top tenant is McLaren, a British maker of race cars, at a slightly uncomfortable 6% of straight-line lease revenue, with the top 10 tenants accounting for 33%.
Company investor presentation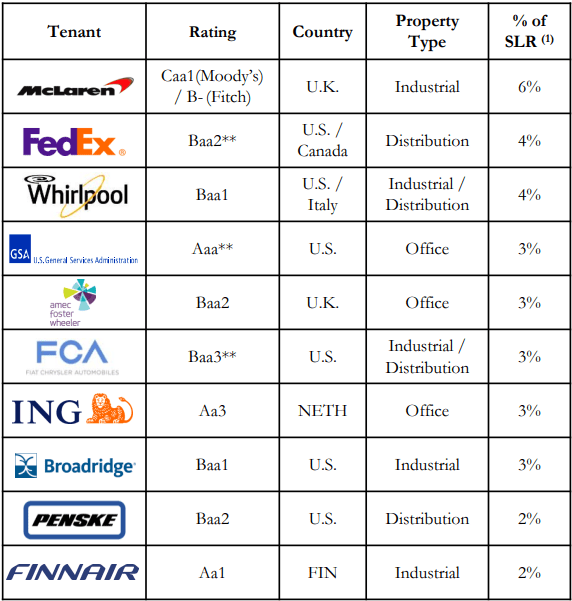
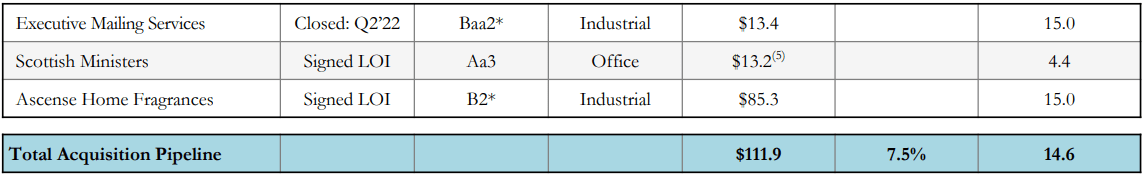
In Q2 2022, GNL closed on a $13.4 million deal for an industrial property leased for 15 years to Executive Mailing Services, and the company reports a modest remaining pipeline of two properties for $98.5 million. The weighted average cap rate on all three acquisitions comes in at 7.5%.
xxxxxxxxxxxxxxxxxxxxxxxxxxxxxxxxxxxxxxxxxxxxxxxxxxxxxxxxxxxxxxxxxxxxxxxxxxxxxxxxxxxxxxxxxxxxx Company investor presentation
Net assets held for sale by GNL as of March 31 totaled only $3.36 million. The company conducted no dispositions in Q1 2022.
Lease expirations over the next two years amount to only 8% of the portfolio, but in 2024, leases accounting for 11% of square footage expire, and another 8% in 2025.
Company investor presentation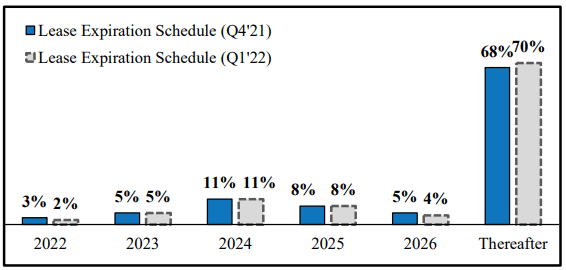
Last quarter’s results
Looking at the company’s latest 10-Q, we learn these salient facts about Q1 2022 results:
- Total revenue of $97.1 million, up 8.7% YoY (year-over-year).
- Total expenses of $64.3 million, up just 1.1% YoY
- Net operating income was $32.8 million, up 27.4% YoY.
- Net cash from operations came in at $61.8 million, up 16.2% YoY.
- Cash and cash equivalents plummeted from $264 million to $128 million.
- G&A expense of $3.9 million, down slightly from $4.1 million YoY.
- Weighted average shares outstanding rose 13.2% YoY, to 103.6 million.
- FFO of $45.6 million, up 17.4% YoY
- Total dividend distributions of $46.7 million.
Growth metrics
Here are the 3-year growth figures for FFO (funds from operations), TCFO (total cash from operations), and market cap.
| Metric | 2018 | 2019 | 2020 | 2021 | 3-year CAGR |
| FFO (millions) | $131.4 | $143.3 | $130.9 | $170.4 | — |
| FFO Growth % | — | 9.1 | (-8.7) | 30.2 | 9.05% |
| FFO per share | $2.14 | $1.69 | $1.51 | $1.74 | — |
| FFO per share growth % | — | (-21.0) | (-10.7) | 15.2 | (-6.66)% |
| TCFO (millions) | $145 | $146 | $177 | $192 | — |
| TCFO Growth % | — | 0.7 | 21.2 | 8.5 | 9.81% |
| Market Cap (billions) | $1.34 | $1.81 | $1.53 | $1.58 | — |
| Market Cap Growth % | — | 35.1 | (-15.5) | 3.3 | 5.65% |
Source: TD Ameritrade, CompaniesMarketCap.com, and author calculations
FFO and TCFO have both been averaging growth of just under 10% for the past 3 years, but FFO per share has shrunk by (-6.66)%. GNL seems to be relying heavily on share issuance to raise capital. According to their latest 10-Q, they issued only Series B preferred stock (97,384 shares) in Q1 2022.
GNL’s current market cap is $1.59 billion, virtually unchanged from last December, and above the small-cap threshold of $1.4 billion, but growing at only 5.0% per annum over the last 3.5 years.
Meanwhile, here is how the stock price has done over the past 3 twelve-month periods, compared to the REIT average as represented by the Vanguard Real Estate ETF (VNQ).
| Metric | 2019 | 2020 | 2021 | 2022 | 3-yr CAGR |
| GNL share price July 25 | $19.30 | $16.06 | $18.49 | $15.07 | — |
| GNL share price Gain % | — | (-16.8) | 15.1 | (-18.5) | (-7.92)% |
| VNQ share price July 25 | $87.89 | $78.20 | $105.85 | $94.67 | — |
| VNQ share price Gain % | — | (-11.0) | 35.4 | (-10.6) | 2.51% |
Source: MarketWatch.com and author calculations
GNL sold off more heavily than most during the 2020 pandemic, and benefited far less from the REIT boom in 2021. All in all, shares in GNL purchased July 25, 2019, have paid $4.67 in dividends, while losing $4.23 in value, for a total return of 44 cents per share, or 2.2%, a CAGR of less than 1%.
Balance sheet metrics
Here are the key balance sheet metrics. Global Net Lease has major problems in this critical aspect of the business. Their liquidity ratio is nondescript, the Debt Ratio is more than double the REIT average, and the company’s debt is an unwieldy 8.2 times EBITDA.
| Company | Liquidity Ratio | Debt Ratio | Debt/EBITDA | Bond Rating |
| GNL | 1.62 | 58% | 8.2 | BB+ |
Source: Hoya Capital Income Builder, TD Ameritrade, and author calculations
The company’s weighted average debt maturity is 4.0 years at 3.4%, with no unsecured notes coming due until 2027 or later. However, in 2023, the company faces $270 million in debt maturities, which is more than their expected NOI for the entire year. Then in 2024, a big gulp of $608 million comes due. GNL will likely have to restructure its debt, or become a net seller of assets, or cut the dividend, unless revenues rise far faster than expected.
Company investor presentation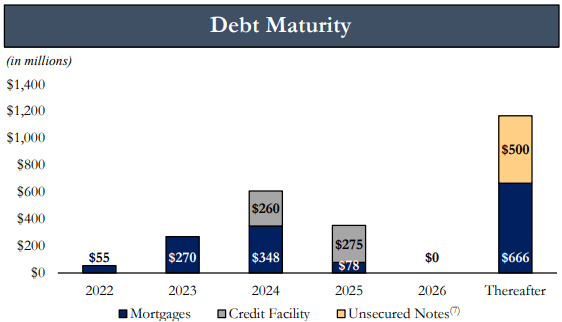
Dividend metrics
GNL’s dividend Yield of 10.6% looks really good, with inflation running at 9.1%. Even taking its negative dividend growth rate into account, GNL’s Dividend Score of 8.76 blows away the Net Lease REIT average, and more than doubles the overall REIT average.
Unfortunately, with a 90% payout ratio and the debt woes mentioned above, the risk of a dividend cut is very high, and indeed Seeking Alpha Premium rates the Dividend Safety a D-, which is as close as you can come to a flat-out F. This is of major importance, because a dividend cut is usually followed by a plummet in the share price, as COWhand investors (Cash Only Wanted) flee for greener pastures.
| Company | Div. Yield | 3-yr Div. Growth | Div. Score | Payout | Div. Safety |
| GNL | 10.6% | (-9.1)% | 8.76 | 90% | D- |
Source: Hoya Capital Income Builder, TD Ameritrade, Seeking Alpha Premium
Dividend Score projects the yield three years from now, on shares bought today, assuming the Dividend Growth rate remains unchanged.
Valuation metrics
GNL’s Price/FFO ratio is a tempting 8.8, and the company trades at a (-24.8)% discount to NAV. With a spectacular Dividend Score of 8.76, this company is the perfect mousetrap for value investors.
| Company | Div. Score | Price/FFO ’22 | Premium to NAV |
| GNL | 8.76 | 8.8 | (-24.8)% |
Source: Hoya Capital Income Builder, TD Ameritrade, and author calculations
Research by Hoya Capital shows that cheap REITs tend to stay cheap. GNL is cheap for a reason.
What could go wrong?
GNL’s ability to continue growing depends on access to additional debt or equity financing on attractive terms, and they acknowledge there is no guarantee they can find it.
Due to the massive debt maturities in 2023 and 2024, which overmatch the company’s anticipated NOI, there is imminent risk of a dividend cut. The company acknowledges this forthrightly in its May investor presentation, saying,
We have substantial indebtedness and may be unable to repay, refinance, restructure or extend our indebtedness as it becomes due. Increases in interest rates could increase the amount of our debt payments. We may incur additional indebtedness in the future.
That said, on July 1, GNL did announce its paying a dividend of 40 cents per share, same as it has since April 2020.
The company’s investor presentation also includes this startlingly candid assessment, concerning the external management structure:
All of our executive officers face conflicts of interest, such as conflicts created by the terms of our agreements with the Advisor and compensation payable thereunder, conflicts allocating investment opportunities to us, and conflicts in allocating their time and attention to our matters. Conflicts that arise may not be resolved in our favor and could result in actions that are adverse to us.
With 21% of its assets in the U.K., GNL is exposed to risks from Brexit. Also, geopolitical instability due to the war in Ukraine may adversely impact U.S., European, and global economies.
The company’s stockholder rights plan may inhibit a third party from acquiring GNL in a manner that boosts the share price.
GNL’s continued status as a real estate investment trust for U.S. federal income tax purposes is not guaranteed.
Investor’s bottom line
I rarely issue Sell ratings, but GNL is a potential yield trap, and the Yield is the cheese. At first glance, that 10.6% yield looks great, and shares are dirt cheap. There is a high risk that the company may cut its dividend, however, and if that happens, the investor coming on board today would likely lose money on share prices as well as getting sharply reduced dividends or no dividends at all for a while.
Even if the dividend holds, the erosion in the value of the underlying shares may very well outstrip the yield. In the short run (3 – 6 months) this might not be a problem, but in the longer run (one year or more) the odds seem stacked against this company. If I had shares of GNL, I would be selling them.
Seeking Alpha Premium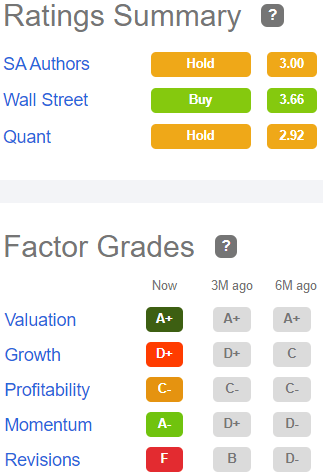
This puts me at odds with some Wall Street analysts, 2 of whom rate GNL a Strong Buy, and 4 of whom rate it a Hold.
TipRanks rates GNL as Outperform, while The Street and Ford Equity Research recommend a Hold. Revision-sensitive Zacks rates it a Strong Sell.
Global Net Lease plans to report quarterly earnings on August 4, before the open.
Be the first to comment