

CHUNYIP WONG/E+ via Getty Images
Introduction
Despite the worst of the severe economic downturn of 2020 sitting in the rear-view mirror heading into the second half of 2021, there were even higher stakes heading into third-quarter earnings season for the overleveraged NuStar Energy (NYSE:NS) and their risky high distribution yield of 9.79%, as my previous article explained. Since half a year has now elapsed, it seems timely to provide a follow-up analysis that covers their financial results for the second half of 2021, plus the outlook ahead given their risky situation, which disappointingly, sees more of the same in 2022.
Executive Summary & Ratings
Since many readers are likely short on time, the table below provides a very brief executive summary and ratings for the primary criteria that were assessed. This Google Document provides a list of all my equivalent ratings as well as more information regarding my rating system. The following section provides a detailed analysis for those readers who are wishing to dig deeper into their situation.
Author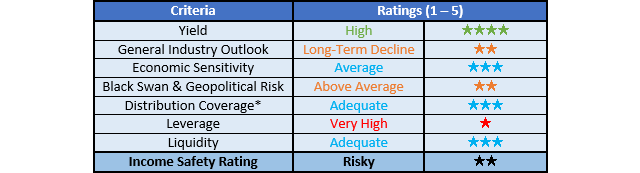
*Instead of simply assessing distribution coverage through distributable cash flow, I prefer to utilize free cash flow since it provides the toughest criteria and also best captures the true impact upon their financial position.
Detailed Analysis
Author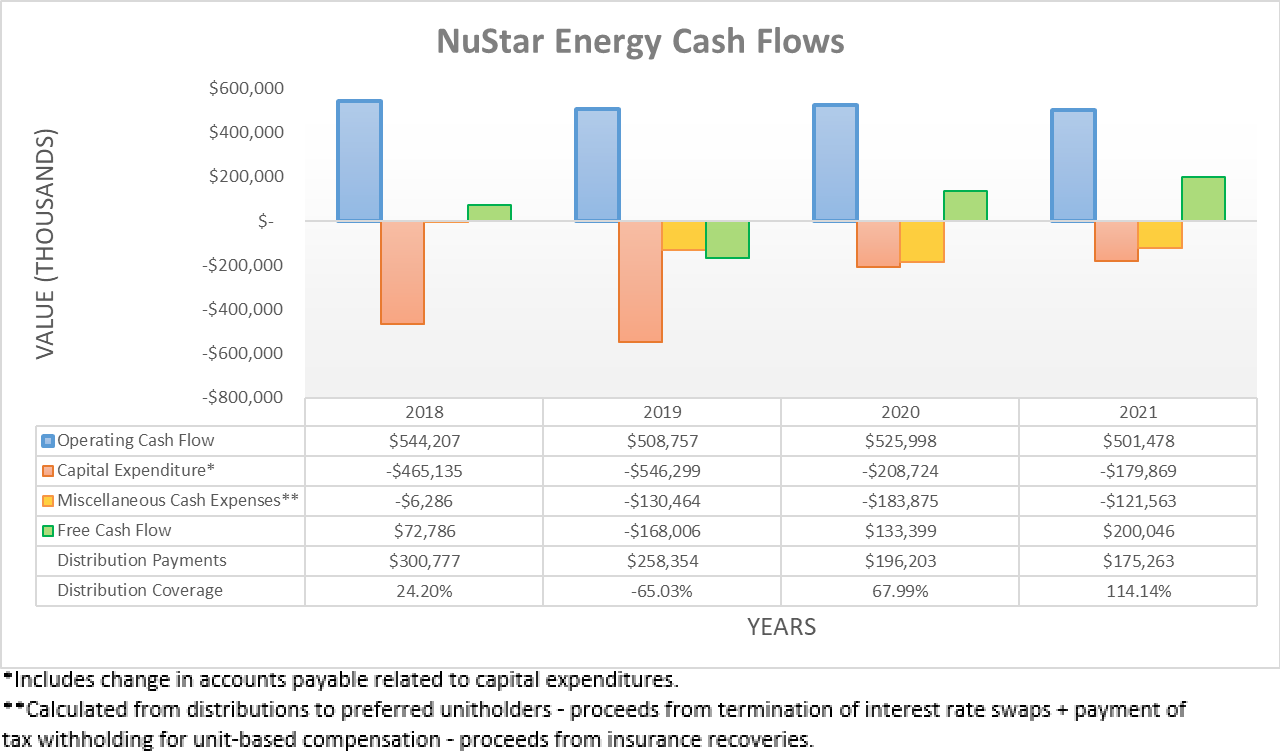
Following a bumpy start to 2021 that saw their operating cash flow during the first half weighed down by temporary working capital movements that caused a significant 20.78% decrease year-on-year versus the first half of 2020, thankfully these partly reversed during the second half. This saw their operating cash flow end 2021 at $501.5m and thus now only down a minor 4.66% year-on-year versus their previous result of $526m during 2020. Although if once again removing the impacts of their working capital movements, their underlying operating cash flow was broadly steady year-on-year at $515.6m during 2021 versus their equivalent previous result of $514.1m during 2020.
When looking ahead into 2022, it appears to be more of the same with their guidance for adjusted EBITDA of $725m at the midpoint and thus a non-consequential 2.90% higher year-on-year, as per their fourth quarter of 2021 results announcement. Whilst certainly not exciting, if nothing else at least it appears that their financial performance should have bottomed and given these very strong oil and gas prices, the potential for more supply to come online in North America during 2023 and beyond raises prospects that their logistics assets may see a modest recovery on the horizon, although this remains to be seen. Meanwhile, their guidance also sees 2022 strategic capital expenditure, more commonly known as growth capital expenditure of $150m, which is accompanied by $40m of reliability capital expenditure, more commonly known as maintenance capital expenditure. When aggregated these equal a total of $190m, which means that their capital expenditure during 2022 should increase by circa $10m versus its level of $179.9m during 2021.
Since their guidance for their adjusted EBITDA for 2022 is very similar to their result during 2021, it stands to reason that their operating cash flow should also remain essentially unchanged at circa $515m with the exact result depending upon working capital movements. Once subtracting their capital expenditure guidance and their further $127.6m of preferred distribution payments, it leaves their estimated free cash flow at circa $197m. Despite once again providing adequate coverage to their distribution payments of $175.3m per annum, the only minimal circa $22m margin is thin and thus once again, they should have little retained for deleveraging, similar to 2021.
Author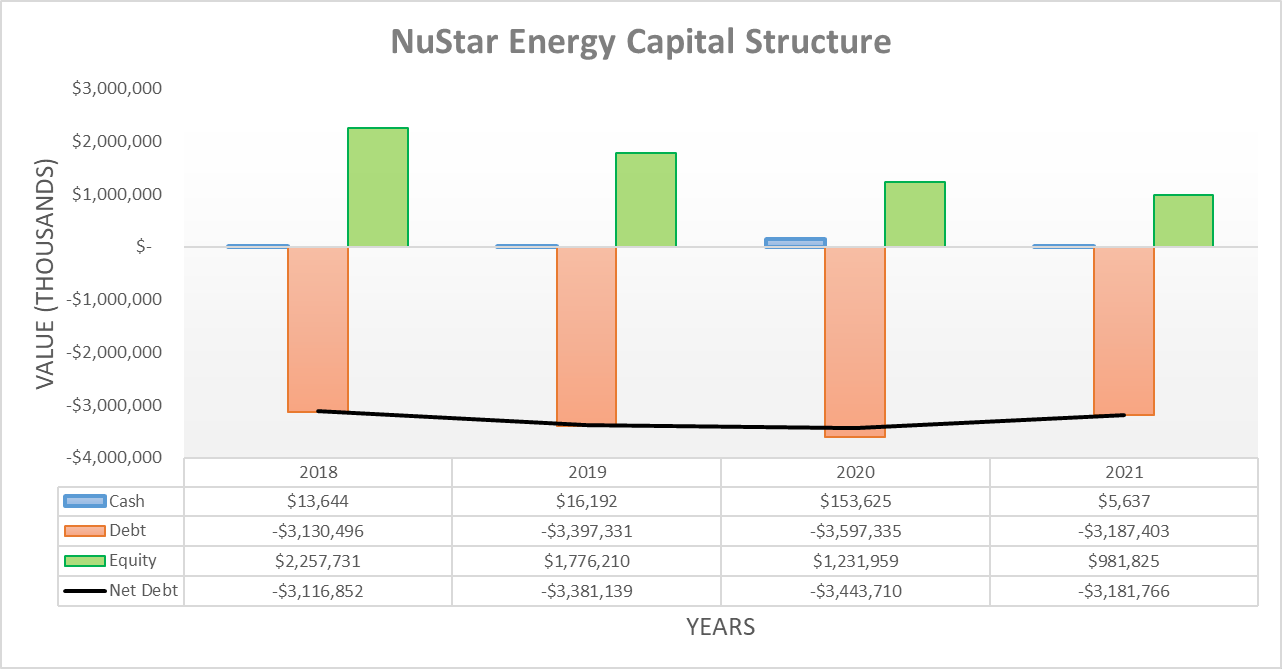
After seeing their net debt trend higher throughout 2019 and 2020, it finally reversed course during 2021 to end the year at $3.182b versus the $3.444b where it ended 2020. Despite representing an improvement, this was simply due to their $250m Eastern Terminals divestiture in the second half of the year that followed my previous analysis and furthermore, it only was a modest 7.61% lower year-on-year and thus barely moves the needle in the grand scheme. When looking ahead into 2022, their outlook for thin distribution coverage essentially takes further deleveraging off the table to any material extent without relying upon divestitures, which so far have only seen a relatively minor $60m sale of a terminal in Nova Scotia announced.
Author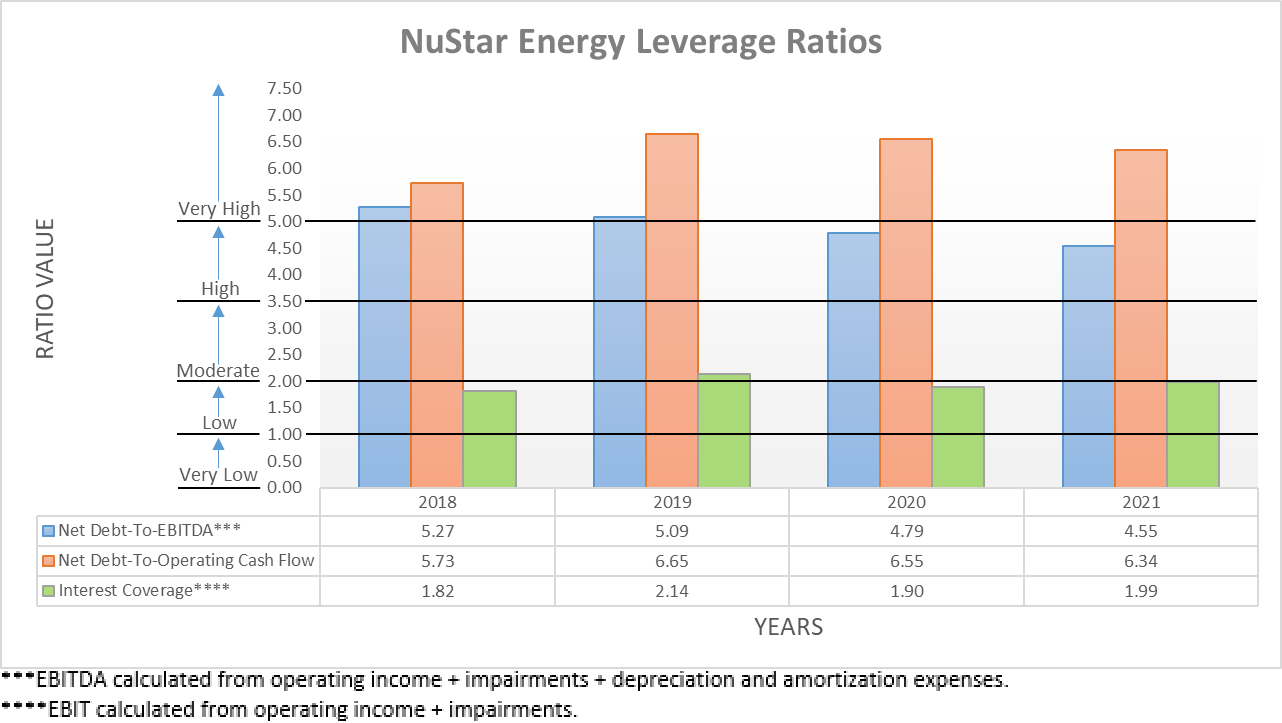
Following their broadly steady financial performance throughout the second half of 2021, it was not surprising to see their leverage pushed slightly lower on the back of their lower net debt. This now sees their respective net debt-to-EBITDA and net debt-to-operating cash flow both down to 4.55 and 6.34 versus their respective results of 4.89 and 6.75 when conducting the previous analysis following the first half of 2021. Once again, despite representing an improvement there is still much work left with their leverage remaining split between the high territory in the case of their accrual-based net debt-to-EBITDA and even more worryingly, the very high territory in the case of their cash-based net debt-to-operating cash flow.
Unless they reduce their distributions significantly to boost their retained free cash flow well past its current estimated circa $22m level, it would almost take a staggering 30 years to merely reduce their net debt of $3.182b by even one-fifth, which would only be the bare minimum to restore fiscal strength. This is actually even longer than the 25 years estimated in my previous analysis due to their outlook for slightly higher capital expenditure during 2022 versus 2021. Whilst any uplift their financial performance sees during 2023 and beyond would help expedite this timeline, it nevertheless remains speculative for the time being and thus, disappointingly it appears that 2022 merely offers more of the same with their distributions remaining risky.
Author
Whilst their respective current and cash ratios of 0.86 and 0.03 at the end of 2021 represent decreases versus their respective results of 1.11 and 0.12 when conducting the previous analysis following the first half, thankfully they still remain adequate. This could be further boosted by the $884.8m available under their credit facility if required, although drawing upon this significantly would increase their leverage ratio of 3.99 and thus risk breaching its covenant limit of 5.00 but thankfully, their broadly matched cash inflows and outflows for 2022 should not see this requirement arise. At least this makes their liquidity a bright spot for their otherwise unfavorable fundamentals, especially now that their 2023 debt maturities have been refinanced and thus see nothing maturing until 2025, as the table included below displays.
NuStar Energy 2021 10-K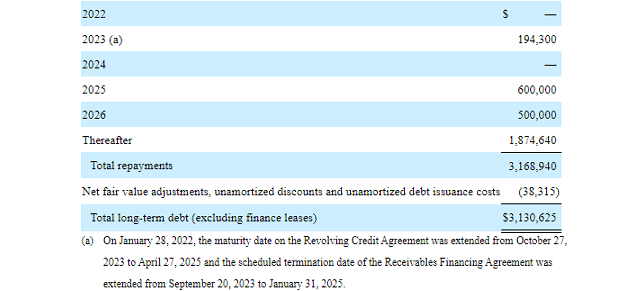
Conclusion
On one hand, the resolve management has shown to sustain their distributions is impressive but on the other hand, they remain burdensome and hinder their ability to deleverage and thus de-risk to help their unit price rally. Whilst it appears that 2022 merely offers more of the same, their financial performance appears to have bottomed with tentative hope on the horizon for 2023 and thus I now believe that upgrading my previous sell rating to a hold rating is appropriate.
Notes: Unless specified otherwise, all figures in this article were taken from NuStar Energy’s SEC filings, all calculated figures were performed by the author.
Be the first to comment