

Viktorcvetkovic/E+ via Getty Images
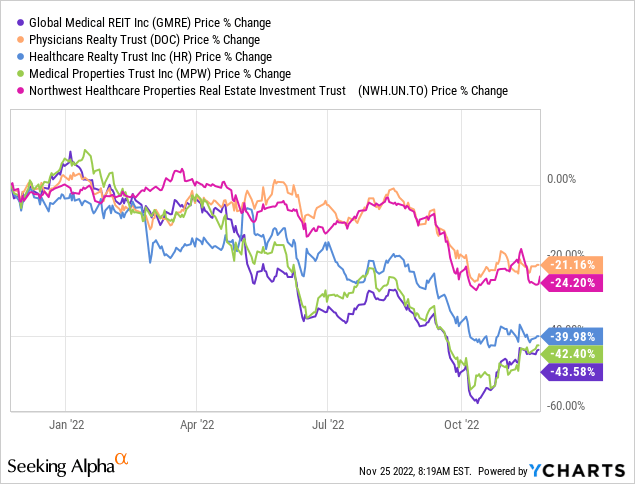
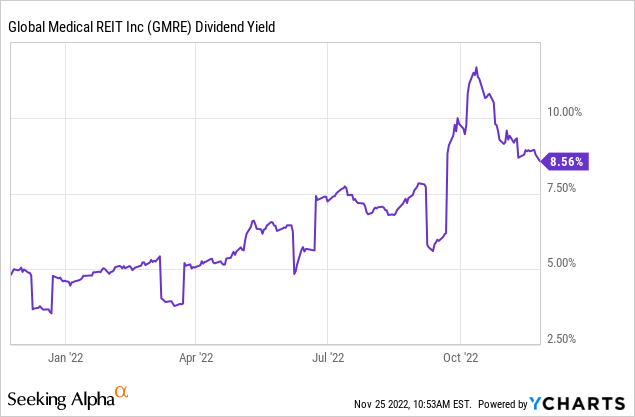
REITs have been at the receiving end of the Federal Reserve’s tighter monetary policy. The hardest hit have been those with high funds from operations (FFO) multiples and those where investors had historically sought safety. After all, what good is a safe 4% yield when you get that in one-year Treasury notes. That anti-safety trade can be seen in the healthcare REIT sector. Global Medical REIT (NYSE:GMRE), the one we are going to focus on, comes dead last in this group, though it was a photo finish.
Of course, falling prices bring their own set of negativity and we have to disassociate price action with the fundamentals. We try to do that here and look at where the NAV stands today.
Fundamentals
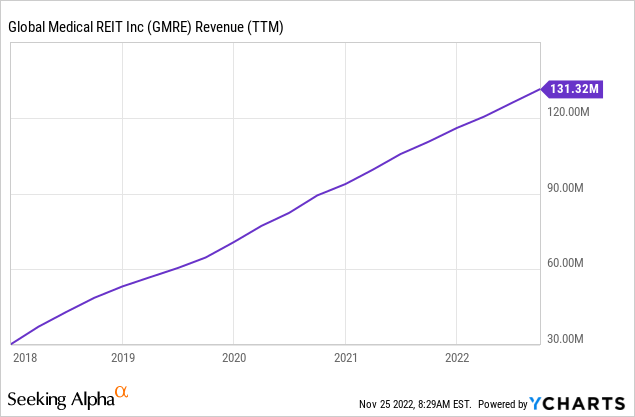
GMRE is a medical office building or MOB-focused REIT that owns and acquires MOBs and leases them out to physician groups.
GMRE Q3-2022 Presentation
Where GMRE defers from the standard model is that it focuses on secondary smaller markets. The larger players like Physicians Realty Trust (DOC) focus more on the Class A properties in top locations and land, buying those often at sub 5% cap rates. GMRE on the other hand has acquired its portfolio historically at 7%-8% cap rates. For better or for worse, that is the model. If you want the medical offices sitting right next to Johns Hopkins, you won’t find them at GMRE. If you want MOBs in secondary markets where GMRE can generate a solid spread vs. its own cost of capital, you have come to the right place. The REIT has made the model work and has grown rapidly over the last five years.
The current portfolio boasts of 189 buildings and almost 5 million leasable square feet of real estate.
GMRE Q3-2022 Presentation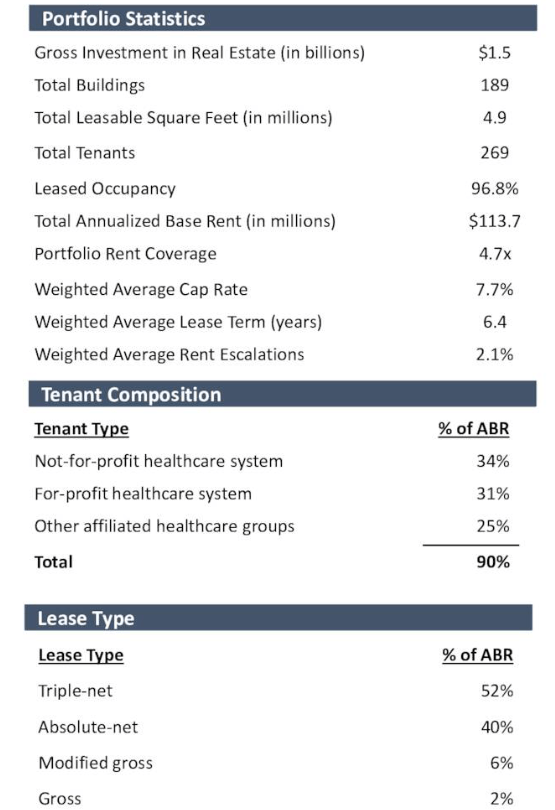
The portfolio has a relatively heavy concentration in Texas and Florida, but overall, the diversification is acceptable.
GMRE Q3-2022 Presentation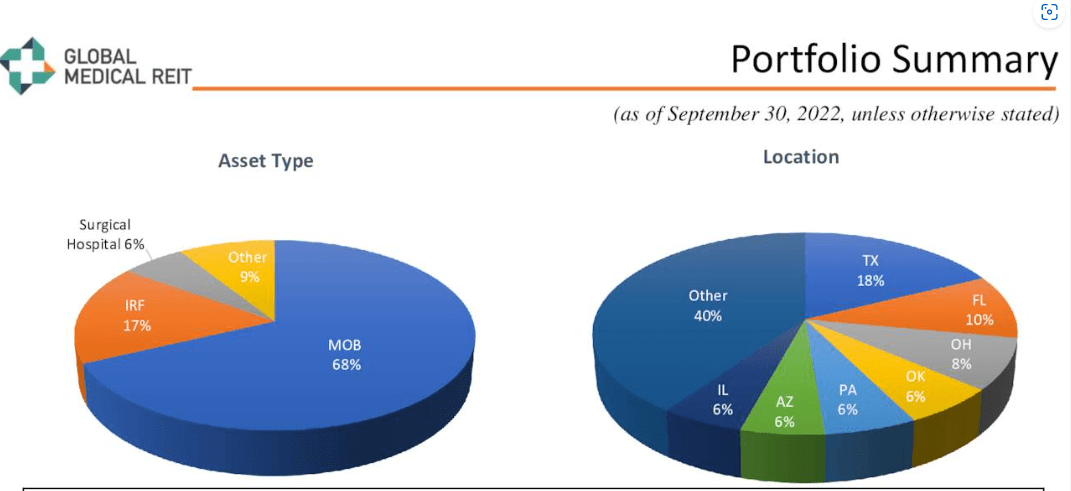
But What’s It Worth In The Current Market?
Any exercise speculating on liquidation values is filled with difficulties. While net operating income (NOI) is easy to assess, applying general cap rates on a diverse portfolio of assets is unlikely to be accurate. Even assuming you could put a set of level 3 assets in the right zip code, it won’t necessarily tell you where those values are headed over the next 12-24 months. Further, the company’s own valuation measures may not prove any more useful than your guesswork. One extreme example of this was seen in the case of Brookfield Property Partners, which was acquired into the Brookfield Asset Management (BAM) fold. BAM was happy showing NAV as $26.65 per share, right before they came out and said, “best we can do is $18.17.” With all that said, let’s look at how we could approach NAV.
The Cap Rate Guide
GMRE provides the portfolio cap rate in its presentations.
GMRE Q3-2022 Presentation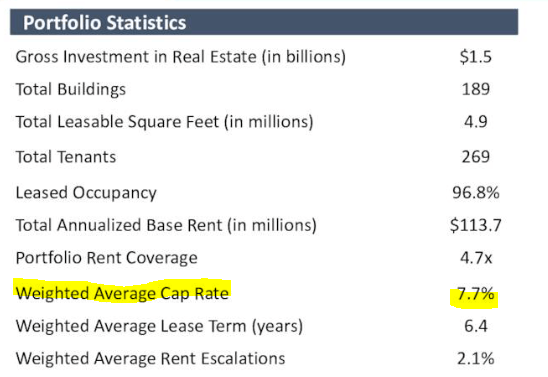
This 7.7% is reasonable in our opinion and likely a bit on the high side. How does this translate into a NAV though? We need NOI numbers to apply this cap rate on. Some investors have used trailing 12 months operating income as the proxy for the NOI. This is incorrect for three reasons.
1) NOI is generally a forward-looking term for cap rate calculations. So, using trailing 12 months won’t really reflect what those numbers should be applied on.
2) This is even more distorted in the case of a REIT acquiring properties rapidly, like GMRE. As the revenue run-rate shows, GMRE was buying properties left, right and center. Trailing 12-month numbers will create a downward bias on NAV.
3) Operating income by definition will be after general and administrative expenses and also property acquisition expenses. Neither are really applicable for NOI based calculations.
So, what’s the correct number? The closest for ballpark purposes would be the NOI (revenues minus operating expenses) from the Q3-2022 numbers, annualized.
GMRE Q3-2022 Presentation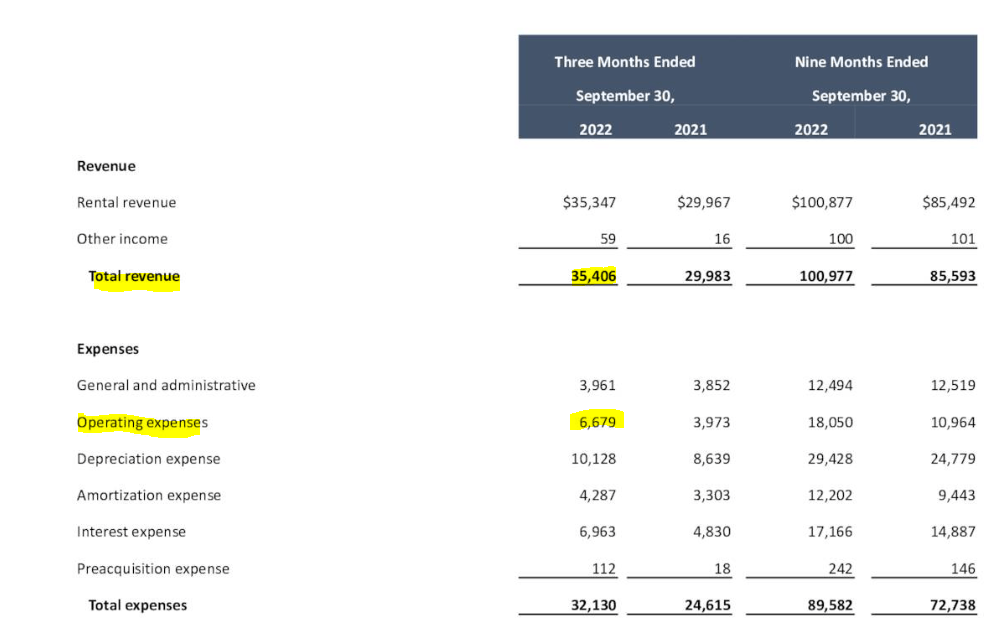
This works out to about $115 million ($28.73 million X 4) and is likely a good start. That number with the 7.7% cap rate gives you $1.493 billion of property value. We can compare this to the “net investment in real estate” which is marked at $1.3 billion on GMRE’s balance sheet.
GMRE Q3-2022 Presentation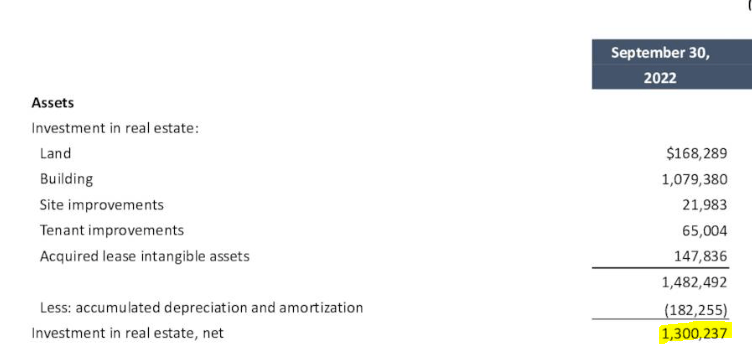
So, an easy way to get to NAV, is to add $193 million (difference between $1.493 billion and $1.300 billion) to the GAAP equity of $649 million.
GMRE Q3-2022 Presentation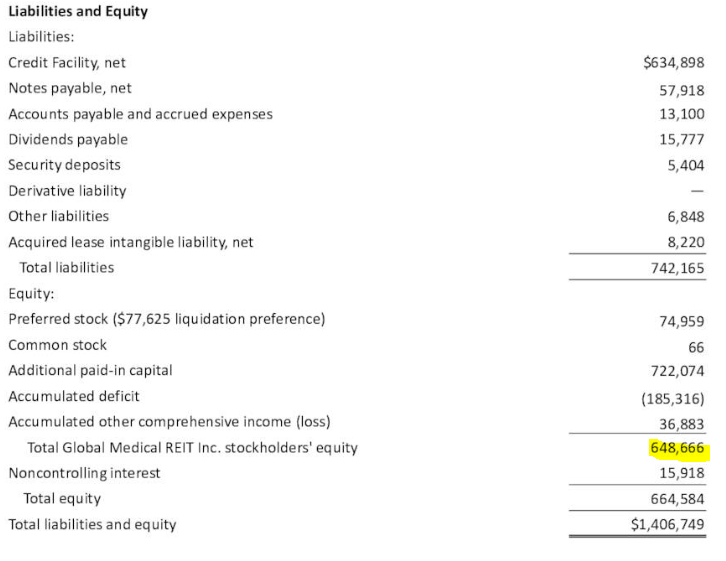
So total NAV would work to $842 million under this calculation and common equity would work out to about $767 million after subtracting our par value of Global Medical REIT Inc. 7.50% CUM PFD A (NYSE:GMRE.PA). With 69.7 million shares outstanding, a rough NAV would be about $11.00 using this method. This likely understates the value as NOI is a forward 12 month looking number for one. It also ignores the acquisitions in the quarter that are not yet producing full quarterly NOI.
GMRE Q3-2022 Presentation
Weighing these factors, our rough NAV here is close to $12.00-$12.50/share. If interest rates rise another percentage point from here, we might have to look closer to $10-50-$11.00. Nonetheless, at $9.75 the stock is cheap for those inclined to look at MOBs for income.
Verdict
While macro factors may be weighing down the stock, the REIT has managed its capital market activities quite nicely. It issued stock when it was trading in the $16 range in Q2-2022 and then stopped issuance as things fell apart. Management reiterated that the current price was too low to be issuing stock. At the same time, it fixed its interest rate exposure.
In August, we expanded our credit facility with $150 million term loan and extended the term of our revolver. We also entered into interest rate swaps that fixed the interest rate on our new term loan through its maturity bring our fixed rate debt ratio to approximately 80% of our total debt. Looking forward, we will be seemly selective in pursuing any incremental acquisitions, until cap rates better reflect the higher cost of capital.
Source: GMRE Q3-2022 Transcript
GMRE trades about 10X FFO and at a solid discount to what we think the properties are worth. DOC trades at about 13.6X FFO. A key difference here is that GMRE has shown the ability to grow FFO per share while DOC has miserably failed in that area (See, Consistency In The Absence Of Growth).
GMRE’s dividend yield is juicy and sustainable in our opinion. It also beats DOC’s yield by 2%.
While risks are obviously higher for a smaller REIT focusing on secondary markets, we do believe the strategy is worth pursuing and so far we have been impressed with management actions. We rate the shares a Buy with a $12.50 price target in two years.
Please note that this is not financial advice. It may seem like it, sound like it, but surprisingly, it is not. Investors are expected to do their own due diligence and consult with a professional who knows their objectives and constraints.
Be the first to comment