

cemagraphics
Are these finally signs that inflation is starting to react to the Fed’s rate hikes and QT, or are we seeing just another head fake? Inflation has a long history of dishing out head fakes, and just when you thought that it would abate, it jumps all over again. This is visible in the long-term charts below.
Prices of some durable goods have been falling for months and they did so again in November. Energy prices plunged. But food prices jumped up and down from item to item; for example, they backed off for meats but spiked for eggs, fresh fruits, vegetables, coffee, and booze.
And then there are services. That’s where nearly two-thirds of consumer spending goes, and many services prices are surging, but under ongoing record-massive mega-downward adjustment to the way the CPI for health insurance is estimated, the whole medical care services CPI dropped.
But this adjustment doesn’t take place in the Fed’s preferred inflation measure, the core PCE. And “core services” – an item Powell specifically pointed out – picked up inflation momentum, and we’re seeing some of that in the CPI as well.
Overall CPI.
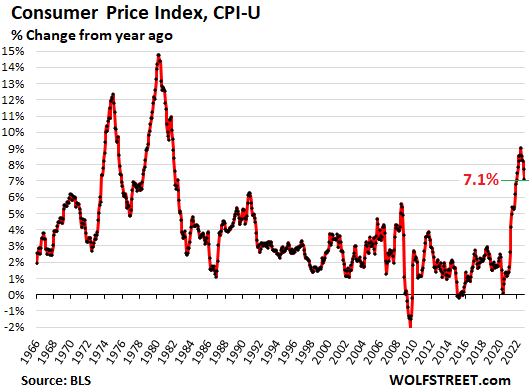
Pushed down by plunging energy costs, the all-items CPI rose only 0.1% in November from October, and was up 7.1% year-over-year, a further deceleration, according to the Bureau of Labor Statistics today.
Spot the head fakes that CPI dished up throughout history. The Fed has been warning about these kinds of head fakes for months because that’s what caused a lot of problems back in the 1970s and early 1980s when the Fed undid some of its tightening, fooled by inflation head fakes, only to see inflation spike again, and then having to tighten a lot further:
“Core CPI.”
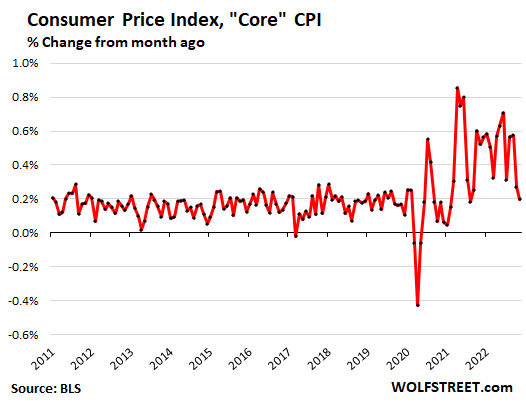
The core CPI, which excludes the volatile food and energy products, rose 0.2% for the month, thanks in part to the massive health insurance adjustment. Here too, there have been lots of head fakes over the past two years:
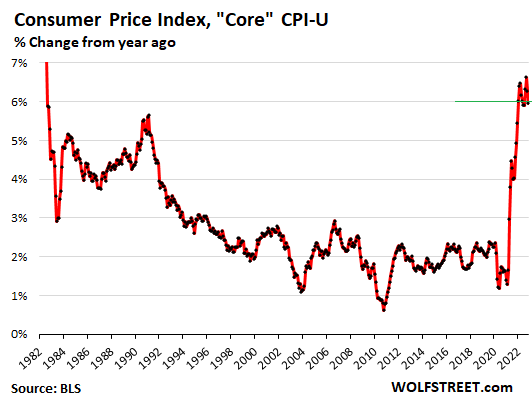
Year-over-year, core CPI jumped 6.0%, and has been just above or just below 6% for the 11th month in a row:
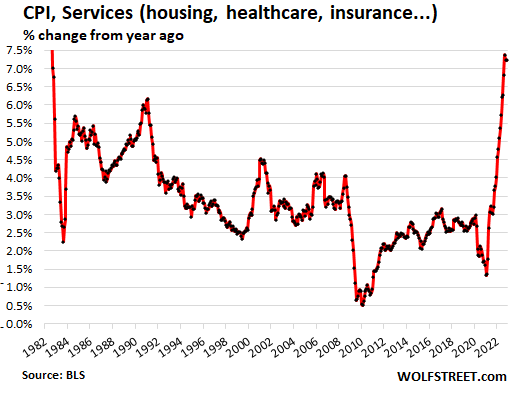
Services Inflation.
The CPI for services –where the massive mega-downward adjustment of health insurance is distorting the numbers – rose by 0.35% for the month, the smallest increase since July. And we learned in August and September that July had been just another head fake:
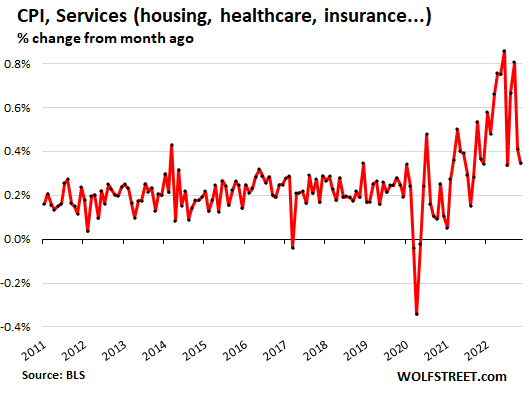
On a year-over-year basis, the services CPI jumped by 7.2%, same as in October. The last three months, all above 7%, were the worst since August 1982. Without the health insurance adjustment – which we’ll get to in a moment – the year-over-year spike may have set a new four-decade record.
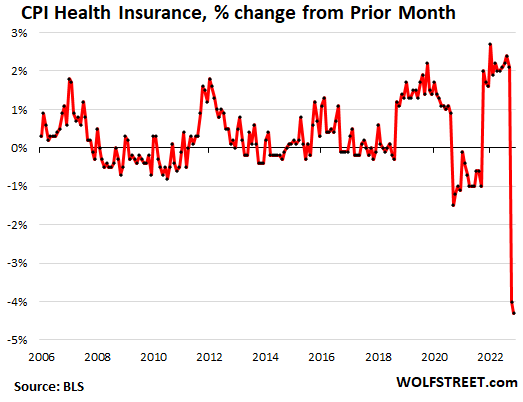
The health insurance adjustment.
The BLS undertakes a periodic adjustment in how it estimates the costs of health insurance. November was the second month of 12 months of adjustments (I’ve discussed this in greater detail here).
Due to this massive mega-adjustment, the CPI for health insurance plunged 4.3% in November from October, after having plunged by 4.0% in October from September. This was by far the biggest month-to-month plunge in the BLS data going back to 2005.
These two months in a row of mega-adjustments reduced the year-over-year rate of the CPI for health insurance from 28% in September to 13.5% in November. These adjustments have occurred before, but never at this magnitude.
What this adjustment means is that health insurance CPI was overstated for the 12 months through September, and is now being understated, and will be understated for 10 more months, to rectify the overstatement:
But no adjustment for the Fed’s favored “core PCE” index, released by the Bureau of Economic Analysis, which uses a different and broader methodology than the BLS, and figures health insurance inflation differently.
Services CPI by category.
The table shows the major services CPI categories in order of the month-to-month change. Many of the very common services had big month-to-month increases.
Note the Medical Services CPI at the bottom, part of which is the massively mega-adjusted health insurance CPI (both in bold).
| Services | MoM | YoY |
| Overall services | 0.3% | 7.2% |
| Telephone services | 2.1% | 1.5% |
| Motor vehicle maintenance & repair | 1.3% | 11.7% |
| Recreational services, admission to movies, concerts, sports events | 1.1% | 4.4% |
| Motor vehicle insurance | 0.9% | 13.4% |
| Video and audio services, cable | 0.9% | 4.2% |
| Rent of primary residence | 0.8% | 7.9% |
| Other personal services (dry-cleaning, haircuts, legal services…) | 0.8% | 6.5% |
| Owner’s equivalent of rent | 0.7% | 7.1% |
| Pet services, including veterinary | 0.7% | 10.9% |
| Water, sewer, trash collection services | 0.3% | 5.0% |
| Postage & delivery services | 0.2% | 4.2% |
| Hotels & motels | -0.9% | 3.3% |
| Car and truck rental | -2.4% | -6.0% |
| Airline fares | -3.0% | 36.0% |
| Medical care services | -0.7% | 4.4% |
| Includes: Health insurance | -4.3% | 13.5% |
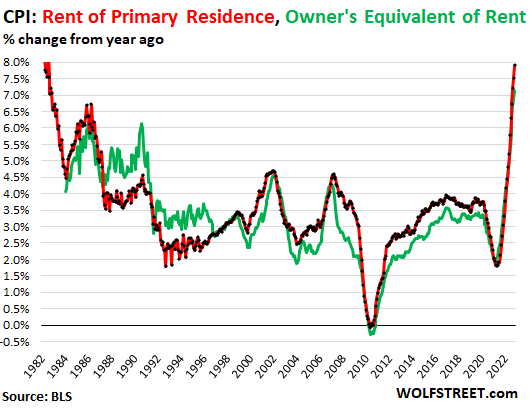
The CPIs for housing costs spike.
The CPI for “rent of shelter” accounts for 32.3% of total CPI. It tracks housing costs as a service, not as an investment asset, and is based on rents:
“Rent of primary residence” (accounts for 7.4% of total CPI) spiked by 0.8% for the month and by 7.9% year-over-year, the highest since 1982 (red in the chart below). It tracks actual rents paid by a large panel of tenants, including in rent-controlled apartments.
Other rent indices, including Zillow’s rent index, are based on “asking rents,” which are the advertised rents that landlords want to charge future tenants. A landlord may lower the asking rent if potential tenants are not biting.
“Owner’s equivalent rent of residences” (accounts for 24.0% of total CPI) jumped by 0.7% for the month and by 7.1% year-over-year (green line). It tracks the costs of homeownership as a service, based on what a large panel of homeowners report their home would rent for.
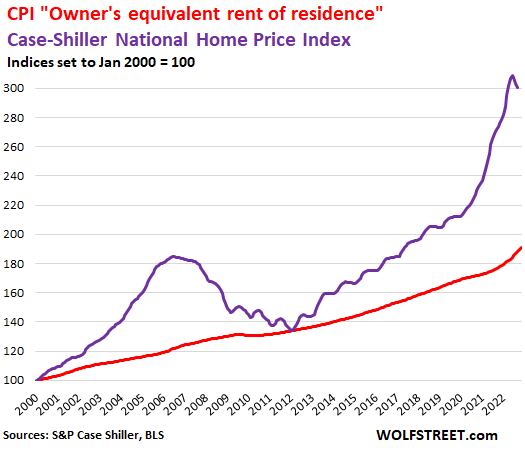
Home prices have started heading south on a month-to-month basis, according to the most recent Case-Shiller Home Price Index (purple line in the chart below), which I track market by market with my series, The Most Splendid Housing Bubbles in America.
The red line represents “owner’s equivalent rent of residence.” Both lines are index values, not percent-changes of index values:
Food inflation.
The CPI for “food at home” – food bought at stores and markets – jumped by 0.5% for the month and 10.6% year-over-year. Some prices that had spiked earlier this year fell, but other prices spiked, continuing the game of inflation Whac-A-Mole:
| Food inflation | MoM | YoY |
| Overall Food at home | 0.5% | 12.0% |
| Cereals and cereal products | 0.6% | 16.6% |
| Beef and veal | -0.8% | -5.2% |
| Pork | -0.3% | 1.2% |
| Poultry | -0.8% | 13.1% |
| Fish and seafood | -0.1% | 6.5% |
| Eggs | 2.3% | 49.1% |
| Dairy and related products | 1.0% | 16.4% |
| Fresh fruits | 2.3% | 6.6% |
| Fresh vegetables | 1.2% | 9.6% |
| Juices and nonalcoholic drinks | 0.5% | 12.9% |
| Coffee | 0.5% | 14.6% |
| Fats and oils | 0.0% | 21.8% |
| Baby food | 0.3% | 10.9% |
| Alcoholic beverages at home | 0.8% | 4.5% |
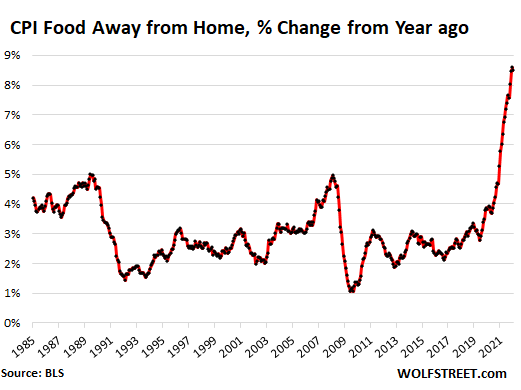
The CPI for “Food away from home”– restaurants, vending machines, cafeterias, sandwich shops, etc. – jumped by 0.5% for the month and by 8.5% year-over-year. Over the past three months, the year-over-year measure has been at around 8.5%, the worst since 1981.
Energy prices plunged for the month, still up big from year ago:
| Energy | MoM | YoY |
| Overall Energy CPI | -1.6% | 13.1% |
| Gasoline | -2.0% | 10.1% |
| Utility natural gas to home | -3.5% | 15.5% |
| Electricity service | -0.2% | 13.7% |
| Heating oil, propane, kerosene, firewood | -0.4% | 41.7% |
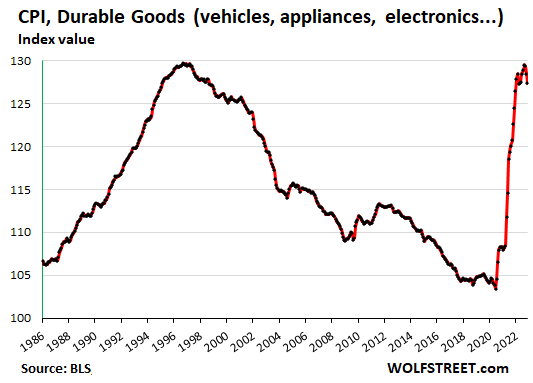
Durable goods CPI.
The CPI for durable goods fell for the third month in a row, after the ridiculous spikes last year and earlier this year. This whittled down the year-over-year gain to just 2.4%, down from the 18% range earlier this year. Here are some key categories. New vehicle prices are still increasing month to month, though a less red-hot pace:
| Durable goods | MoM | YoY |
| Used vehicles | -2.4% | 2.0% |
| Information technology (computers, smartphones, etc.) | -1.0% | -10.8% |
| Household furnishings (furniture, appliances, floor coverings, tools) | -0.8% | 7.6% |
| New vehicles | 0.4% | 8.4% |
| Sporting goods (bicycles, equipment, etc.) | 1.6% | 3.0% |
The CPI for durable goods, expressed as index value, not as percent-change of the index value, shows just how crazy the situation had gotten and that prices are just dipping a little from the ridiculous spike. The largest categories in this index are new vehicles and used vehicles:
Editor’s Note: The summary bullets for this article were chosen by Seeking Alpha editors.
Be the first to comment