

Bet_Noire
One would expect gold bullion and its equivalents to hold their ground during a stock market crash. But historical charts reveal that time and again, gold drops by a significant amount when stock markets buckle at the onset of a recession. So, it should come as no surprise that gold bullion’s doppelganger, SPDR Gold Shares ETF (NYSEARCA:GLD), has fallen 16% from its recent March 2022 high of 191.51.
Buying SPDR Gold Shares once it drops 25% to around 144 will put gold investors in position to benefit from a big end-of-summer bounce in the spot price of gold without missing the boat.
Due to this steep stock market sell-off-which will likely continue into the next year thanks to global inflation and the Fed’s insistence on draining the economy of trillions of dollars of quantitative easing cash-SPDR Gold Shares is likely to fall 25-30% from its previous 2022 high to somewhere between 134-144. And then it will soar.
Gold and blue-chip stocks get hammered at the onset of a recession for two reasons-margin calls and corporate bond defaults. When the global economy sours, this unwinding of shaky credit becomes the engine of the stock market’s plunge. Liquidators are motivated to sell the debtor’s high value equities first, before their value falls in a liquidator driven sell-off.
But this isn’t the only market force affecting this precious metal. While the above scenario temporarily exerts downward pressure on gold, once the margin calls and corporate bond defaults run their course, gold will take off. The overall mistrust of the marketplace during a recession drives investors away from the fragile stock market and into history’s most popular hedge-gold bullion, perceived the world over as a reliable investment, especially in a bad economy.
Inflation is certain to fuel gold’s rise even higher for the simple reason that it will take an ever-increasing amount of fiat currency to buy an ounce of gold. Moreover, investors have relied on gold as an effective hedge against currency depreciation for centuries.
Why We Have Inflation And Why It’s Going To Last
One thing we learned in Econ-101 is that when a government increases its money supply the predictable result is more paper currency chasing the same amount of goods and services. If these increases in fiat currency are not met by a proportional increase in goods and services, the higher money supply will eventually result in currency depreciation, also known as inflation.
In reaction to the stock market collapse of September 2008, the Federal Reserve launched its first official round of quantitative easing, buying hundreds of billions of dollars of mortgage-backed securities, bank debt, Treasury notes, and other financial instruments. As a result, the stock market was flooded with Fed “easy money”. The Fed was fully aware that the biggest risk-factor in quantitative easing was inflation, but Fed officials had all of that in hand-until they didn’t.
US government debt to GDP rose to 123% by the end of 2021, based on a national debt that is now slightly over $30 trillion. Both figures are at historic highs, even higher than WWII. The debt to GDP was 107% and rising even before the COVID-19 pandemic. Today’s debt to GDP is nearly twice what it was at the onset of the Great Recession of 2007-09 when it stood at 62%.
Total Public Debt as Percent of GDP (St. Louis Fed)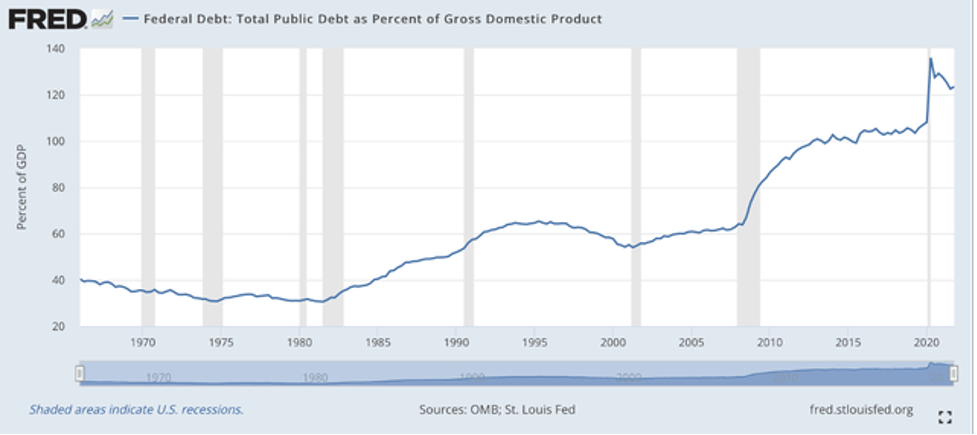
Meanwhile, the global debt to global GDP has soared to a stunning 368% on a debt of nearly $300 trillion.
Author created graph (International Monetary Fund, Reuters)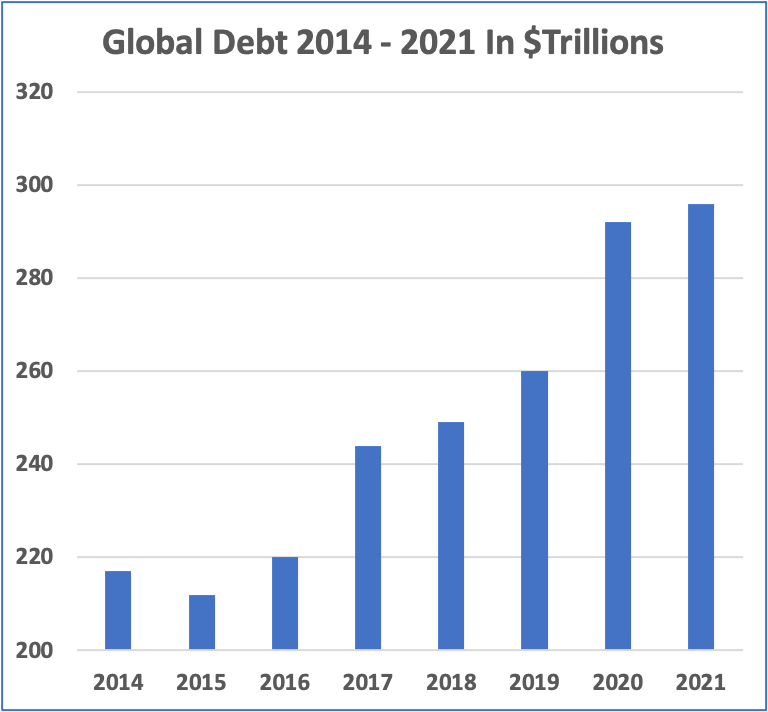
Some market watchers assume government stimulus, in reaction to the COVID-19 lockdowns, caused this sudden inflationary environment. While the stimulus did lead to an inflationary working class shopping spree, quantitative easing had already laid the ground for runaway inflation the way drought-stricken brushlands lay the ground for massive wildfires once lightning strikes. Pandemic stimulus may have ignited this current inflationary trend, but a decade-and-a-half of loose money policies around the world will keep this fire burning for quite some time.
Gold Mining Risks Are Running High
One nice thing about gold bullion is that it is already mined, purified, measured, and weighed. Gold mines are another story. Gold mining companies are notoriously expensive to operate. Since they make their profits on slim margins they tend to be hit hard by recessions and even harder by inflation, both of which are crashing on the shores of the global economy.
Inflation has impacted gold mining companies more so than the general marketplace. While inflation is running at 8.45% year-over-year, fuel costs have risen over 34%. Due to the rarity of gold, extracting it requires far more fuel per ounce than any other metallic ore, which means rising fuel costs can hit the gold mining industry particularly hard.
Higher labor costs are an even bigger headache. Mining companies report they are finding it increasingly difficult to recruit assistant drillers, claiming a new generation of job seekers is shunning the mining industry in favor of more stable jobs and desirable locations, as opposed to extremely remote areas with unpleasant climates and job sites that can change abruptly. This is bad news insofar labor comprises 53% of the gold mining industry’s overall costs of production. Any cost increases in this sector can badly gouge bottom lines.
Author created graph (Barrick Gold Annual Report 2018 and 2021)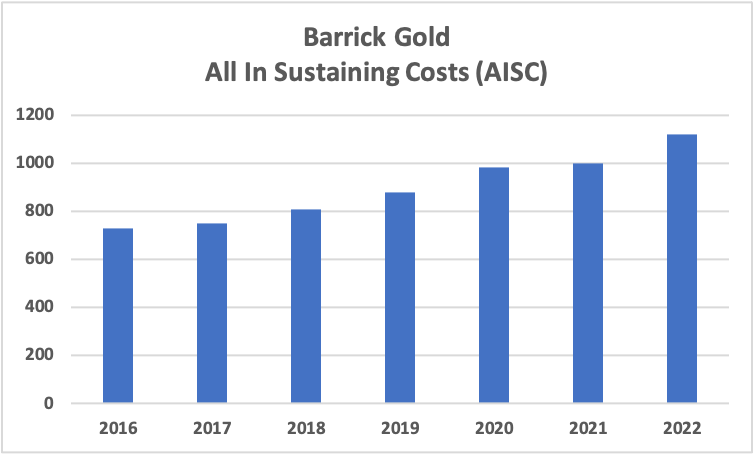
Worldwide, the cost of mining gold rose 27% between 2016 and 2021. The above bar chart shows how Barrick Gold’s (GOLD) costs of gold mining have been steadily rising. (The 2022 figure is an estimate from Barrick Gold’s 2021 annual report.) The company claims this is because of the depletion of higher-grade ore, which is easier and less expensive to mine than lower-grade ore. The dwindling supply of high-grade gold ore leads us to a long-standing prediction of how the world’s gold mining operations will eventually unwind.
Peak Gold
Improvements in mining technology have allowed miners of the past century to extract gold at a phenomenal rate. Since the beginning of human history, miners have extracted approximately 205,238 tons of gold ore. An astonishing two-thirds of that was mined after 1950.
“Peak gold” is a projected date wherein the amount of gold ore extracted from mines around the world reaches a peak, and then goes into decline. Various gold analysts have predicted that gold mining will peak somewhere between 2014 and 2025. While the 2014 call was premature, the chart below indicates gold mining may have peaked in 2019. Notice that with the exception of 2008, there is not a single year past 2007 where the global production of gold declined until 2020, when you have two annual declines in a row.
Author created graph (USGS, Kitco.com)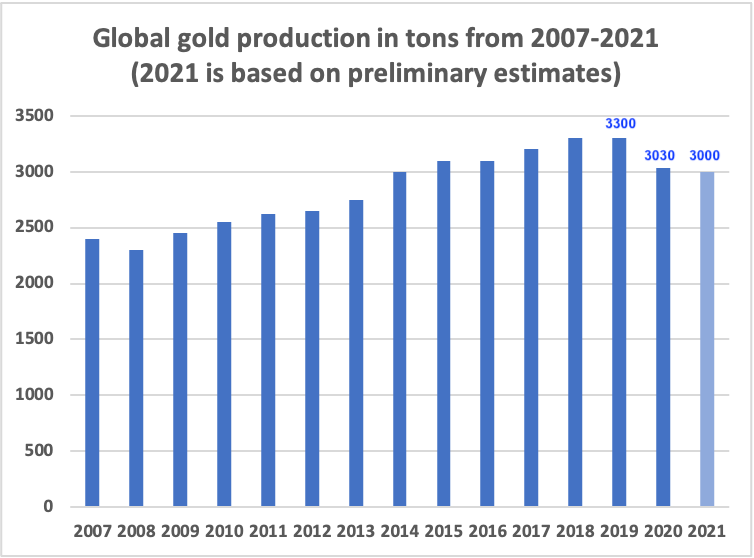
On the ground, the problem is simple. The gold ore that mining companies can easily and inexpensively extract is nearly gone. The gold that remains is increasingly expensive and laborious to mine. Now add inflation and labor shortages to this picture. When you sum it up, the global outlook for the gold mining industry is dim.
Gold Bullion
But the future for refined gold is brighter than ever. The expenses incurred by companies that mine this increasingly rare commodity is a major driver in the price of gold. Gold mining operations run on such narrow margins, they must sell their gold at a profit or they will quickly go bankrupt. As the price of gold increases, along with the expense of mining it, gold sitting in a vault rises in value with none of the risk factors and expenses that go hand-in-hand with the mining industry. Moreover, the very rarity of gold, as it is swiftly mined into that tipping point known as “peak gold”, will drive up the price as the marketplace catches on that gold is swiftly becoming a finite commodity.
The Best Bet On Gold Is SPDR Gold Shares
Having debuted on the New York Stock Exchange in November, 2004, SPDR Gold Shares is backed by a combination of physical gold bullion and cash. It is considered the largest gold-back ETF in the global marketplace, and is also traded on the Tokyo, Hong Kong, Singapore, and Mexican stock exchanges.
The graph below shows SPDR Gold Shares, solid orange, tracking very closely to the spot price of gold bullion, the orange line. This is likely why this gold-based ETF is one of the most popular among gold investors.
GLD vs Gold Bullion (TradingView; Seeking Alpha)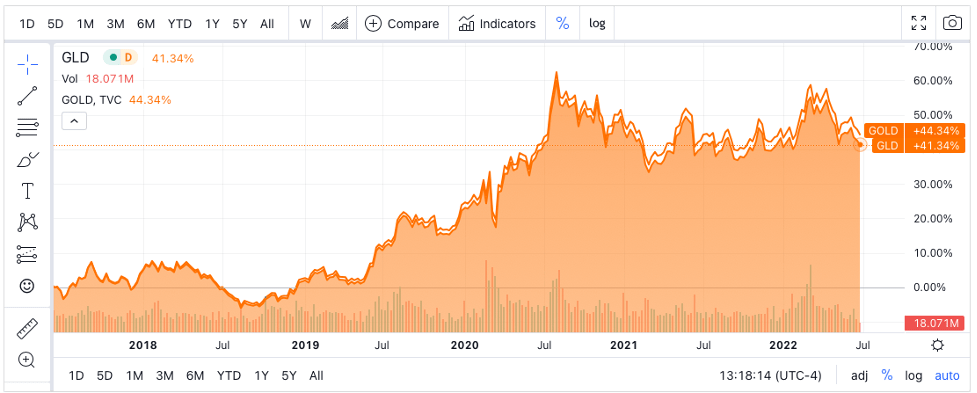
Some gold bugs may want to simply stack up on gold coins or ingots, but that requires an investment in a high-quality safe, as well as a completely secure location. Buyers of gold coins must also pay a premium, usually around five to eight percent of the spot price.
How SPDR Gold Shares And Popular Gold Mine Stocks Behave During Recessions
Some investors are under the impression that gold mining stocks are a better investment than a gold ETF because of those occasions wherein mining stocks rise faster than the price of gold. But while this does happen now and then, over the past decade and a half, SPDR Gold Shares has beaten the top two gold stocks soundly.
GLD vs S&P and Barrick during 2008 Recession (TradingView; Seeking Alpha)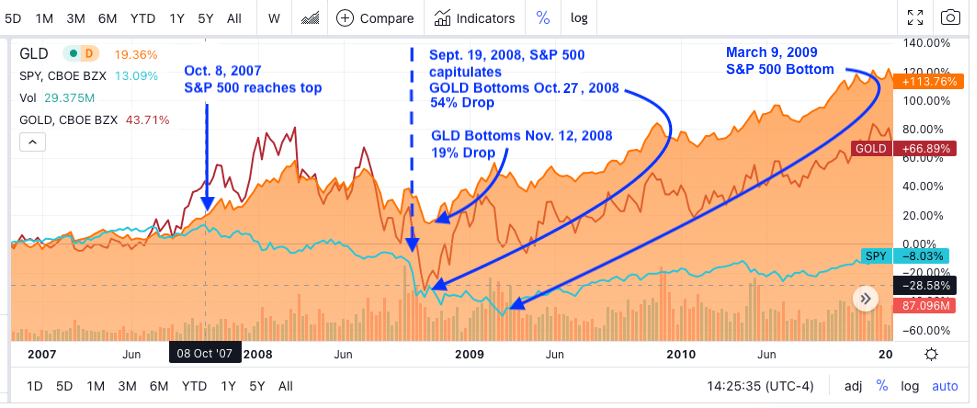
In the above chart, the solid orange graph represents SPDR Gold Shares ETF, the red line represents Barrick Gold Mines, and the green line represents the S&P 500. When the S&P 500 capitulated on Sept. 19, 2008, during the Great Recession, both Barrick Gold and SPDR Gold Shares dropped in tandem. Barrick Gold bottomed one month later on Oct. 27th after a dramatic 54% drop. SPDR Gold Shares bottomed 3 weeks later on Nov. 12th but dropped only 19%.
Not shown, starting Sept. 19, 2008, Newmont Corp. went from 42 to 22, a 48% drop.
Notice that even as SPDR Gold Shares was trailing Barrick Gold at the beginning of the recession, after recovering SPDR Gold Shares maintained its lead over Barrick Gold.
GLD vs Barrick and S&P 2020 Recession (TradingView, Seeking Alpha)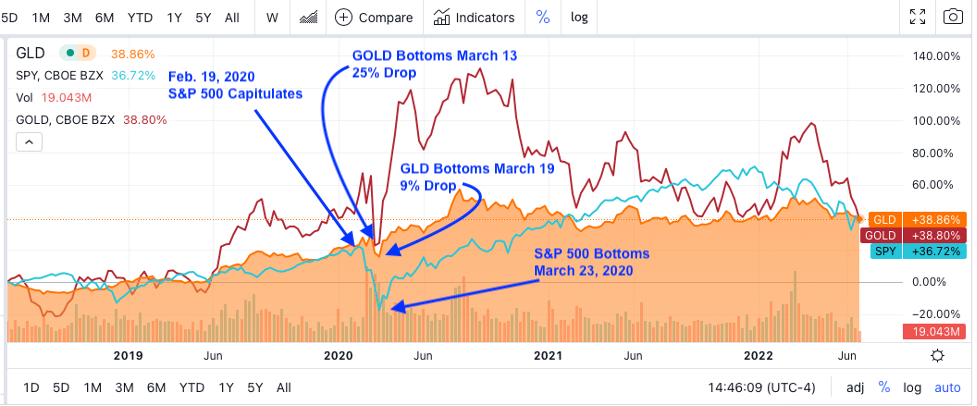
The chart above shows SPDR Gold Shares and Barrick Gold behaving similarly during the COVID-19 recession of 2020 as it did during the Great Recession. Once the S&P 500 capitulated on Feb. 19, both GLD and GOLD followed suit. Barrick Gold fell further, 25%, than SPDR Gold Shares at 9%, but it recovered several days sooner. Both gold equities recovered before the S&P 500.
Gold Equity Losses during Recessions (Author created chart)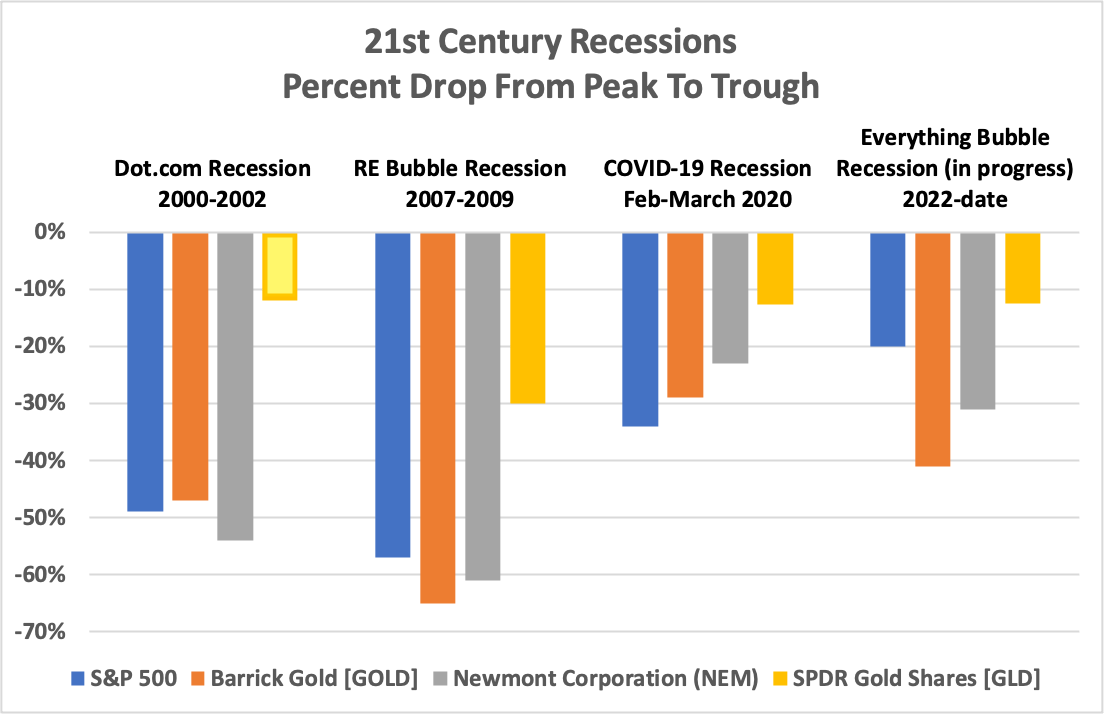
In the bar chart above, the percentages are derived from the peaks gold equities made, either slightly before or after the S&P 500 peaked at the onset of a recession, measured against the following troughs. The price of gold bullion was used as a stand-in for SPDR Gold Shares during the 2000 – 2002 Dot.com recession since that ETF did not exist then. Notice that SPDR Gold Shares (and its twin, gold bullion) lose far less value during a recession than the top two gold mines and the S&P 500.
The chart below shows SPDR Gold Shares soaring high above the top two gold mining stocks-Barrick Gold Mines (brown line) and Newmont Corporation (NEM) (gray line)-since 2007. It is possible the reason gold mines fall further and further behind the price of gold bullion over time is because of the peak gold effect mentioned above.
GLD vs GOLD and NEM since 2007 (TradingView, Seeking Alpha)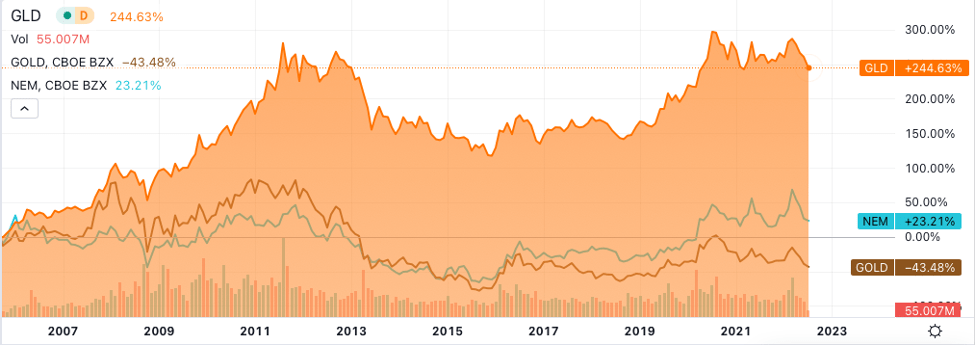
This is why investors interested in taking or maintaining a gold position should avoid gold mining stocks and go long on SPDR Gold Shares. Some gold bugs may want to simply go long on gold coins or ingots, but that requires an investment in a high-quality safe, as well as a completely secure location. Buyers of gold coins must also pay a premium, usually around five to eight percent of the spot price of gold.
Risk Of Buying SPDR Gold Shares ETF
While the price of SPDR Gold Shares has dropped 16% since its March 2022 high of 192 it is likely to drop further. It would be advisable to buy GLD somewhere around 144, which is a 25% drop from its recent high. But be aware, historical charts indicate it could drop more than 30%, which would put it below 134.
TradingView; Seeking Alpha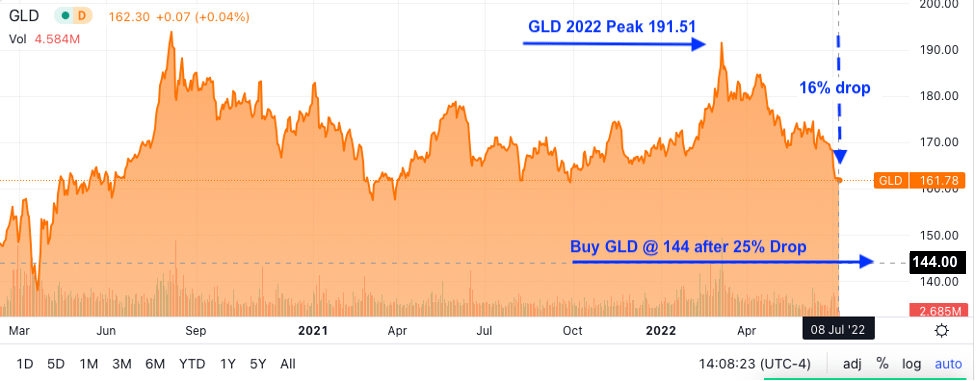
Summing It Up
Because the largest economies around the world have been engaged in quantitative easing, which erodes the value of the underlying currency, gold has become increasingly attractive to investors looking for an alternative to stocks. The problem with gold mining companies is that, due to the increasing rarity of gold ore, the expenses incurred by gold mining operations have been rising steadily, and are likely to continue to rise into the future, eating away at the corporate bottom line. This makes gold mines an increasingly risky bet. But insofar SPDR Gold Shares closely follows the price of gold bullion, and is backed by gold bullion and cash, this investment is likely to fare much better on into the future.
Be the first to comment