

chonticha wat
SPDR Gold Trust ETF (NYSEARCA:GLD) and iShares Silver Trust ETF (NYSEARCA:SLV) are something that investors can consider whether or not to include as a part of a diversified portfolio. Given that GLD and SLV are pureplay exchange-traded funds (“ETFs”) that respectively hold gold and silver (broadly speaking, 1 share of GLD = 0.1 ounce of gold, while 1 share of SLV = 1 ounce of gold), they are a liquid and convenient alternative to buying, owning and selling physical gold and silver, so I will use GLD and SLV below, except where the price history extends way back to before GLD and SLV were created.
Gold is definitely a reliable store of value, and it goes way back to ever since humanity had more goats and grain than they knew what to do with. But that doesn’t mean every day is a great day to buy. Given the current energy and geopolitical crisis in Europe, it is natural to wonder is this a great time to add to gold/silver? I would argue it is not a great time. Note that I am not advocating selling or even shorting GLD/SLV, I just don’t think the risk/reward is worth it at current prices to buy more. Here’s why:
Reason #1: Getting the buy point wrong could mean years of underperformance
Gold has done well from 1971 to 1980, 2000 to 2011 and 2018 to 2020 (silver experienced similar cycles, so I will just use gold as an example below). From 1980 to 2000 and 2011-2018, gold has gone nowhere. Had one bought at or even near cyclical peaks, you would have to be stuck with years of demoralizing losses with huge opportunity costs.
Instead of using a hypothetical purchase at the peak, let’s say an aspiring gold investor buys gold sometime in 1979 at $250 on the premise that the Fed will never be able to rein in inflation and we are headed for a monetary collapse (sound familiar?). To his astonishment and great elation, by 1980 gold prices momentarily topped $800 (depending on your source). Being the sophisticated investor, he knows not to buy when prices are going up vertically but he holds his gold, figuring the end is of history is near.
Gold price chart 1971-current
Gold price chart 1971-current (macrotrends.net)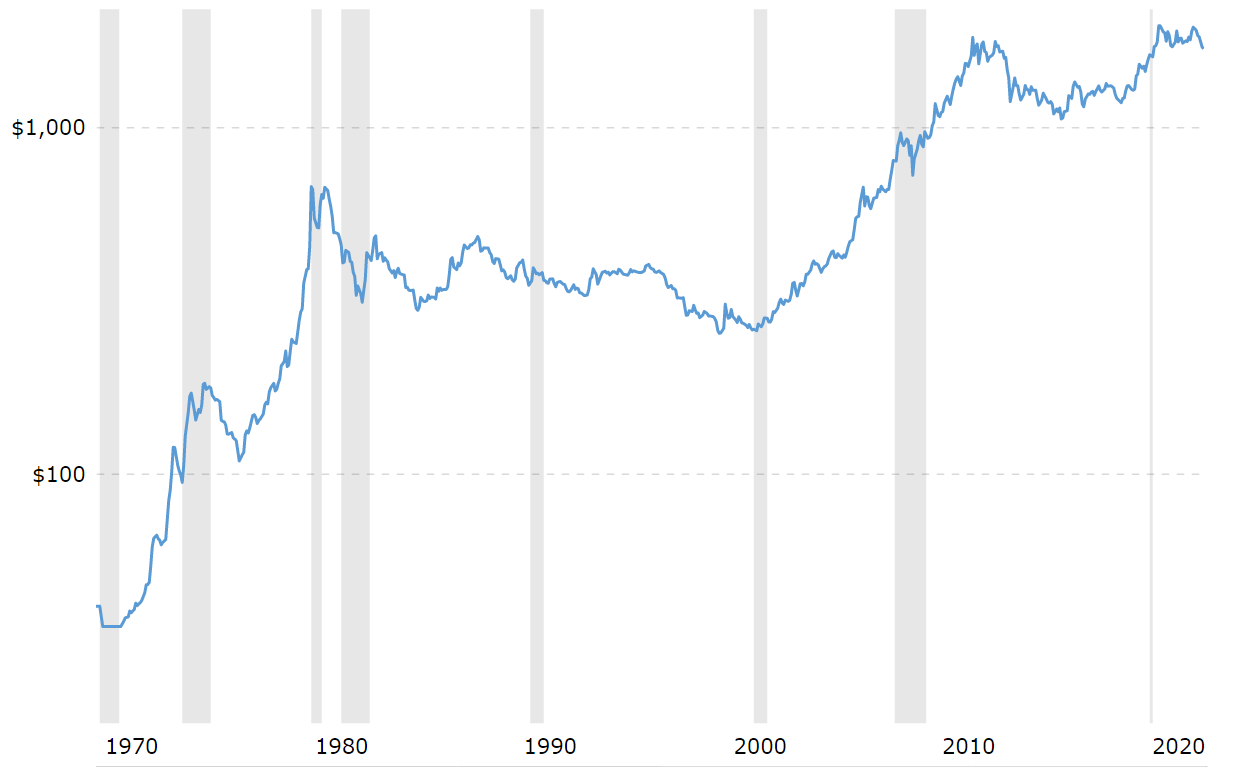
Fast forward to 1990, and by then there’s even a book on the end of history, U.S. equities have gone up several times in an unprecedented bull market and our patient gold investor sees gold at $400. Well, it’s still a profit right? Anyway, the stock market can fall 25% in a day and look at all these money printing crisis going on, with the Latin American sovereign debt crisis (that got solved by money printing), then the savings and loans debacle, all those things going on in Eastern Europe and the US financing fiscal expansion to fight the Cold War using monetary expansion.
By the year 2000, gold has fallen to $200 something, close to where our patient investor originally purchased it. It has yielded no dividends during that time and our patient investor is fed up with gold.
Or, consider a case of an investor who purchased gold when the U.S. sovereign debt rating was cut in 2012. He would’ve purchased at a price of $1700 or $1800/oz and end up watching in disbelief as both the European sovereign debt crisis unfold and the U.S. spends a record amount of time in fiscal deficits and unprecedented QE but seemingly with little impact on gold.
Reason #2: Scary headlines are not a reason to buy GLD and SLV
In the chart above, we can literally find hundreds of scary things happening from Cold War crises, savings and loans debacle, 1987 Black Monday stock market crash, First Gulf War, 911 and on and on. Most of them had an impact on gold that was negligible in the long run.
To give two recent examples:
1.Russia/Ukraine war: if you bought GLD at or around the time the Russian-Ukrainian war started, your purchase price would be around $192 (gold $2,000/oz ), maybe $180 (gold $1,900/oz) if you paid attention to the news and bought early. But I suspect most Seeking Alpha readers are not looking for a one-week 5% gain to sell and are in it for the long haul (after all, it’s Seeking Alpha, not Seeking Day Trades). Then one would see GLD slumping to below $160 six months later. The apocalypse did not happen and what did happen is that the Europeans have to turn their air conditioners up two degrees and wear more sweaters this winter.
GLD price since Ukraine war (stockcharts.com)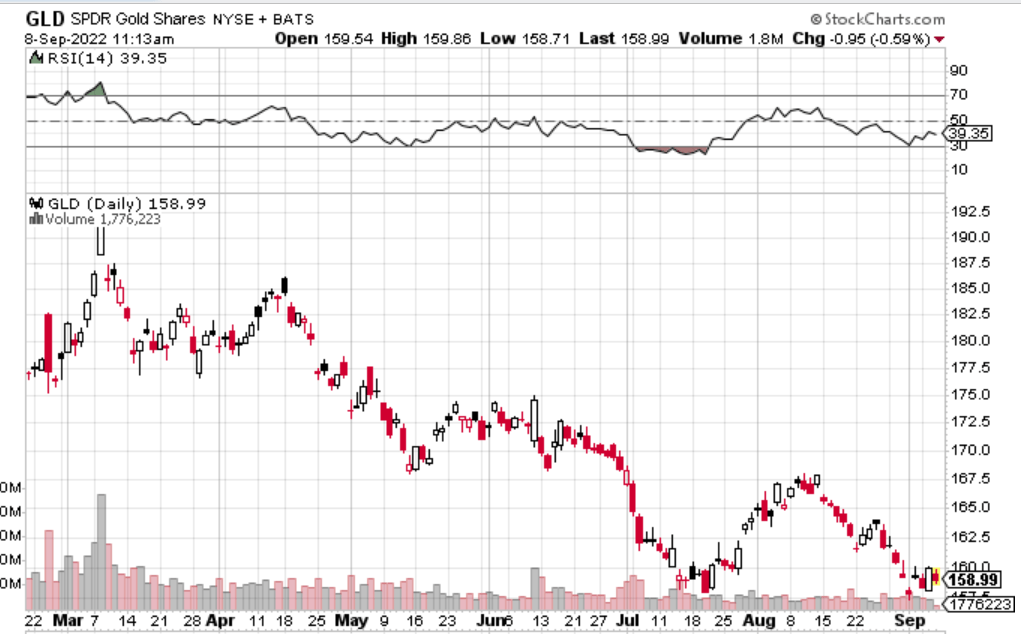
2.Coronavirus: So during the virus of the century (which if you look at excess mortalities, has arguably been as fatal as the Spanish flu), the U.S. and China traded fierce barbs including closing a consulate each on live TV. GLD spiked from $165 to $195 and then faltered for the next year and a half while bitcoin went from $10k to $60k and the U.S. and China returned to their favorite activity of investing in stocks and housing with all that excess liquidity.
GLD price from 2020-21 (stockcharts.com)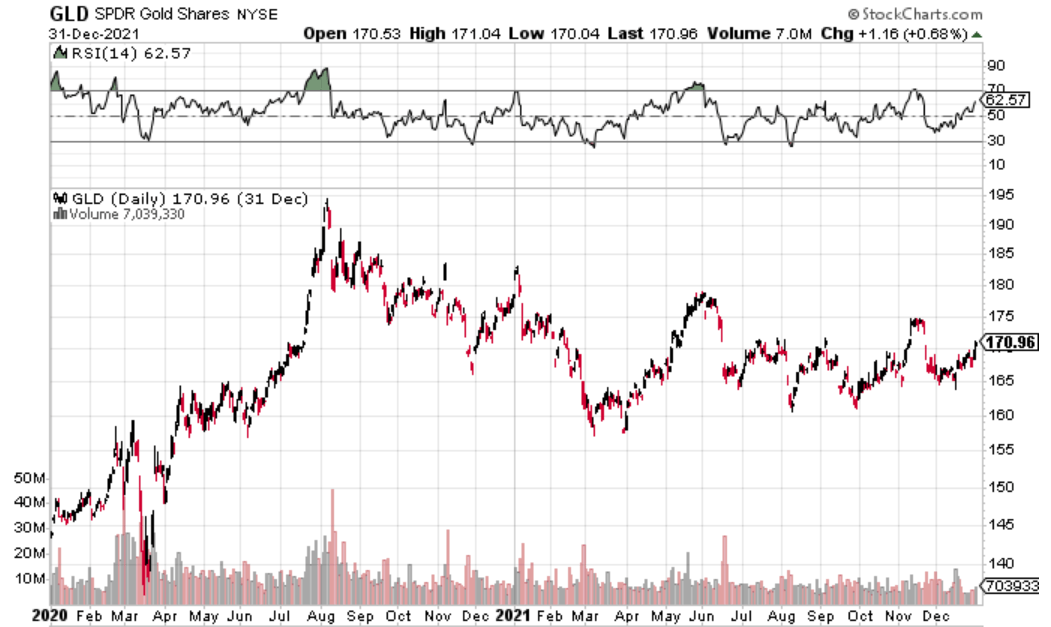
Reason #3: The Fed is tightening
Don’t fight the Fed. As discussed here, I expect the Fed to be hawkish and keep interest rates at higher levels for longer due to inflation from the natural gas supply disruption in Europe.
There are some statistics that counterintuitively show gold prices gained on average during Fed tightening cycles.
Gold returns during fed tightening (World Gold Council)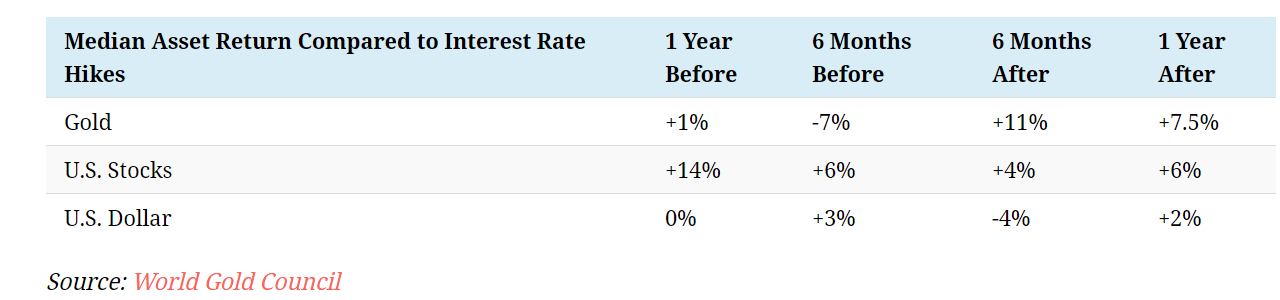
I think these are skewed by the rising gold prices during the two tightening cycles during late 1970s and mid 2000s. Shown below, the green boxes were rising gold prices during Fed tightening, while there was not much happening during the blue boxes. The tightening cycle starting 2015 also led to a period of lethargy in gold prices.
Gold returns during fed tightening (online, originally refers to Bloomberg)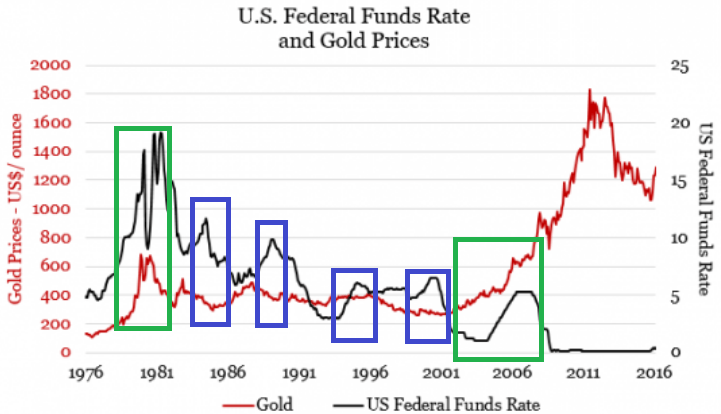
As to why the green boxes saw gold prices increasing despite Fed tightening, these were (I) periods where the Fed was gradually tightening off of a very easy money policy and (II) periods when the public was enamored with gold. In the 1970s, after a decade of inconclusive monetary policy, the U.S. public was enamored with gold, while in the 2000s, the Chinese and many developing countries were enamored with gold, having just re-entered international markets during a boom period for the first time in decades.
Reason #4: Recession is likely and gold/silver doesn’t perform well during recessions
Economists expect a high probability of a recession soon, which just increased with Russia’s latest cut of gas exports to Europe.
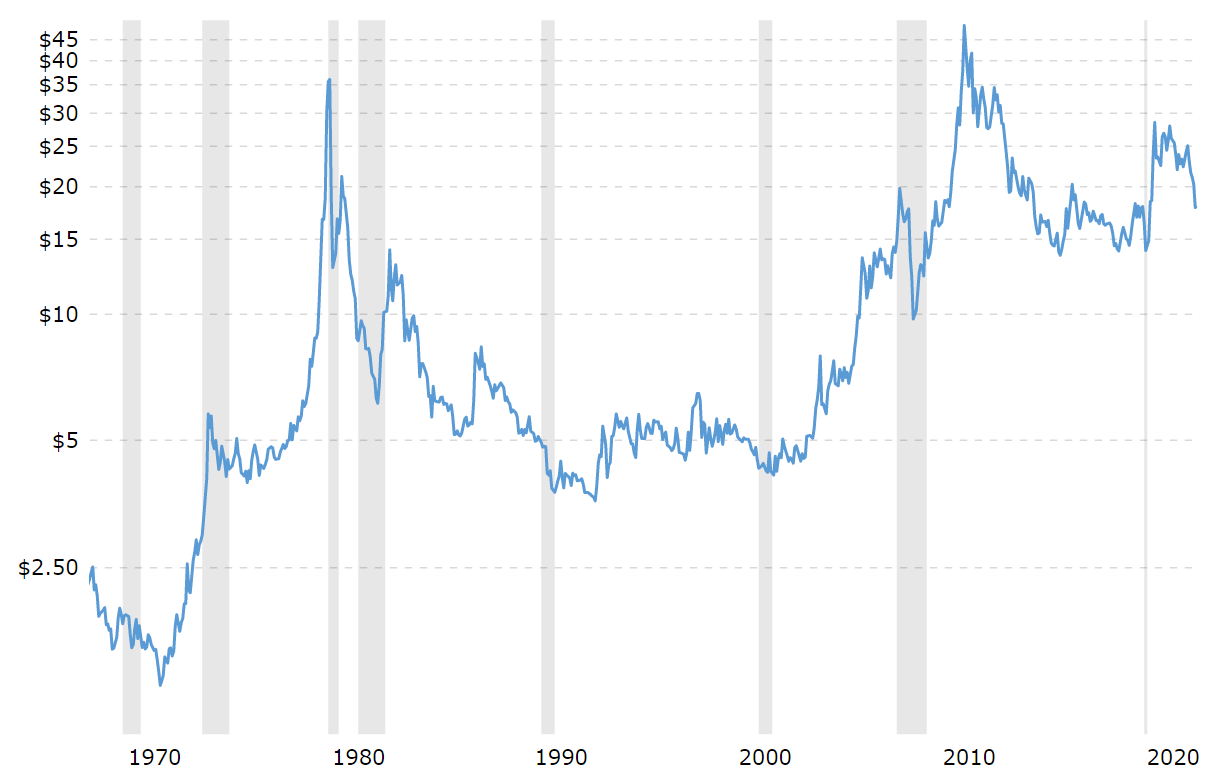
If we return to the chart below, you can see that gold and silver has not performed well in any recession (even in 2008) except the early 1970s but that was understandable because gold prices had just “floated” after Bretton Woods collapsed. In a recession people usually hunker down and don’t do too much and the institutions with cash (e.g., from hedge funds and family offices to gold mining corporations) are busy unwinding positions in anything to pay down their loans rather than speculatively buying something new. During the coronavirus panic, silver even hit a low of $11, which is really not what you want from a storage of value in a crisis.
Gold prices 1970 to current (macrotrends.net) Silver prices 1970 to current (macrotrends.net)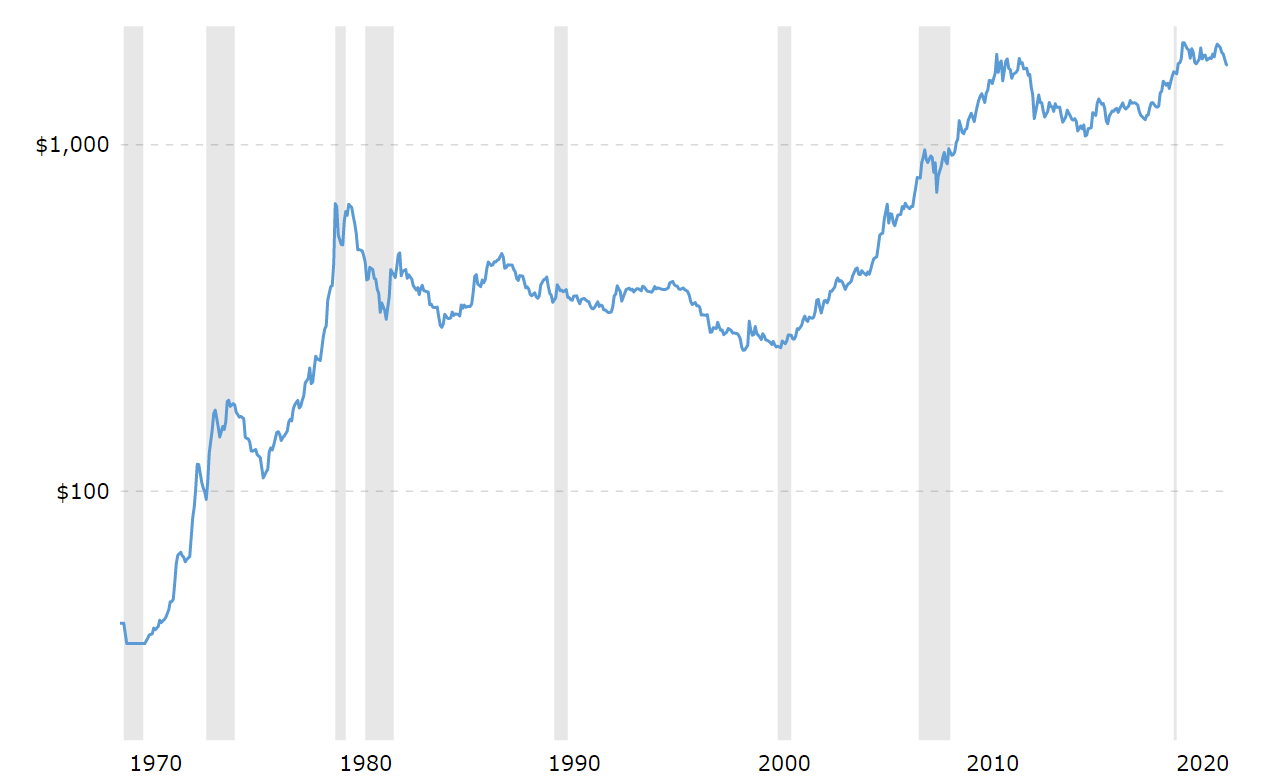
Reason #5: Demand growth is lackluster
Demand trends for gold and silver differ in nature so I’ll discuss separately.
Gold:
Gold supply and demand trends have not been favorable in the past decade. Gold supply has been increasing over the past decade (though some point out this has flatlined since 2016), while demand growth has been anemic in jewelry, industrial applications and even investment.
Gold supply and demand (World Gold Council)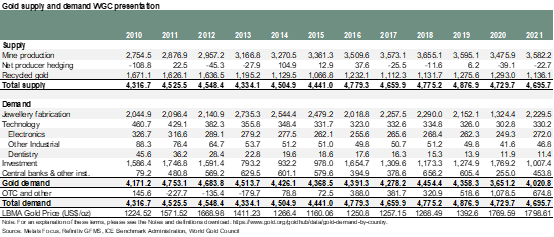
If we go back a decade further, gold demand was booming. Though jewelry demand decreased from 2001 onwards, investment demand was 1000 tons higher in 2009 compared to 2001. This huge inflow was an underpinning for the gold bull market in the 2000s, while interest in the 2010s has been anemic.
Gold demand 2000-2010 (World Gold Council)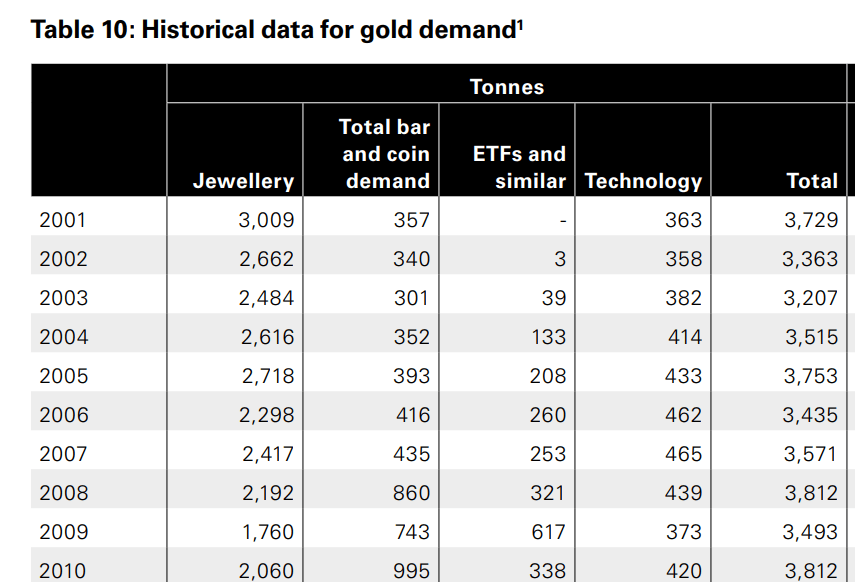
Silver:
Silver is a favorite for its green tech (especially in solar energy and electric vehicles) but it is an industrial commodity, around 50% of demand coming from industrial uses.
Silver supply demand (Silver Institute)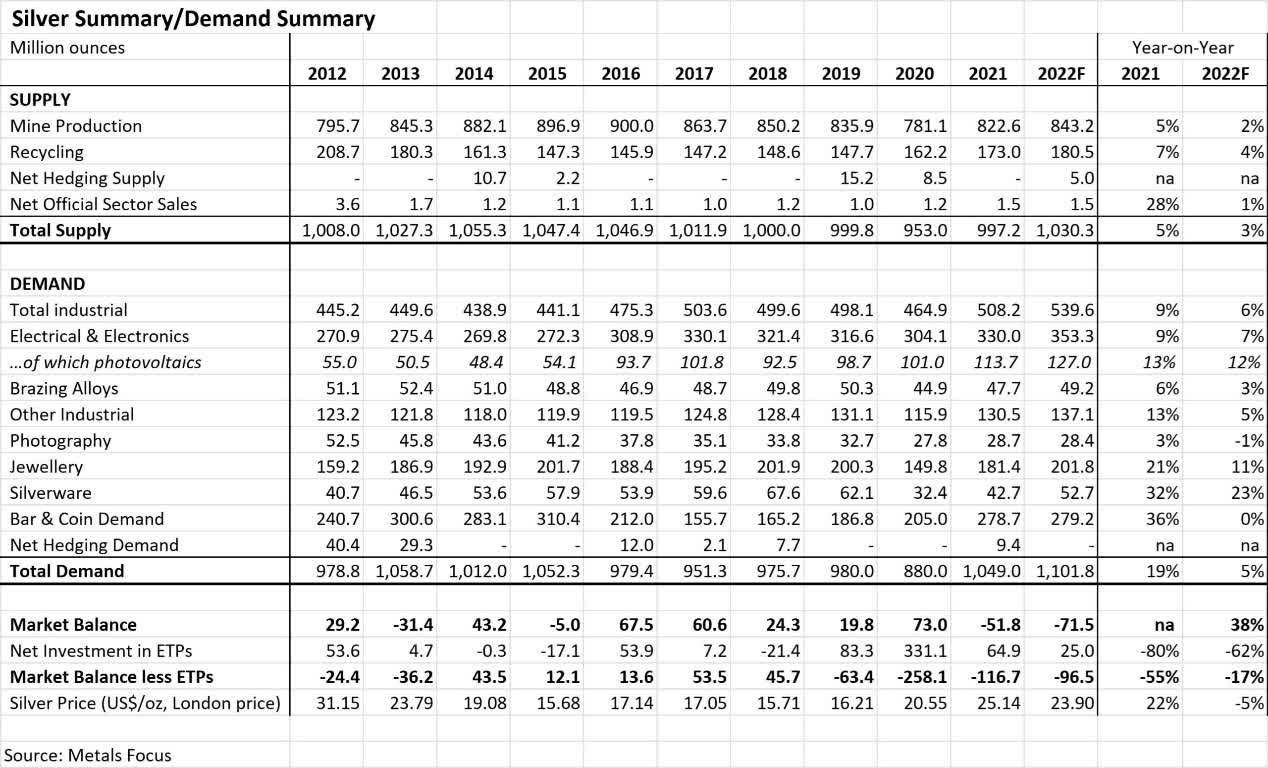
I would not expect silver to do particularly well this year for several reasons:
- As shown below, solar energy uses (photovoltaics below) is only 10% of total silver demand. Even if this demand increases by 20% this year, that’s 2% of total silver demand. And I think solar energy installation forecasts might be missed this year (or definitely not show too big a growth) because:
- Europe needs affordable energy now. Solar is an investment upfront which will payback over a long period in the future. Given Europe is already restarting or considering to restart coal and oil and nuclear power plants, it’s apparent they need something affordable to use right now, rather than make investments for the future.
- Solar has gotten very expensive this year because of the high demand but limited production capacity (most of it in China). Chinese solar cell production capacity is slated to growth tremendously this and next year, but before that new production comes online, solar demand isn’t going to reach its full potential.
- Even China is slowing its investment in solar this year because solar farms need to earn a certain IRR (even in China), and it doesn’t make sense to build them when the input prices are so high.
- All those supply disruptions in Europe from the energy situation and overall recession fears globally are going to impact industrial demand.
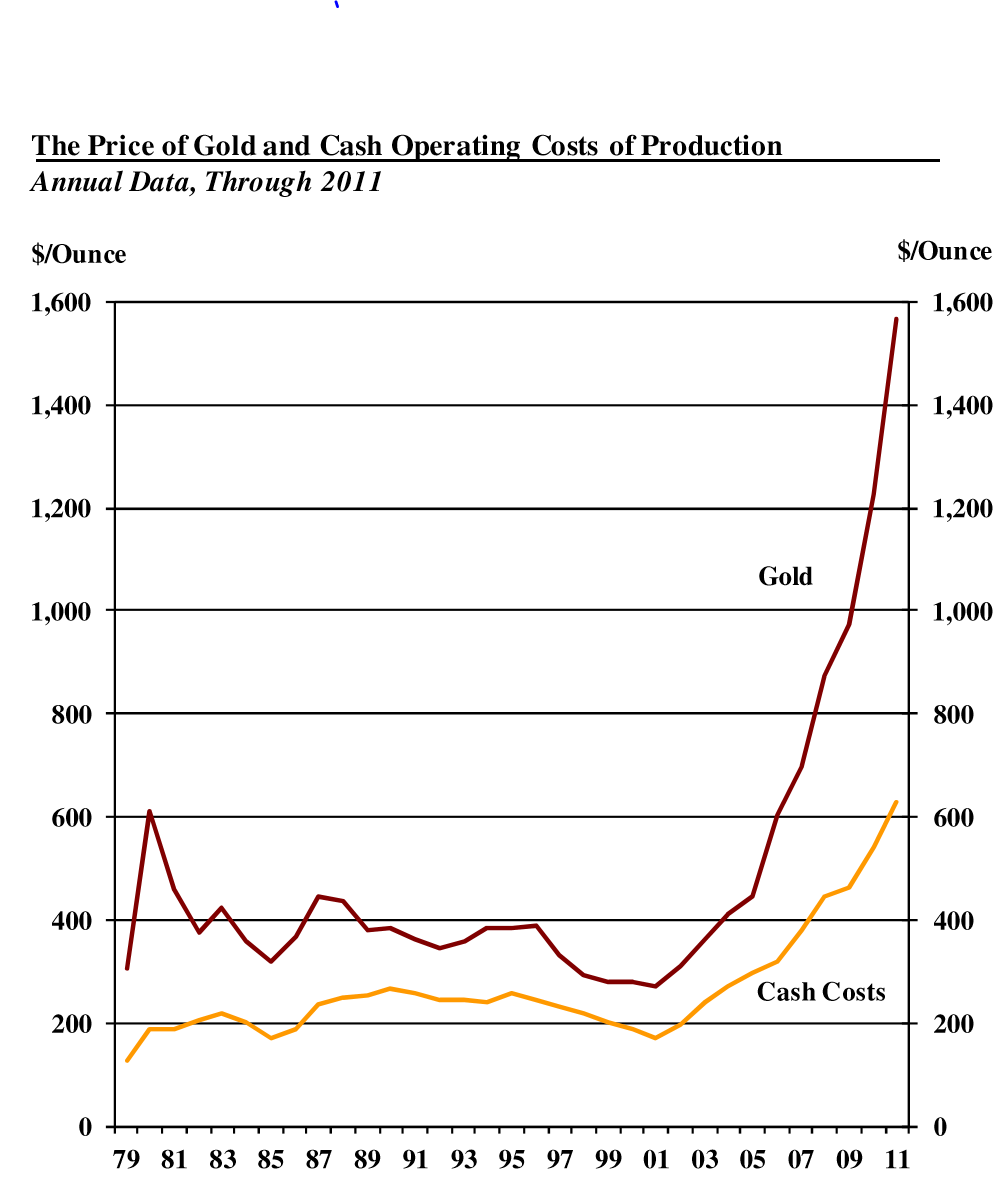
Reason #6: Gold and silver are way above their costs
For gold, it is safer to buy when the price is relatively closer to the cost. Below are costs from 2012-current from World Gold Council and 1979-2011 from CPM investment. AISC (all-in sustaining costs) is a tricky statistic.
Now I can definitely see a long-term bull case for gold here: AISCs have finally been increasing steadily since 2016 ($800s//oz) to well over $1000/oz in 2021. But this is still far from $1750/oz and in a cash-strapped recession, gold mines and every player in the supply chain will want to sell for cash rather than hold too much in inventory.
Gold AISC (World Gold Council) Gold cash costs 1979-2011 (CPM group)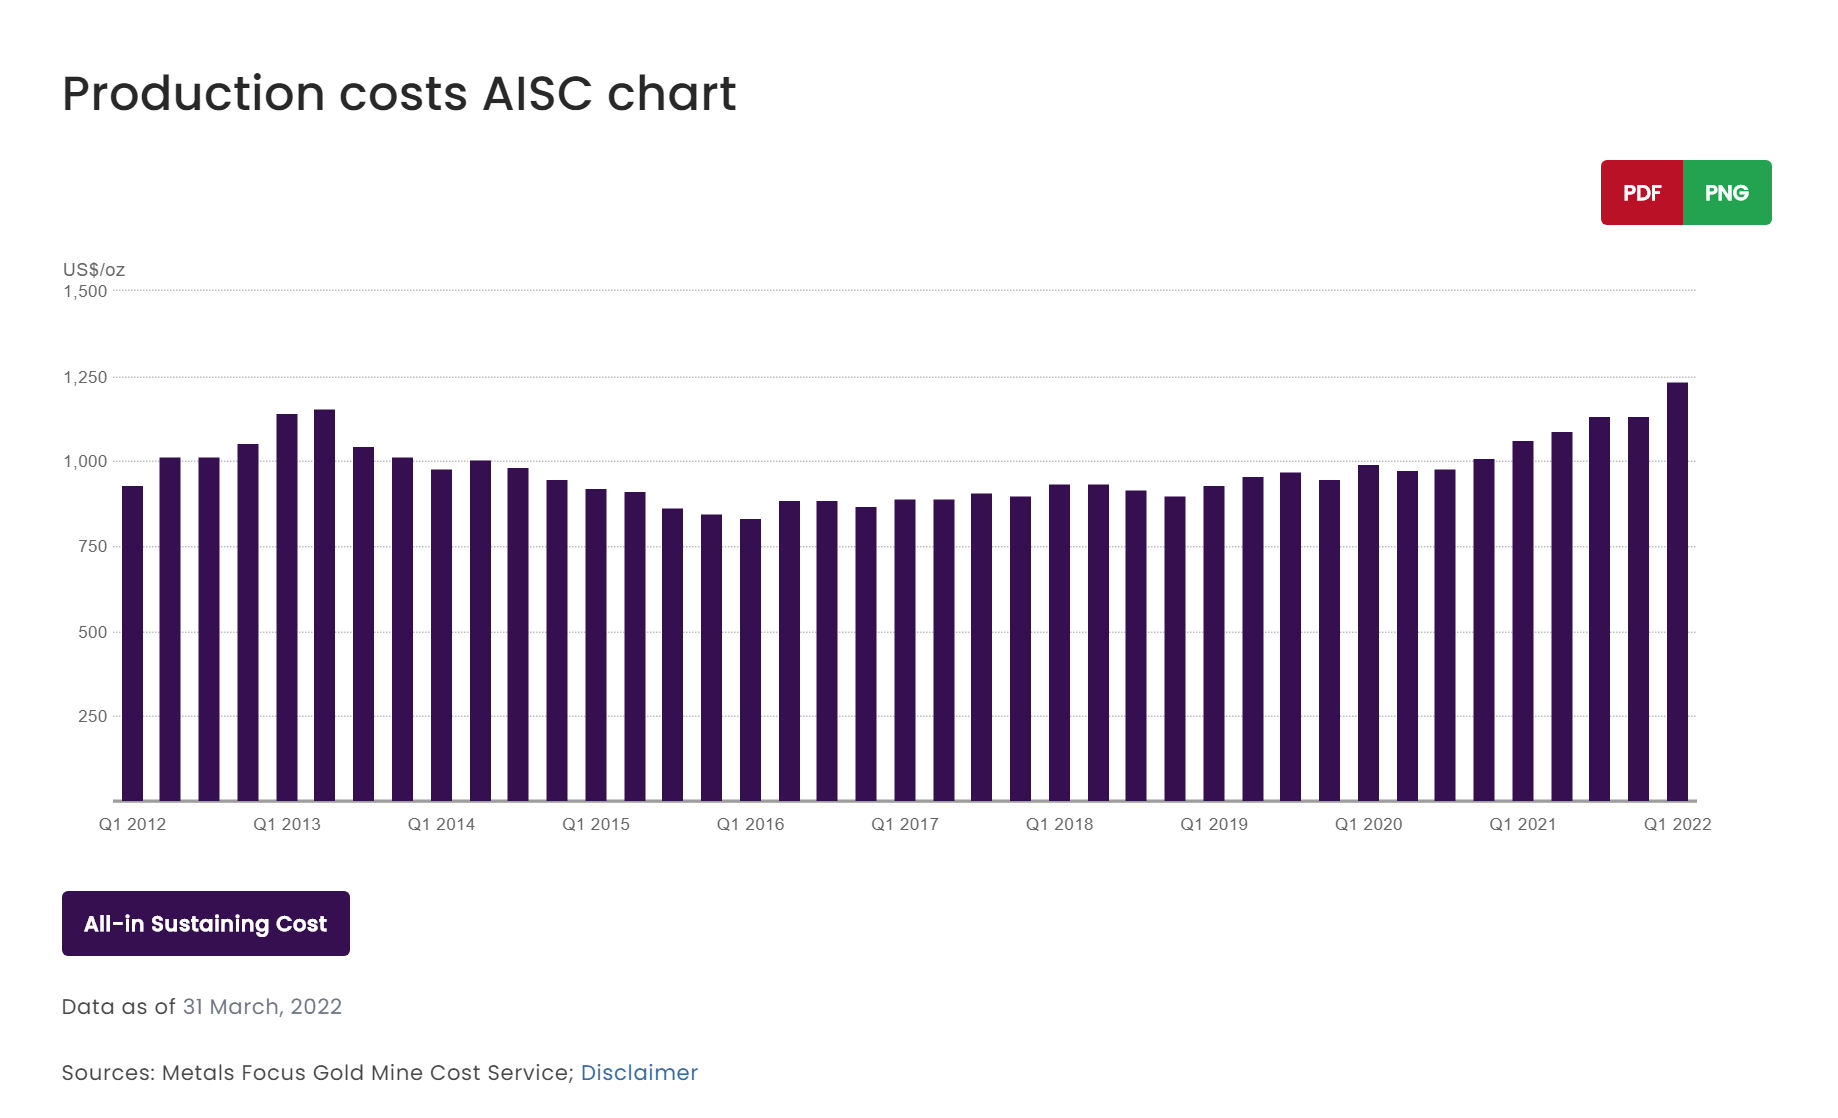
Silver costs are a bit trickier, given much of it is mined as a byproduct. Per the Silver Institute, primary silver mining) all-in sustaining costs in 2021 was US$10.88. Of course the marginal producer might be higher as shown in the below tally from mining.com article, but given the lackluster performance of many silver miners in the past, I would not be surprised if prices fall to below marginal costs during a recession.
Silver has been more volatile compared to gold – during the COVID crisis, SLV fell from $17 to $11 low while gold only fell from $160 to $136 low.
Summary:
GLD and SLV have their place in an investor’s portfolio (even I have some physical gold because “you never know”). Note that I am not advocating selling or shorting GLD/SLV, I just don’t think the risk/reward is worth it at current prices to buy more for the reasons explained above.
Be the first to comment