

Sundry Photography/iStock Editorial via Getty Images
I can still remember how Gilead Sciences (NASDAQ:GILD) was a darling of many Seeking Alpha writers and website visitors around the year 2015. The company started paying a dividend during this year and the cash was flowing through the windows thanks to the wildly successful hepatitis-C treatment Harvoni.
After this, the tables have turned. There were controversies about the price of Harvoni, which generated over $19B in revenue for Gilead in the year 2015 alone. After the peak years of 2015 and 2016, revenue from Harvoni started to drop, and Gilead’s pipeline was not strong enough to make up for this. As a result, its total annual revenue dropped by about $10B between the years 2016 and 2019, as you can see in graph 1 below.
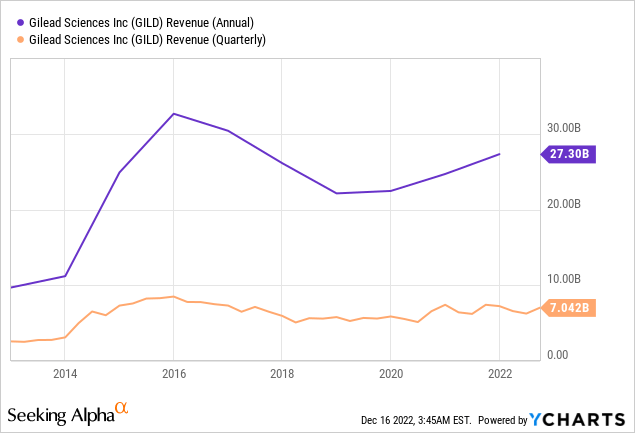
Graph 1: Gilead Sciences revenue over the last decade (Source: YCharts)
In graph 2, you can see the result this revenue drop (and the expectations of investors) had on Gilead’s share price: it more than halved between its high at the end of 2015 and its low in 2020.
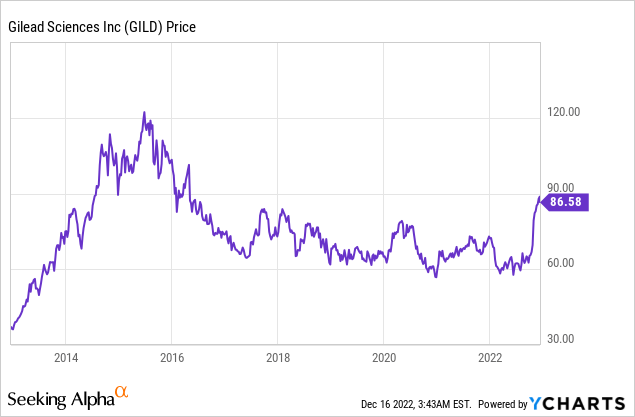
Graph 2: Gilead Sciences share price over the last decade (Source: YCharts)
Transformation
Gilead experienced a major transformation during the years between 2016 and now. While their revenue stagnated, the company made serious work of diversification and Gilead did two major acquisitions (and multiple small ones): Kite Pharma in 2017 for $11.9B and Immunomedics in 2020 for $21B. This extended the scope of Gilead’s portfolio to cell therapy and oncology treatments.
Just take a look at the product sales of Gilead in the different quarters of 2016, and compare them with the product sales of Q3 2022.
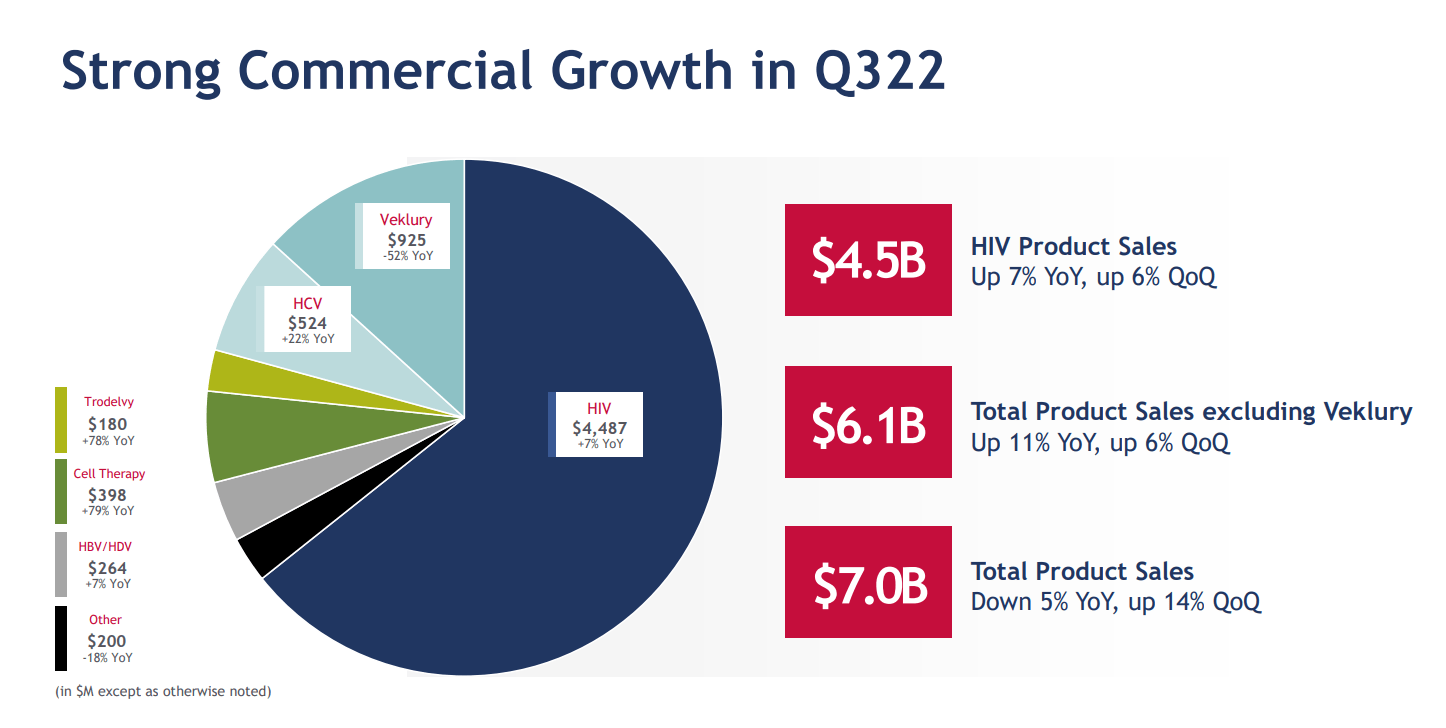
Figure 1: Gilead Sciences full year 2016 earnings presentation (Source: Gilead Sciences’ website) Figure 2: Gilead Sciences Q3 2022 earnings presentation (Gilead Sciences’ website)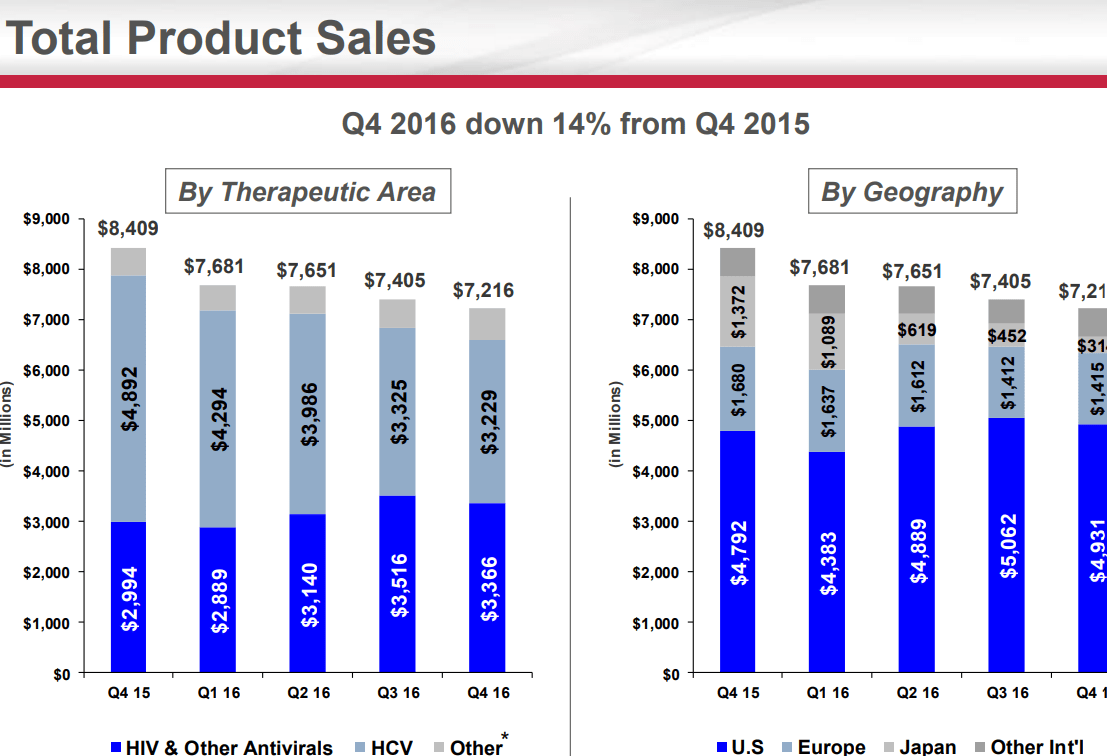
In 2016, Gilead’s revenue almost completely depended on two major areas: HCV and HIV. Nowadays, HIV treatments make up for the largest part of Gilead’s revenues, with HCV still a good second, if we exclude remdesivir (Veklury) sales which might be considered to be a non-recurring additional revenue. Since Veklury is used to treat hospitalized covid-19 patients, it is expected that the sales of Veklury will stagnate quickly during the coming quarters, more or less in line with the pandemic.
Although the two biggest sources of revenue remain the same, HIV has gained importance for Gilead. Also, note that the total quarterly revenue of Gilead in Q3 2022 is not so very different from the total revenue in Q4 2016.
What is different though, is Gilead’s other treatments which are quickly gaining traction. Most notably, revenue of the treatments which Gilead acquired with their acquisitions of Kite Pharma (Cell Therapy) and Immunomedics (Trodelvy) grew by 78 and 79 percent on a year-on-year basis. Although both of these revenues started from a lower base (they bring in less than $400M and $200M of revenue), this growth remains impressive. So even if the rest of Gilead’s portfolio would consolidate (and in the case of Veklury, stagnate quickly), their cell therapy and oncology treatments could prove to be major drivers of growth in the near future.
Dividend and other financial metrics
As a long-term investor, I am always very interested in the development of the dividend payout of the companies in which I am investing. For Gilead, this is how their dividend looks since 2015 when they started paying a dividend for the first time:
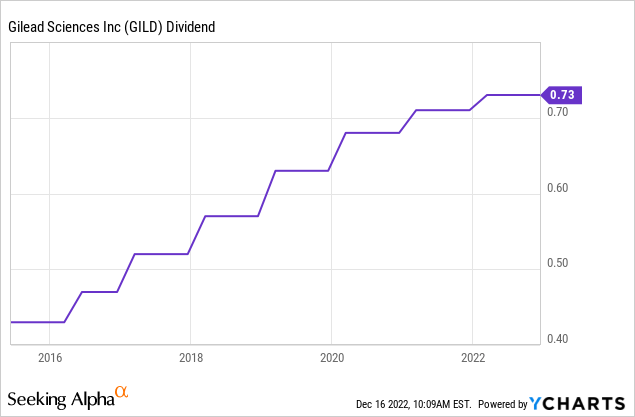
Graph 3: Gilead’s quarterly dividend since 2015 (Source: YCharts)
As you can see, even though the dividend increases look to be decelerating during the last couple of years, Gilead seems very committed to paying their shareholders an increasing dividend. You can find the following slide in their quarterly earnings presentation:
Figure 3: Gilead Sciences Q3 2022 capital allocation priorities (Gilead Sciences’ website)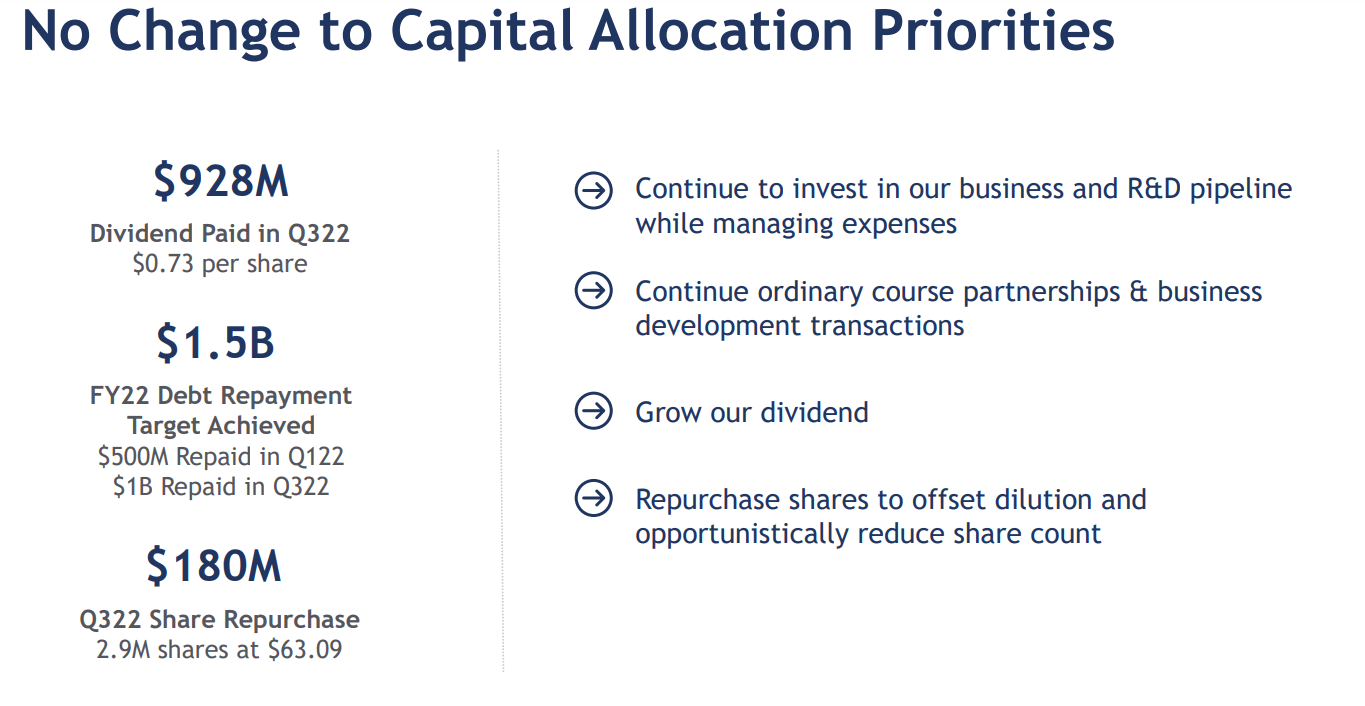
So the company is committed to growing its dividend and repurchasing its own shares, to at least make sure the stock is not diluted.
Now, let us briefly look at Gilead’s earnings per share and their P/E ratio (GAAP), to be able to estimate whether it could be a good moment to purchase the stock.
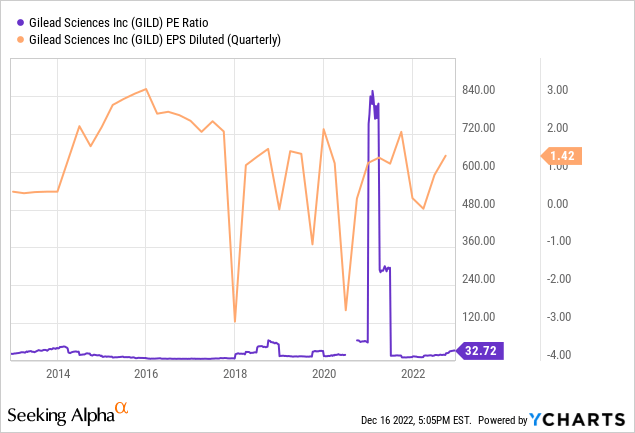
Graph 3: Gilead’s PE ratio (GAAP) and diluted quarterly EPS during the last 10 years (Source: YCharts)
With some notable fluctuations, Gilead’s quarterly earnings per share are still at a lower level than during 2015-2016. The extreme spike in price-to-earnings ratio was caused by their quarter of negative earnings in 2020 which became slightly positive on a year-to-year basis and then sent their P/E ratio sky-high. Currently, Gilead’s current P/E ratio is more than 30, based on GAAP earnings, which seems quite expensive.
When we look at their forward P/E ratio (non-GAAP), combined with the estimates of their earnings per share during the next year, the stock looks relatively cheap again with a ratio of just above 12:
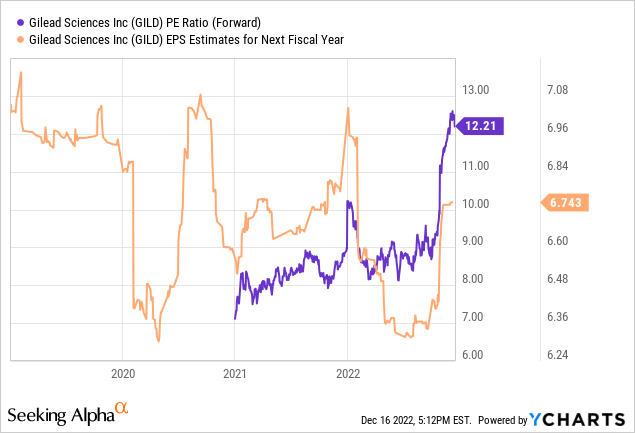
Graph 4: Gilead’s forward PE ratio (non-GAAP) and EPS estimates for the next fiscal year (Source: YCharts)
Since the shares of Gilead already gained approximately 50% during 2022, the late jump in forward P/E ratio can be explained, which is not so visible in Graph 3 because of the scale of the y-axis.
Please take notice that the P/E ratio in graph 3 is based on GAAP numbers, while the forward P/E ratio in graph 4 is based on non-GAAP numbers. We can see below in the 2022 guidance of Gilead that their GAAP and non-GAAP earnings per share can be very different:
Figure 4: Gilead Sciences Q3 update of 2022 guidance (Gilead Sciences’ website)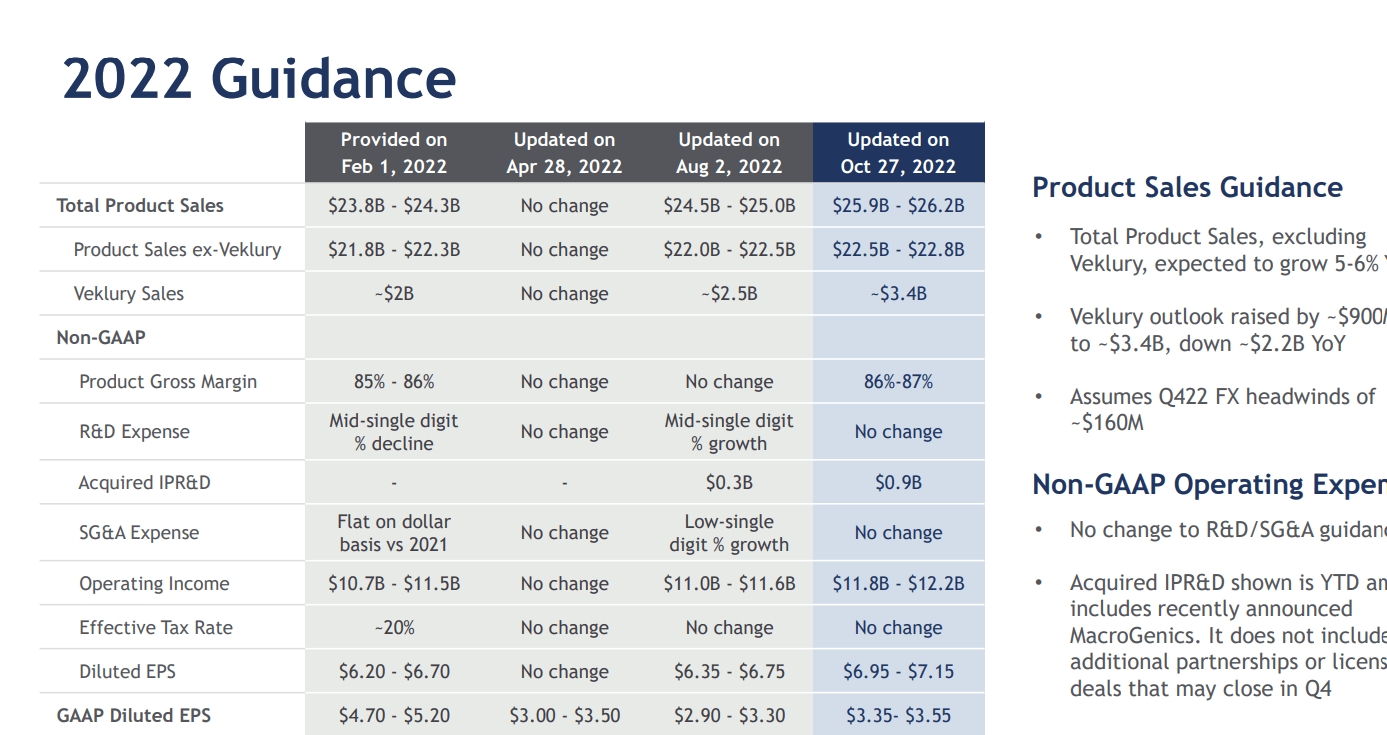
If we use the forward GAAP earnings per share to calculate the P/E ratio of Gilead, we can use 4.87 as expected GAAP earnings for the next fiscal year, as you can see in the following graph:
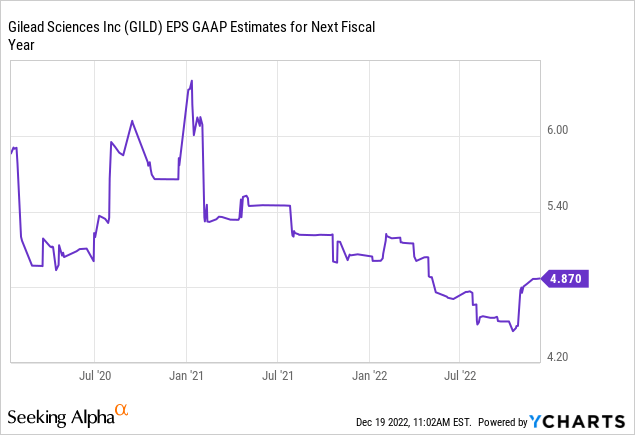
Graph 5: Gilead’s forward earnings per share estimate (GAAP) for next fiscal year (Source: YCharts)
Gilead’s GAAP forward P/E ratio can be calculated to be 17.7, while we saw earlier that their non-GAAP forward P/E ratio is 12.2. This is a large difference, and while 12.2 seems to be quite low, 17.7 does not look very cheap, but not screamingly expensive either.
Conclusion
Gilead truly seems to have risen from its own ashes. Although the company was by no means dead, the fantasy and expectations surrounding its stock were. These two factors seem to have returned with a vengeance, spurred on by the growth of Gilead’s cell therapy and oncology treatments.
The stock looks relatively cheap when we use expected data of earnings (GAAP P/E of 17.7, non-GAAP of 12.2), but expensive when we use actual data from the last years (GAAP P/E of 32.7). The truth is likely somewhere in the middle: after a period of undervaluation, I believe Gilead stock is now fairly priced. Not too expensive, not too cheap. Still, with a dividend yield of 3.3% and good future prospects, Gilead could still be a good addition for both long-term investors and trend followers, since their short-term trend is clearly up. I have been an owner of their shares since 2016 (so yes, I have been in the red for a very long time), and I am not selling.
Be the first to comment