

GBP/USD started a fresh decline from well above the 1.3250 level. EUR/GBP is also declining and trading below the 0.8350 support zone.
Important Takeaways for GBP/USD and EUR/GBP
· The British Pound started a fresh decline from well above 1.3250 against the US Dollar.
· There was a break below a key contracting triangle with support near 1.3170 on the hourly chart of GBP/USD.
· EUR/GBP failed to stay above 0.8380 and started a fresh decline.
· There was a move below a major rising channel with support near 0.8335 on the hourly chart.
GBP/USD Technical Analysis
The British Pound struggled to settle above the 1.3280 resistance zone against the US Dollar. The GBP/USD pair started a fresh decline below the 1.3250 support zone.
There was a clear move below the 1.3220 level and the 50 hourly simple moving average. The bears pushed the pair below the 1.3200 level. There was a break below the 50% Fib retracement level of the upward move from the 1.3120 swing low to 1.3298 high (formed on FXOpen).
Besides, there was a break below a key contracting triangle with support near 1.3170 on the hourly chart of GBP/USD.
The pair is now trading below the 76.4% Fib retracement level of the upward move from the 1.3120 swing low to 1.3298 high. It seems like the pair might continue to move down towards the 1.3130 support zone.
The next major support sits near the 1.3120 level. Any more losses could lead the pair towards the 1.3050 support zone. On the upside, an initial resistance is near the 1.3175 level.
The next main resistance is near the 1.3185 zone (the previous support) or the 50 hourly simple moving average. A clear upside break above the 1.3185 and 1.3200 resistance levels could open the doors for a steady increase in the near term.
EUR/GBP Technical Analysis
The Euro started an upside correction from the 0.8300 zone against the British Pound. The EUR/GBP pair climbed above the 0.8350 pivot level, but it failed to clear the 0.8380 resistance.
A high was formed near 0.8369 and the pair started a fresh decline. There was a clear move below the 0.8350 level and the 50 hourly simple moving average. The pair traded below 50% Fib retracement level of the upward move from the 0.8295 swing low to 0.8369 high.
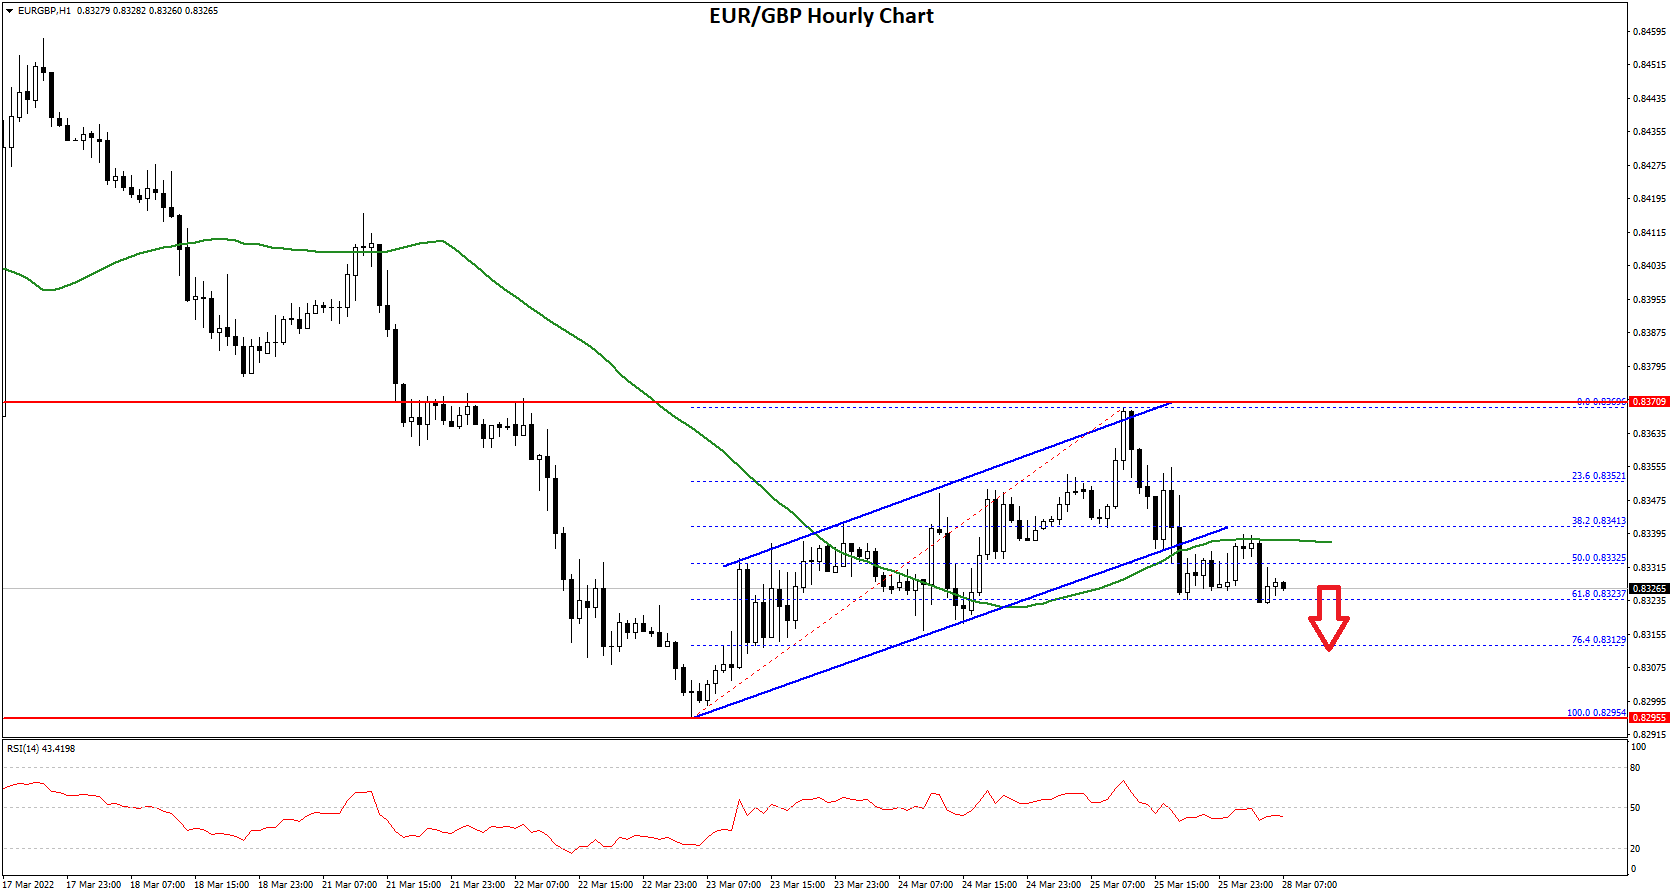
Besides, there was a move below a major rising channel with support near 0.8335 on the hourly chart. It is now consolidating losses and trading near the 61.8% Fib retracement level of the upward move from the 0.8295 swing low to 0.8369 high.
On the downside, an initial support is near the 0.8320 level. The next major support is near 0.8300 level. A downside break below the 0.8300 and 0.8295 support levels might call for more downsides. In the stated case, the pair could decline towards the 0.8220 support level in the near term.
On the upside, the pair is facing resistance near the 0.8335 level and the 50 hourly simple moving average. The next major resistance for the bulls is near the 0.8350 level. A clear move above the 0.8350 resistance might push the price higher.
The next main resistance on the upside is near the 0.8380 level, above which the pair could even climb above the 0.8420 resistance or 0.8440.
This forecast represents FXOpen Markets Limited opinion only, it should not be construed as an offer, invitation or recommendation in respect to FXOpen Markets Limited products and services or as financial advice.

Be the first to comment