

ADDRicky/iStock via Getty Images
Investment Thesis
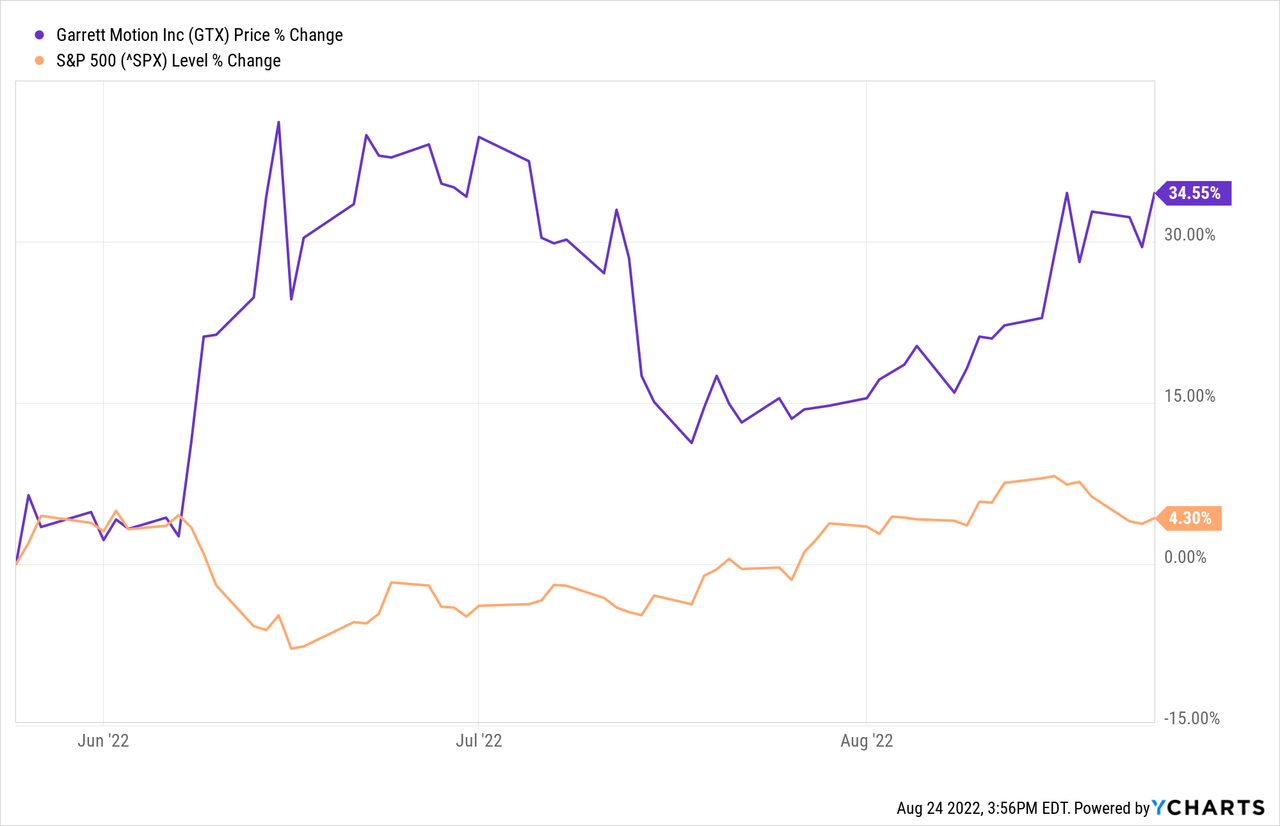
Garrett Motion Inc. (NASDAQ:GTX) is up over 34% since I last covered it, outperforming the market by 30%. The company has come a long way since emerging from its bankruptcy in 2021 and boasts exceptional progress.
The company’s Q2 reports appear to be underwhelming because of a stagnant topline, affected by macroeconomic factors, especially the weak Euro situation. The company is showing good progress in deleveraging its balance sheet with the early redemption of its Series B stock.
I am bullish on the stock as it is still undervalued despite promising growth prospects.
Topline Prospects Are Intact
Garret Motion’s revenue suffered a YoY decline in the MRQ because of macroeconomic headwinds, including depressed volumes due to the global semiconductor shortage, China’s lockdowns, currency translation loss, and supply chain constraints. The company has a duopoly along with BorgWarner (BWA), which significantly improves its pricing power, facilitating the company in offsetting these setbacks by inflation pass-through.
GTX Investors’ Presentation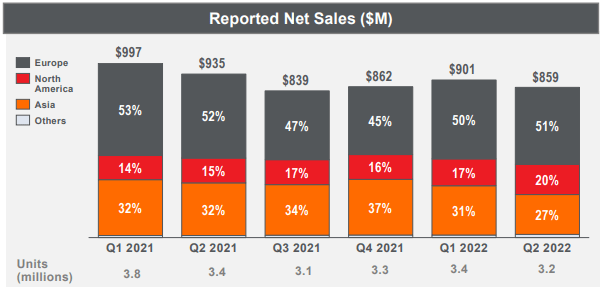
The global chip shortage is a divisive subject among experts, with JP Morgan (JPM) anticipating the situation to be resolved by the end of the year. In contrast, Forrester expects the issue to be “softened” but dragged through 2023. Concurrently, the company has said that it is already starting to see some improvements in the lags caused by the chip shortage, which should be seen in Q3 results.
Meanwhile, China’s Zero COVID Policy signals that it prioritizes COVID control over economic growth, resulting in various industries suffering from stunted or halted growth. This has resulted in the country facing a 2.6% GDP growth decline in Q2 2022, but with Shanghai’s lockdown ending in mid-quarter, the company has started to see operational improvements.
Additionally, since the company’s 51% of H1 2022 revenue is generated from Europe, the weakening of the euro has translated to a material loss of revenue for the company, including an unfavorable currency impact of $73 million in the MRQ. EUR/USD YTD average rate is $1.0758, expected to deteriorate further, averaging about $0.983 for 2022.
These issues indicate that the macroeconomic headwinds will stay for at least the next 2 quarters. Still, they have eased enough to exhibit quantifiable improvements in the upcoming reports.
The long-term topline growth prognosis remains positive since the industry outlook is intact, and the company has already contracted more than 94% of its 2023 and 2024 revenue. The company has retained its market share while investing in new technology beyond turbo, with 50% of its R&D expense to diversify its future revenue streams.
A Closer Look At 2022 Guidance
GTX Q2 Earnings Presentation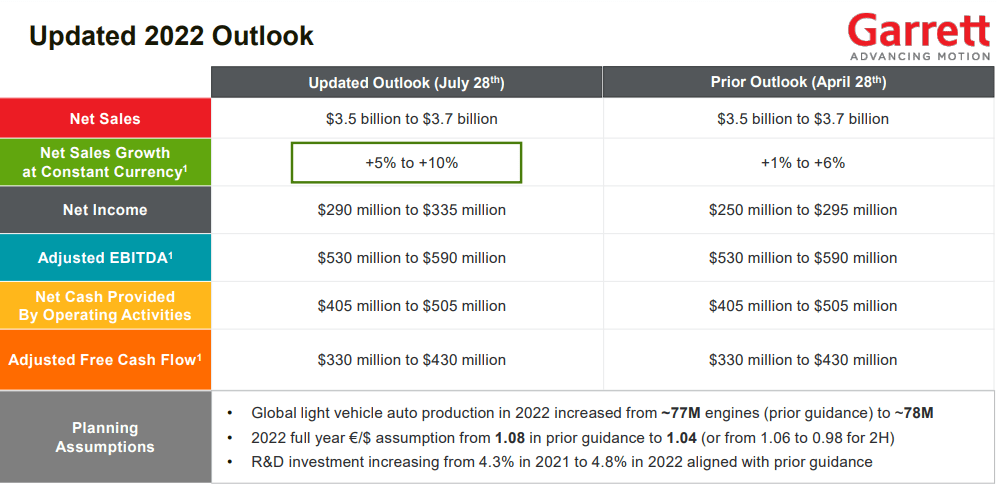
Despite the setbacks, the company’s annual outlook has improved compared to April, when it lowered it from February, bolstering the aforementioned points. With net sales of $1.7 billion, flat at constant currency, net income of $96 million, Adjusted EBITDA of $284 million, OCF of $177 million, and Adjusted FCF of $61 million, the company appears to be proceeding well toward achieving its overall guidance figures.
| Guidance vs. Actual (Million USD) | 2022 Guidance Midpoint | H1’22 Results | Percent Accomplishment |
| Net Sales | 3,600 | 1760 | 49% |
| Sales Growth (ex. currency translation) | 0.5% | -9% | |
| Net Income | 312.5 | 73 | 55.4% |
| Adjusted EBITDA | 560 | 284 | 51% |
| Net Cash from Operations | 455 | 177 | 39% |
| Adjusted Free Cash Flow | 380 | 61 | 16% |
| Assumed EUR/USD rate vs. Average rate | 1.04 | 1.07 | 103% |
Assuming that the company achieves its sales growth target of 0.5%, in light of its quarterly revenue beating the estimated global light vehicle production by 6%, and maintains its net income margin of 10.5% for H2, it will generate annual revenue of $3.651 billion, and exceed its annual net income guidance by generating $198.6 million in H2, and $372 million annually.
Given the weakening of the Euro and assuming an average 2022 EUR/USD rate at parity and a consistent net income to Adj. EBITDA conversion rate to account for the macroeconomic factors, the annual adjusted EBITDA is likely to be middle of the guidance at $548 million.
The company has generated $313 million in operating cash flows in the last 3 quarters at about 12% of revenue on average. If the company can maintain this pace, it will generate $438 million in cash from operations, close to its guidance midpoint.
The EBITDA margin expansion is expected because GTX maintained its sequential adjusted EBITDA margin at over 16% despite a volumetric sales decline. The significant recent debt reduction is expected to push the FCF margins higher. Following the company’s $75 million net adjustments to the OCF, the adjusted FCF is expected to be $363 million.
| Millions USD | 2022 Guidance | 2022 (Est.) | 2021 | YoY Growth | Variance from Guidance |
| Net Sales | 3,600 | 3,651 | 3,633 | 0.50% | 1.42% |
| Net Income | 312.5 | 372 | 495 | (24.93%) | 18.91% |
| Adjusted EBITDA | 560 | 548 | 607 | (9.70%) | (2.12%) |
| Net Cash from Operations | 455 | 438 | -310 | – | (3.71%) |
| Adjusted Free Cash Flow | 380 | 363 | 367 | (1.09%) | (4.47%) |
*Note that negative variance is from the midpoint, making the numbers in the expected range.
Valuation
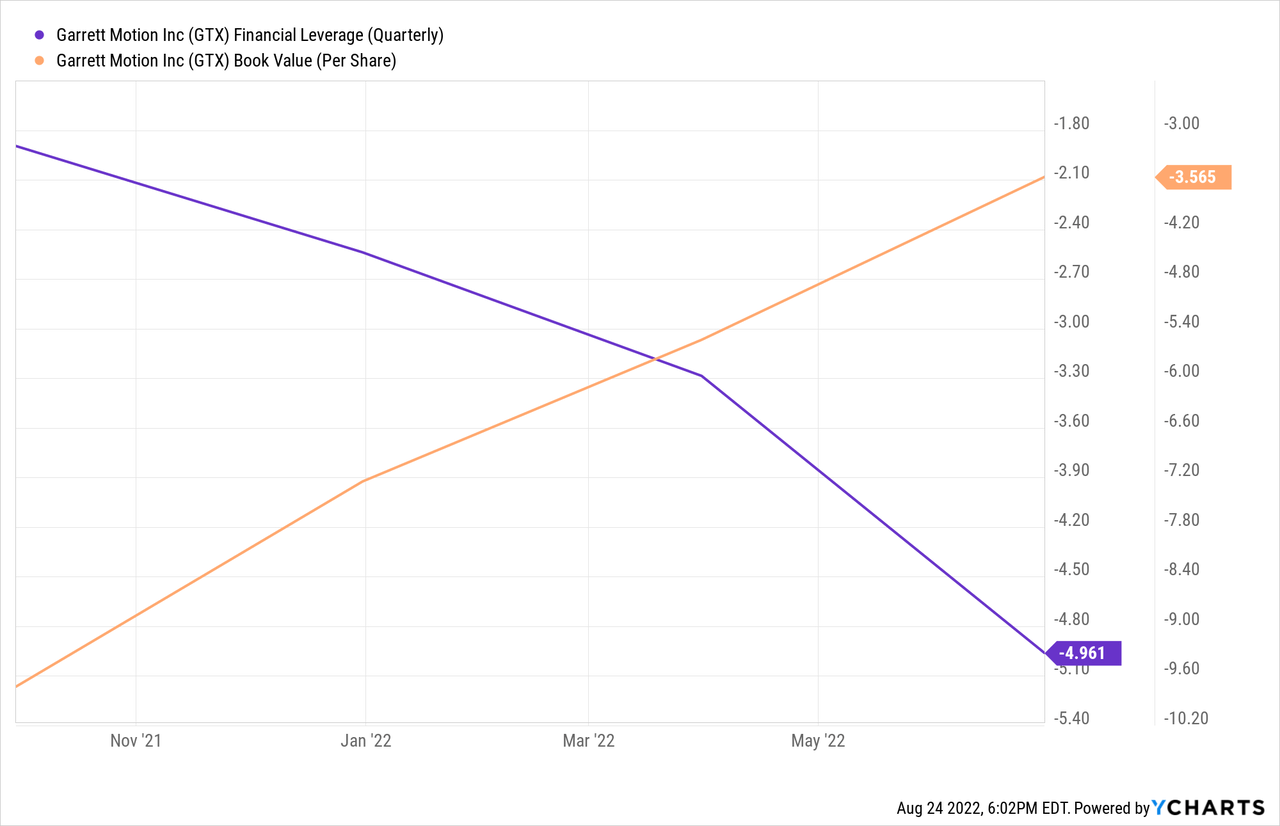
In line with our previous estimate, the company completed an early final redemption of its outstanding Series B Preferred Stock, redeeming over 271.6 million shares for an aggregate price of $212 million. The significant debt reduction has reduced its net debt-to-EBITDA ratio from 2.33x to 1.87x in the MRQ.
This aggressive deleveraging movement significantly reduces the risks borne by the company. Meanwhile, the market continues to value the stock at a discount because of its supposed risks. It needs to be emphasized that GTX is an industry leader which operates in a duopoly. It appears that the market has priced in all the downsides of the stock and barely any upside.
|
Sector Relative Grade |
GTX Ratios |
As of May |
Sector Median |
Variance from Sector |
|
P/E GAAP (TTM) |
63.49 |
2.97 |
13.69 |
364% |
|
P/E GAAP (FWD) |
7.28 |
5.44 |
14.27 |
-49% |
|
EV / Sales (TTM) |
0.44 |
0.41 |
1.18 |
-63% |
|
EV / Sales (FWD) |
0.41 |
0.4 |
1.18 |
-65% |
|
EV / EBITDA (TTM) |
2.73 |
2.47 |
9.28 |
-71% |
|
EV / EBITDA (FWD) |
2.68 |
2.53 |
9.02 |
-70% |
|
EV / EBIT (TTM) |
3.24 |
2.93 |
12.76 |
-75% |
|
EV / EBIT (FWD) |
3.24 |
3.02 |
12.36 |
-74% |
|
Price / Sales (TTM) |
0.15 |
0.11 |
0.91 |
-84% |
|
Price / Sales (FWD) |
0.14 |
0.1 |
0.93 |
-85% |
Apart from the heavy discount to the sector, the company’s debt-based valuation metrics have barely moved despite a 33% share price gain since May because of the company’s aggressive deleveraging. However, market corrections don’t seem far away as the stock is gaining momentum and has gained almost 17% in the previous 1 month.
Conclusion
GTX appears to be a true value stock with significant growth prospects and an undervalued share price. As a company that recently exited a tubulous year, the market will likely react positively to its improving financial statements and reward its shareholders.
Given that the company appears to be on track to fulfill its guidance while deleveraging itself and maneuvering through the macroeconomic turmoil, I expect the market to respond positively to the stock upon publishing its upcoming financial statements.
Garrett Motion is facing temporary headwinds which have impacted its results in the first half of 2022, but the resiliency of the stock has paid off, and since the headwinds are subsiding, the resiliency will likely fuel its upward momentum.
I am still bullish on the stock and rate it as a buy for potential investors looking to invest in a value growth stock.
Be the first to comment