

Monica Schipper/Getty Images Entertainment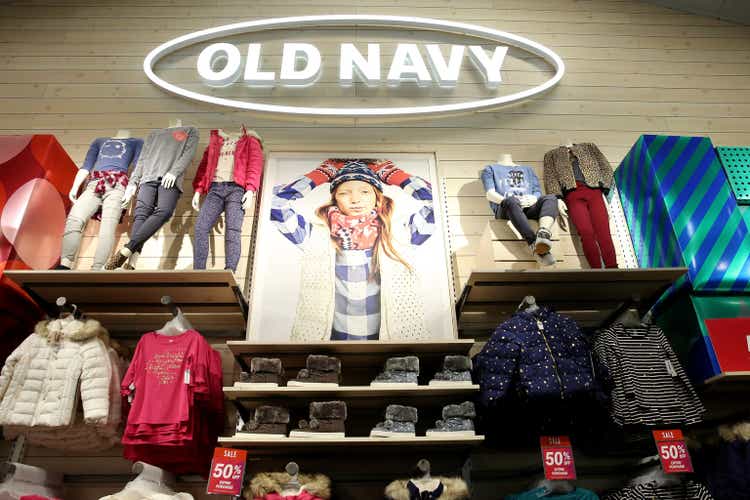
Intro
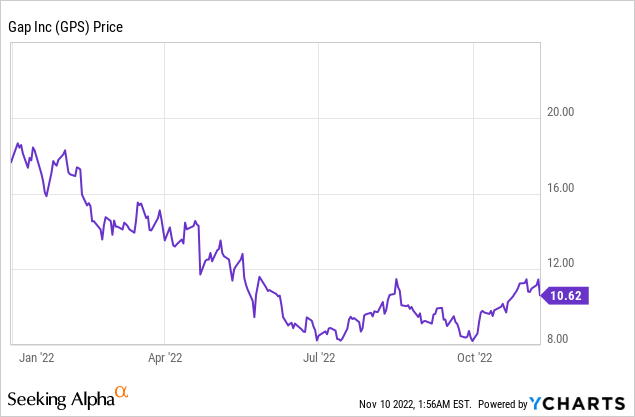
Gap, Inc. (NYSE:GPS), parent to Old Navy, Gap, Banana Republic, and Athleta, is one of the largest apparel retailers in the world. With stubborn inflation and low visibility on future demand, it is no surprise that Gap’s management has struggled to navigate the company through a heap of economic, industry, and company-related headwinds. The effects of these headwinds have caused Gap shares to plummet YTD.
A few months ago, I noticed that some of these headwinds were beginning to dissipate. In fact, I ended up publishing an article discussing how certain cost trends indicated a high upside for Gap’s shares. Sure enough, my thesis panned out as Gap shares outperformed the S&P 500 during that time span.
Rating History of Gap Article (Seeking Alpha)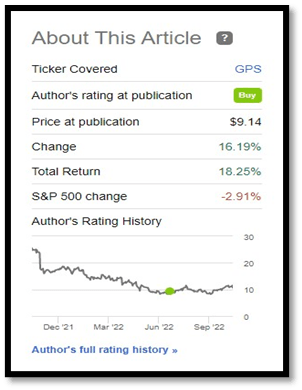
Although my thesis happened to work out, current and potential investors are now wondering if Gap shares are still a buy. As I analyzed new developments in cost trends, management’s expectations, and sector valuation, I arrived at the conclusion that Gap shares are still undervalued. Industry and company-specific headwinds that caused problems at the apparel retailer seem to be vanishing quickly. On top of that, economic outlook is not as pessimistic as it was in the summer. I’ll walk you through why Gap shares appear to still be undervalued.
Margin Expansion Drivers
Less Discounting Ahead
It is no secret that Gap’s largest source of revenue is Old Navy. Therefore, any problems at Old Navy affect Gap’s earnings more than problems at Gap, Banana Republic, and Athleta. The reason Old Navy has led the pack in sales decline these past two quarters is because it had issues with both supply and demand. By overestimating the demand for its BODEQUALITY sizes and underestimating the demand for its core sizes, management set Old Navy up for poor financial performance. This combination of lost potential sales and heavy discounting deleveraged gross margins by 370 bps in Q2. To make matters worse, $58 million in unproductive inventory had to be written off leading to an additional 150 bps hit to Gap’s gross margin.
Fortunately, inventory mismanagement is not exclusive to just Gap. In fact, there seem to be very few retailers who are not significantly impacted by this industry challenge. Gap’s management seems to be aware of this problem and is expecting Q3 inventories to moderate.
As discussed earlier, we’ve taken action to write off unproductive inventory in the second quarter and cut receipts across the assortment beginning in late fall and into holiday, positioning our brands to be able to take advantage of our reinstated responsive capabilities and chase into demand as we enter fiscal 2023. These actions are part of our focused approach to inventory planning for the remainder of fiscal 2022 and beyond.
As we look to the remainder of the year, we believe that third quarter ending inventory growth will moderate substantially and are targeting negative inventories versus last year by the end of the fiscal year. (Katrina O’Connell, CFO, Q2 EC)
Currently, Gap’s management has implemented the pack-and-hold strategy where excess inventories are tucked away into a warehouse and held until the next fiscal year. This excess inventory consists of mostly core seasonal items which reduce the risk of another inventory write-down. As indicated by the quote above, Gap’s management plans to cut back on inventory purchases starting in Q4 of this fiscal year. If executed successfully, this plan should prevent further inventory buildup and lead to less discounting in upcoming quarters. Essentially, lower Q4 receipts coupled with a previously successful pack-and-hold strategy will lead to less discounting going forward.
As you may recall, we have utilized pack and hold strategies as an inventory management tool in the past, which has proven to be successful. While the use of cash in the short term, we are able to optimize our margin in the near term and benefit working capital next year as we buy lower receipts and sell through the pack and hold inventory. (Katrina O’Connell, CFO, Q2 EC)
Airfreight Expense No Longer Necessary
As emphasized in my previous article, Sonia Syngal’s decision, made during Q3 of last fiscal year, to transport 35% of inventory via air was a very costly decision. How costly, you ask? Take a look at management’s statements regarding air freight costs on past earnings calls:
Merchandise margins were down just 10 basis points despite nearly 2 basis points of higher online shipping costs and about 250 basis points in short-term headwinds related to airfreight. (Q3 ’21 EC)
On an adjusted basis, gross margin deleveraged 260 basis points versus 2019, due to nearly 600 basis points in estimated air costs. (Q4 ’21 EC)
As we communicated last quarter, more than half of our fiscal 2022 air freight was expected to be realized in the first quarter. We realized approximately 170 million of incremental air freight during the quarter, which resulted in approximately 480 basis points of gross margin deleverage. (Q1 ’22 EC)
Second, consistent with our expectations, we expectations, we realized an estimated $50 million of incremental airfreight during the quarter, which resulted in approximately 130 basis points of margin deleverage. (Q2 ’22 EC)
As indicated by the above quotes, increased air freight has compressed gross margins significantly. On the bright side, the recent decline in ocean freight volume is expected to continue; along with a sharp drop in ocean freight rates. Gap’s priorities seem to have shifted from “punctual deliveries no matter the cost” to “less purchases so that we can match future inventory levels with future demand”. Therefore, one could confidently assume that importing high levels of inventory via air freight is no longer necessary going forward. Don’t just take my word for it:
I think the one lever we know is that, we don’t plan to be using airfreight going forward. I think that’s the one thing we know that it’s an expensive lever, and we’ve created responsive levers back in the business so we shouldn’t have to do that again. (Katrina O’Connell, CFO, 2Q EC Q&A)
This decision will likely expand gross margins enough to achieve operational profitability in Q3 and beyond. The only question is: how much gross margin leveraging can investors expect?
As we look to the second half of the year, airfreight expense is expected to normalize, and we will be anniversarying last year’s investments, resulting in roughly 400 basis points of leverage. (Katrina O’Connell, CFO, 2Q EC Q&A)
*This 400 bps of air freight leverage estimate is used in Gross Margin FCT*
Cotton Prices Normalizing but Inflation Persists
While cotton is not as significant as other expenses, it’s still an expense. Small changes are arbitrary, but cotton had risen from ~$0.70/lbs to $1.60/lbs in under a year. That extra $0.50/lbs (assuming the 1yr avg from Q2 ’21 to Q2 ’22 was $1.20/lbs) adds up. Fortunately, cotton prices have fallen back to pre-pandemic levels due to rapidly decreasing demand. For a company like Gap, that has struggled to be operationally profitable these past few quarters, lower raw material costs are promising and should expand merchandising margins, albeit slightly.
Cotton (USD/Lbs) (Trading Economics)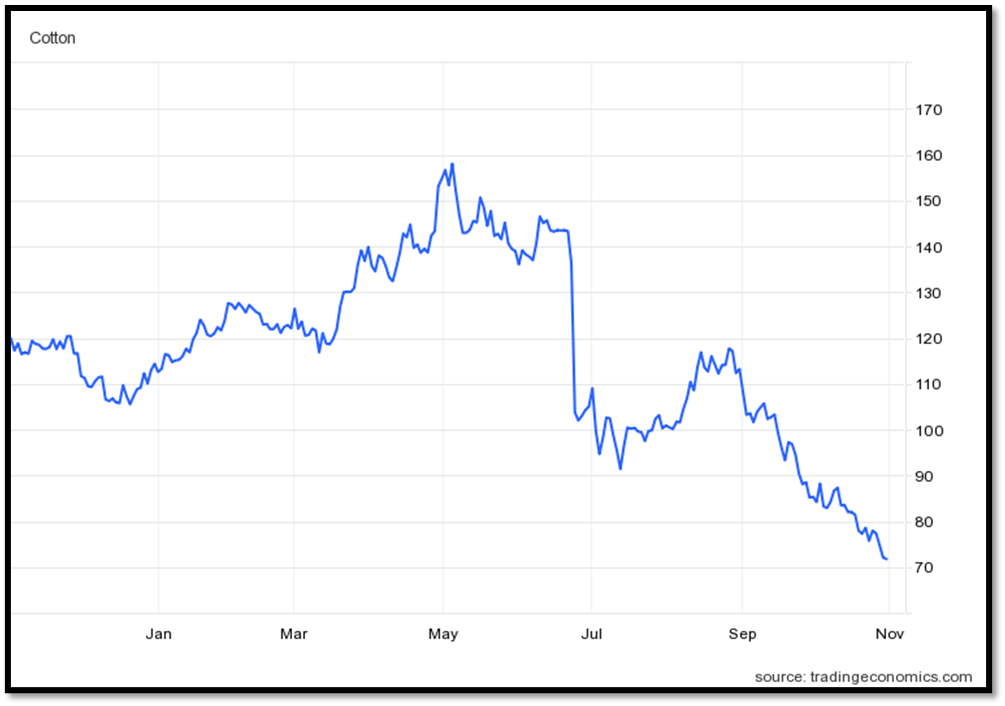
Unfortunately, management still expects inflationary headwinds to continue compressing margins. According to management’s statements regarding expectations for the second half of the year, the 200 bps inflationary deleverage reported in the previous two quarters is expected to continue. In addition, they expect ROD deleveraging to be flat to slightly delevered.
*This 200 bps of inflationary deleverage estimate and the ROD deleverage estimate is used in Gross Margin FCT*
Reduced Workforce and SG&A
If sales are growing at an adequate rate and the economy seems healthy, above-average SG&A spending is justifiable. However, Gap’s financial performance these last few quarters indicates an opposite reality. Management is expecting $5.6B in operating expenses for the full fiscal year. As Gap is barely profitable recently, reducing future operating expenses would seem to be the logical decision. Sure enough, management commented on this dilemma during Gap’s second quarter earnings call:
While we made significant SG&A investments over the last few years to help fuel our future growth opportunities, the current operating environment does dictate a moderation of these investments as well as the implementation of distinct expense savings actions in the near term.
We will begin implementing later in the third quarter a reduction in overhead investments, including a pause on planned hiring and open positions among other actions. In addition, we are reevaluating our investments in marketing and technology. (Katrina O’Connell, CFO)
A month and a half after the earnings call, Gap declared that they were cutting 500 corporate jobs in an effort to reduce expenses. While this alone does not have a significant impact on the company’s operating margin, it is a step in the right direction. Management’s tone implies SG&A spending cuts in the near future. Investors should keep an eye on upcoming headlines about Gap cutting unnecessary costs and how the market reacts to the information.
Gross Margin FCT
By using the above trends and management’s expectations from last quarter’s earnings call, we can get an idea of how much margin expansion we can expect in the next four quarters. I break down each quarter and give a rough estimate of gross margin expectations based on what has changed y/y. These assumptions will be used in my FWD P/E valuation model.
- Q3 ’21: 42.1% gm
- Air freight leverage (+150 bps)
- Inflationary cost headwinds (-200 bps)
- More discounting considering y/y demand change and higher inventory levels (-300 bps)
- Slight ROD deleveraging stemming from reduced demand (-25 bps)
- Q3 ’22 estimate: 38.4%
- Q4 ’21: 33.7% gm
- Air freight leverage (+250 bps)
- Inflationary cost headwinds (-200 bps)
- Less discounting due to lower inventory levels and expected sales growth (+100 bps)
- Slight ROD deleveraging stemming from higher rent (-25 bps)
- Q4 ’22 estimate: 35%
- Q1 ’22: 31.5% gm
- Air freight leverage (+450 bps)
- Inflationary headwinds (-100 bps)
- Manageable inventory levels and the lapping of last year’s Old Navy assortment imbalance (+200 bps)
- Q1 ’23 estimate: 37%
- Q2 ’22: 34.5% gm
- Air freight leverage (+130 bps)
- Inflationary headwinds (-100 bps)
- Lapping inventory impairment charge of $58M (+150 bps)
- Lapping Old Navy’s high inventory levels that forced higher discounting (+300 bps)
- Q2 ’23 estimate: 39.3%
With lower inventory levels beginning in the fourth quarter along with an improved (or at least not as bad as the first half of 2022) assortment balance, I find it highly unlikely that Gap is forced to resort to heavy discounting. As mentioned earlier, management’s top priority seems to be rightsizing inventory. Therefore, it is not unreasonable to expect sizeable margin expansion just from improved inventory management alone. In addition, discontinued air freight will provide significant leverage through 2023.
Valuation
What assumptions are reflected in the current share price? Are these assumptions realistic or overly pessimistic? Focusing on an FWD P/E valuation methodology, I reverse-engineered the stock price to understand market expectations. It led to me identify two potential overly-pessimistic assumptions that are priced in: no cuts to SG&A spending or flat/negative sales growth.
No SG&A Reduction Scenario Reverse P/E Model (Author using historical data and quarterly gross margin forecasts)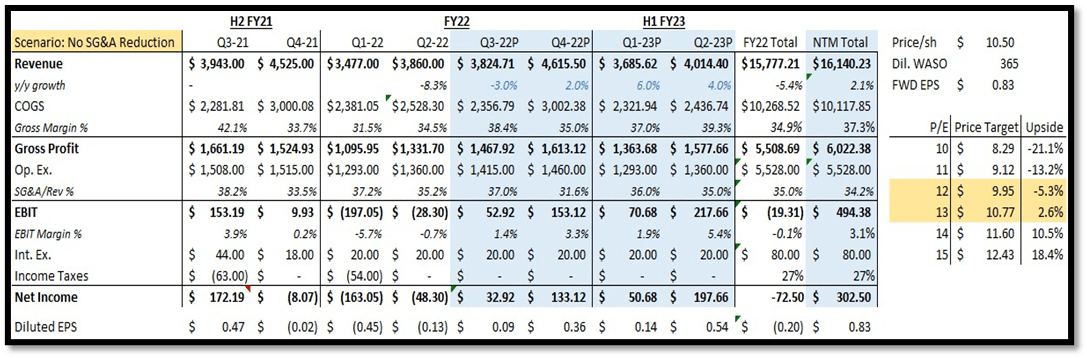
Assuming negative sales growth in Q3 but modest sales growth in the following quarters, I kept SG&A spending unaltered. I used reasonable sales growth rates (which I’ll explain later) as well as the gross margin forecasts discussed in the previous section. Sure enough, using a 12x to 13x FWD P/E multiple leads to the current share price of ~$10.50. This poses the question: how likely is it that Gap’s management continues to cut operational expenses?
Before announcing 500 corporate job cuts, Gap’s management indicated that the $5.6B expected SG&A expense for the full year is “just too high of a cost structure for the current operating environment”. Action is better than empty words. I get it. However, seeing as other companies in the sector are laying off workers, it would not be surprising to see management continue to cut spending. A 5% reduction in SG&A spend for the first half of next fiscal year would be a fairly conservative projection that could significantly move the needle in operating and net profitability. Keep in mind, we are leaving SG&A unchanged for the rest of this fiscal year; which is also a conservative assumption.
Okay but what if this scenario is not what investors are pricing in? Maybe Mr. Market is in fact accounting for a significant reduction in SG&A spend. In that case, the other scenario possibly being priced in is: little to no sales growth.
Author using historical data and quarterly gross margin forecasts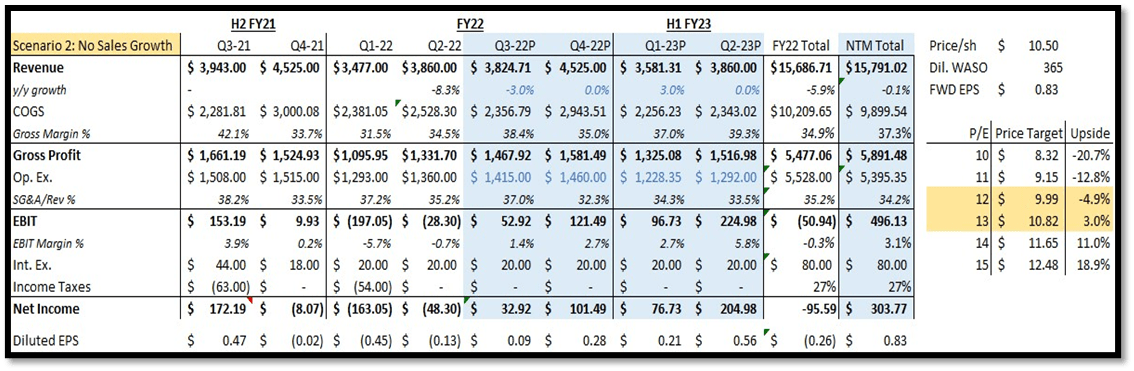
The model above shows a 5% reduction in SG&A spend (blue font color), but negative sales growth in Q3, no sales growth in Q4 ’22 and Q2 ’23, and a minor jump for Q1 ’23 (these revenue growth projections are also marked with the blue font color). This combination of lower SG&A but mostly flat growth gives us a fair value of ~$10.50/sh (12x/13x fwd multiple). This poses a similar question to scenario 1: how realistic is the above sales growth forecast?
The Rationale For Modest Sales Growth
As I’ve stated multiple times in this article and my previous one, Old Navy’s massive mistake of overshooting BODEQUALITY demand while simultaneously not meeting demand for their core sizes led to a significant decline in sales. The image below shows TTM revenue growth and NTM revenue projections for Gap and its peer group.
Screenshot of TTM Revenue Growth and NTM Revenue Forecasts for Gap and Competitors (Seeking Alpha)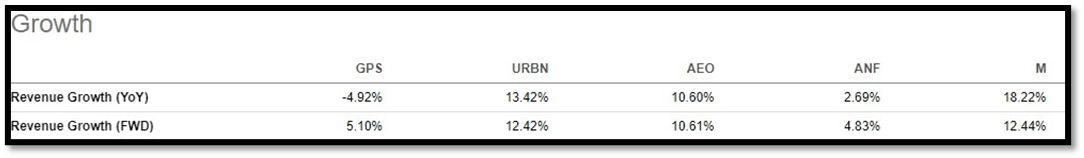
As indicated by the chart, this assortment imbalance has caused higher than expected sales decline for Q1 (-13%) and Q2(-8%) of this fiscal year. Therefore, reported sales growth for Q1 ’23 and Q2 ’23 should be positive as Old Navy readjusts and they lap last year’s hiccup.
As for Q3 and Q4 of this year, I expect a sales growth trend reversal to start in Q4. My source? Well, the National Retail Federation expects holiday retail sales to grow between 6% and 8% compared to 2021. In addition, a Mastercard SpendingPulse report estimates 7.1% holiday spending growth, but that report is less recent than the NFR’s. Inflationary challenges may dampen demand, but it seems consumers are still expected to spend. Due to Gap’s reduction in Q4 purchases, I set a conservative 2% sales growth assumption.
Using the analysis above, we can confidently expect positive low to mid single-digit growth rates for 3 of the 4 upcoming quarters. This proves that Scenario 2’s growth assumptions are overly pessimistic given the available information.
Valuation Part 2
Now that we have analyzed why Gap should see modest sales growth and less SG&A going forward, we can confidently arrive at a price target. As a reality check, the FWD P/E multiples for the sector are shown below:
Cons Desc Sector Median FWD P/E (Seeking Alpha)
Without further ado, assuming conservative sales growth rates and a 5% reduction in SG&A for H1 ’23, the results of the P/E model are highlighted in yellow:
Fwd P/E Model for GPS (Author using historical data and the above assumptions)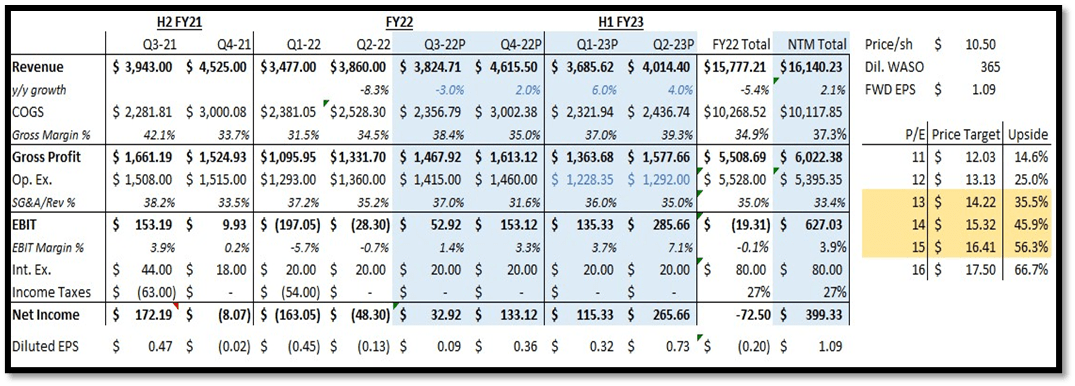
As the model illustrates, Gap shares have an upside between ~33% and ~55%, depending on the FWD P/E multiple. The diluted EPS estimates are also adjusted for an estimated 27% effective tax rate (forecasted by management in Q1 ’22 ECP). Again, this upside was derived using conservative assumptions for the purpose of assessing whether or not Gap shares have an adequate margin of safety. Based on the above analysis, they do.
Risks
Management does not always accomplish what they set out to accomplish. Although significant damage to profitability has already been done, there is no guarantee that management will learn from these mistakes and reverse course. They may miscalculate future demand again resulting in higher inventory levels and more discounting. They may fail to reduce SG&A significantly resulting in negative operating profit margins. Not having a long-term CEO in place only increases the probability of these risks. This is not to say I have no confidence in Bob Martin. In my opinion, he deserves more credit for rising to the occasion and taking necessary action to ensure Gap’s stability. However, electing an industry veteran with a proven track record will ease investors’ concerns about the future of Gap.
Another risk is a possible collapse in consumer spending. The unemployment rate rose to 3.7% in October from 3.5% in September. In addition, recent CPI data are showing no signs of cooling. If this combination of rising unemployment and lower disposable income persists, it could prevent revenue growth and margin expansion. Obviously, this risk isn’t exclusive to Gap, but it is one worth considering for risk-averse investors.
Final Thoughts
One of the hardest tasks in analyzing a company’s recent underperformance is determining whether the issues stem from a short-term hiccup, or rather a fundamental problem in the business model. After looking deeper into Gap’s current situation, I am confident that what we are seeing here is the former, a short-term hiccup. The inability to match inventory purchases with demand and sacrificing profitability for punctuality has compressed Gap’s valuation as uncertainty still looms.
As contrarian as it seems, Gap has a significant upside from its current valuation. The expectations for near-term sales growth and operating margins that are priced in by the market are unreasonably pessimistic. Therefore, I am assigning a “buy” rating given a 1-year investment horizon.
Be the first to comment