

Antonio_Diaz/iStock via Getty Images
Apparel stocks have been a rough place to be in 2022, along with just about everything else. Apparel, of course, is quite cyclical and therefore suffers during periods of economic duress. During periods such as these, the cream rises to the top while the rest sink, and below, we have one stock that is firmly in the latter camp.
Hanesbrands (NYSE:HBI) is a maker of basic, low-cost apparel that is intended to be used every day. It’s stuff like undershirts, socks, t-shirts, etc. We’re not talking about high-end merchandise and that’s fine; there’s a market for that. However, it also means competition is intense, and Hanesbrands, as far as I can tell, doesn’t really have any sort of competitive advantage.
I first covered Hanesbrands in the summer 2020, and I called the stock a high-yield turnaround play. It subsequently soared about 50% higher into early-2021, when I went to neutral. Since that time, shares have cratered from $15 to $6, so it’s been a tough 18 months or so.
While Hanesbrands is “cheap” now, it is cheap for some very good reasons. I don’t think the dividend is necessarily sustainable at this point, and I’m not sure where the bottom is on earnings. Given these factors, I recommend that you stay away from Hanesbrands despite how tempting it might be to buy the stock at a decade-low.
An ugly chart
Unsurprisingly for a stock that has lost two-thirds of its value since early-2021, Hanesbrands’ chart is hideous.
StockCharts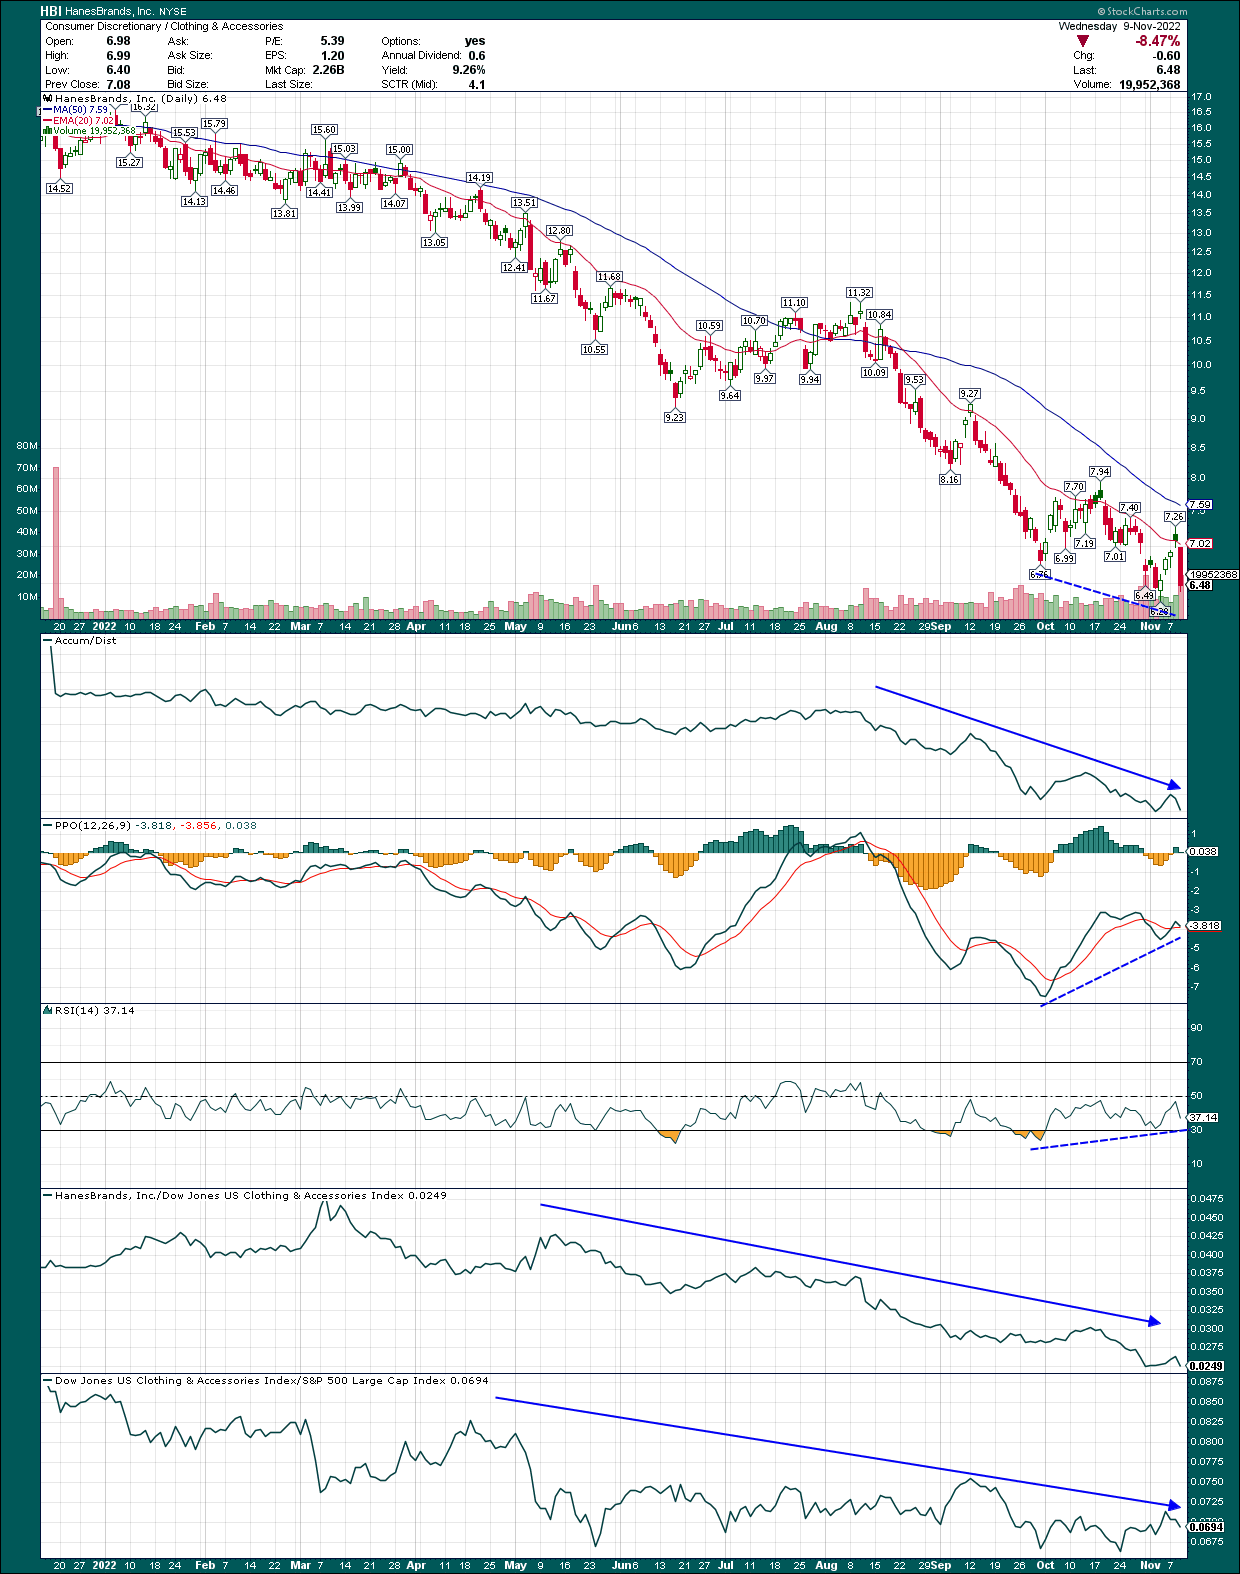
There’s an obvious, long-term downtrend in play here, and that hasn’t changed. The stock is in a terrible group, and is managing to vastly underperform that terrible group, so relative strength simply doesn’t exist.
The accumulation/distribution line shows firm, sustained distribution, which is a bad sign. It means the stock is being sold throughout the day more than it is being bought, which is a sign of long-term weakness.
The only silver lining I can find is that the PPO and 14-day RSIs are both showing positive divergences. This is where the momentum indicators make higher lows while price makes a lower low. This can often portend the end of a downtrend (negative divergences do the same for potential tops) and we certainly have some in place here, as noted by the dotted lines.
Is that enough to buy the stock? In my opinion, it is not. There’s too much other bad news on this chart for me to want to step into this one. What it would take is for the stock to close over the 20-day EMA and turn that line higher. That would indicate we have a better shot at the downtrend ending, but we’re nowhere close to that today.
Fundamentals only a mother could love
Sometimes, even if the chart is ugly, there’s a long-term story for investors to want to buy. For me, I just don’t see it here. The company reported Q3 earnings and the market did not take too kindly to what was said.
Revenue was down almost 7% year-over-year, and missed consensus by about 2%. That included a $59 million headwind from forex translation, but missed the mark all the same. On a constant currency basis, sales were still down 3%.
The “best” segment during the quarter was Activewear, which managed flat sales year-over-year. Innerwear was down 11%, while International sales fell more than 6%. Global Champion brand sales plummeted 14%.
Gross profit came to $576 million on an adjusted basis, while adjusted gross margin plunged 460bps to 34.5% of revenue. More than perhaps anything else, distributors/retailers of physical goods are being judged on their ability to preserve margins, and Hanesbrands just didn’t.
Operating profit was worse, falling from 13.1% of revenue to just 8.5%, and falling from $235 million to $141 million on a dollar basis.
Inventory – which we’ll touch on in a bit below – was up 31% to $2.14 billion year-over-year. Inventory uses up cash, so this level of inventory is unacceptable given that’s several months of sales. This kind of build in the face of falling sales reeks of mismanagement in forecasting demand.
Guidance for Q4 was even worse, with sales of $1.40 billion to $1.45 billion coming in well off the mark of $1.63 billion consensus. EPS was forecast at four to 11 cents, nowhere close to the 22 cents analysts were expecting.
This report was ugly, and I’m struggling to find any positives.
Enough of that; let’s look forward and we’ll start with revenue revisions.
Seeking Alpha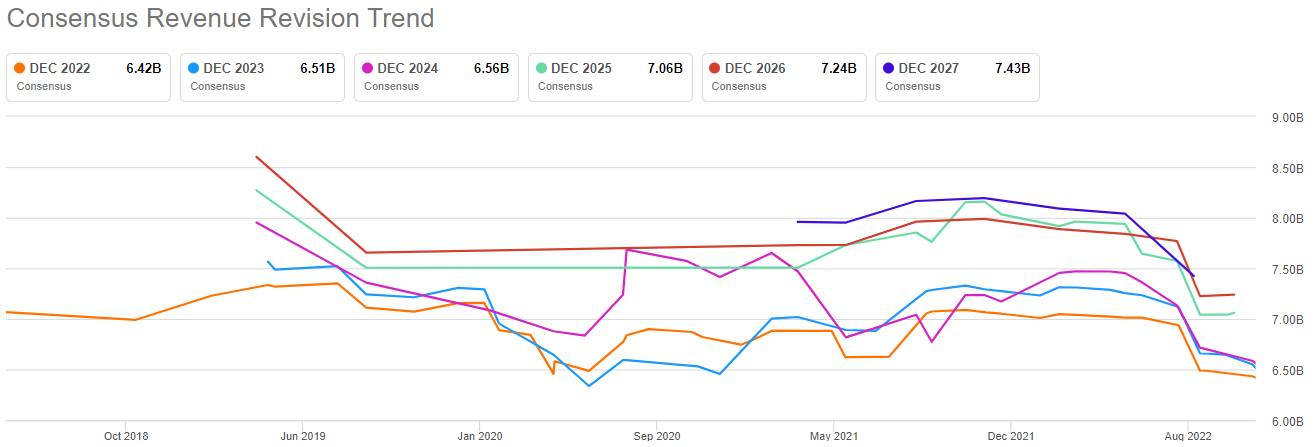
We can see there was some level of optimism among the analyst community during the worst of COVID, but that has faded completely, and then some. Revenue estimates are at their lowest points for most years, and the slope of the lines is pretty awful. That just indicates that sales are falling more quickly than analysts can keep up with, and that’s still the case given below-consensus Q4 guidance.
Perhaps surprisingly, Hanesbrands’ margins have held up pretty well until recently. Below we have trailing-twelve-months gross margins and earnings before interest and taxes margin for the past few years.
TIKR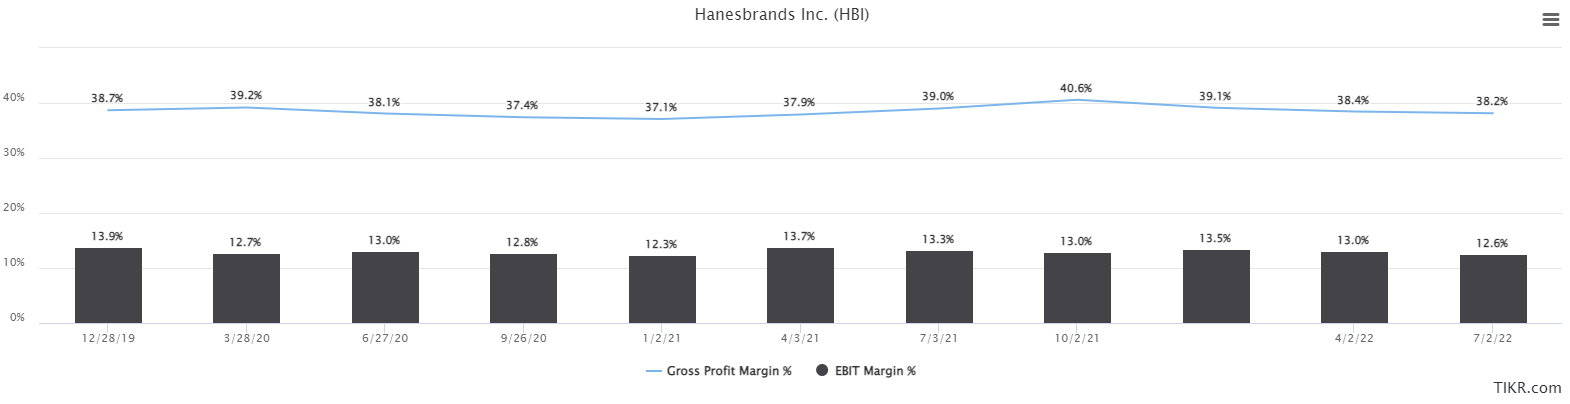
While there’s some oscillation, overall, margins have looked pretty good. However, we know Q3 margins were terrible, and we also know that because of below-consensus guidance for Q4, they’re likely to deteriorate again. This is part of what Wall Street is worried about and it’s why the stock is $6.
I mentioned inventory above and I’d like to touch on it, because it has implications for the stock longer-term. One thing that retailers/wholesalers of apparel must control is inventory. Having inventory on the books means cash is being used for product to just sit there, and that impacts cash conversion.
Below we have the cash conversion cycle for HBI for the past few years, and we can see some deterioration of late.
TIKR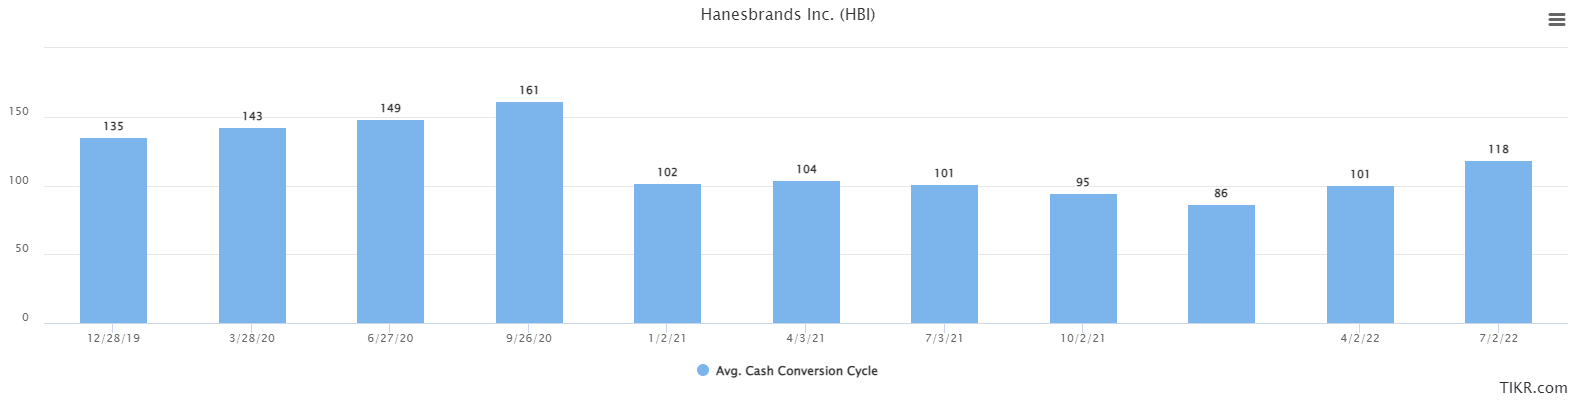
CCC was 86 days in the final quarter of last year, but was 118 days for the July quarter this year. That’s a huge deterioration, and what it means is that HBI is taking 32 more days to convert its inventory into cash it can use again. In practice, that means it needs more capital available to run its business, because more of its capital is tied up in inventory that is taking longer to convert into cash. The lower this number, the better, and the best companies in the world actually have negative CCC numbers.
One of the components of CCC is obviously inventory, so below we can isolate the number of days outstanding of inventory over the past few years.
TIKR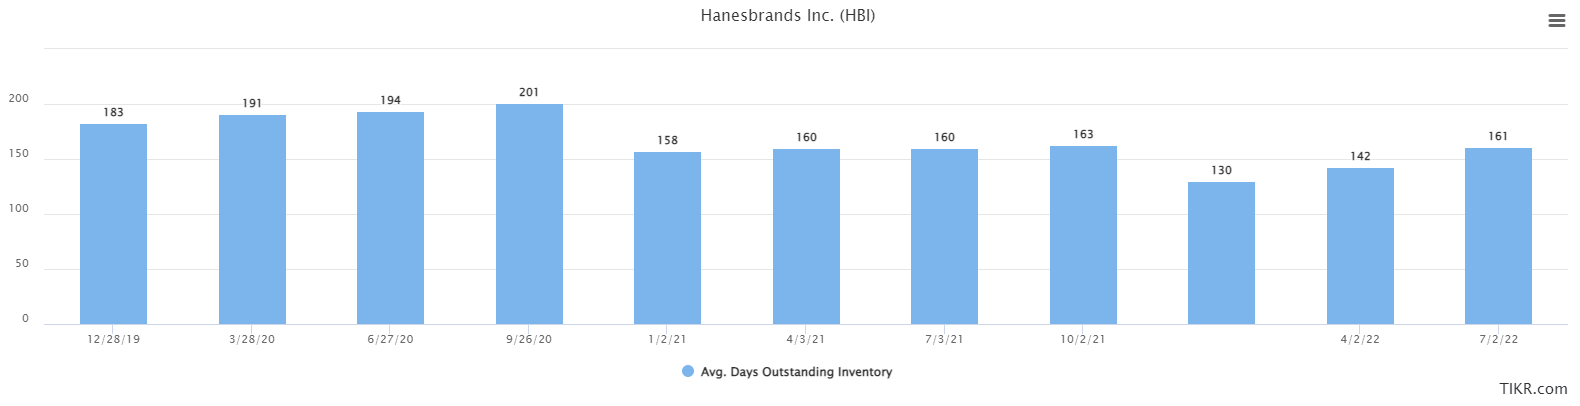
There’s obvious deterioration here, and we know inventory soared 31% year-over-year in the October quarter, even as the rate of sales declined. That means days outstanding of inventory is much, much higher year-over-year, and again, is using up more and more capital.
Next up, let’s look at cash from operations and free cash flow, both on a trailing-twelve-months basis.
TIKR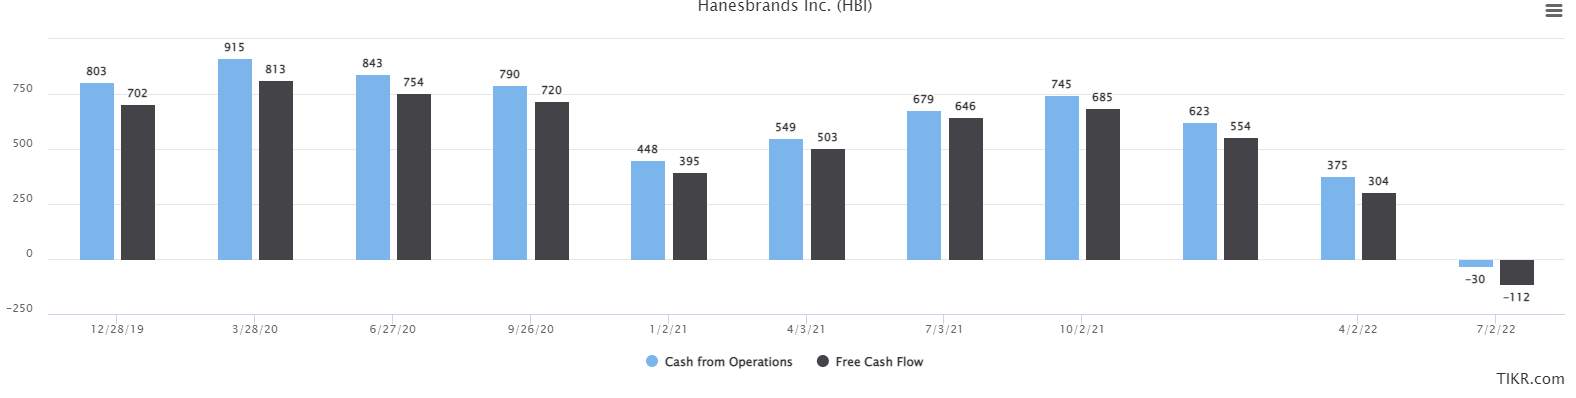
HBI used to produce $900 million or so in annual FCF pretty reliably. Those days are gone, however, and inventory is a big reason why. Another reason is deteriorating margins, and the net result is negative FCF for the past four quarters.
That’s a problem because HBI already has a lot of debt, and it pays a big dividend. Those things require cash to service, so HBI has to get its act together on cash generation absolutely as quickly as possible.
Net debt is below, and we can see debt is creeping up once again.
TIKR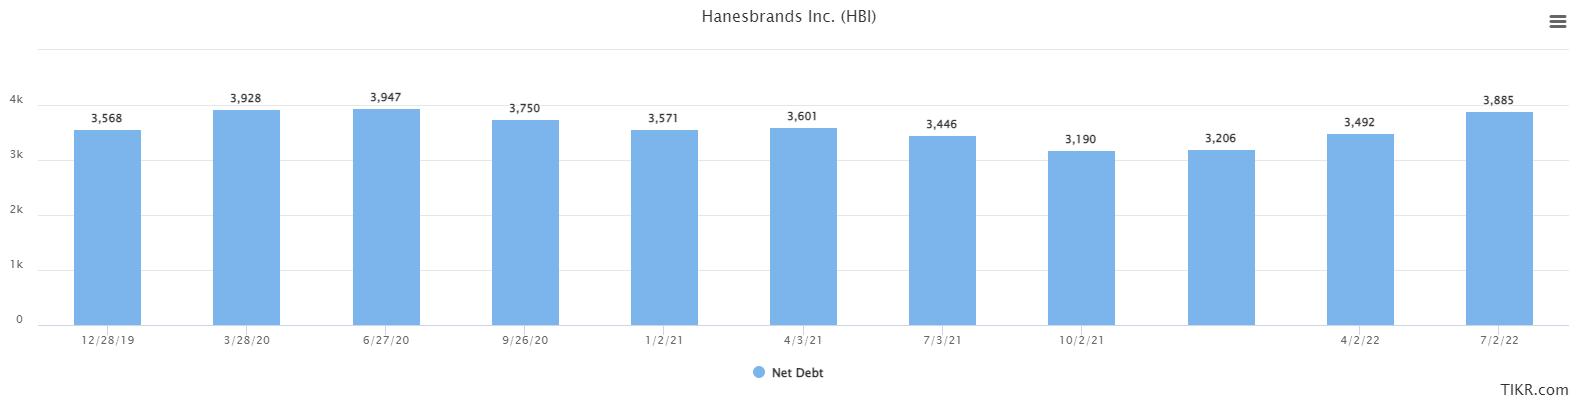
That’s because negative cash generation plus ballooning inventory means cash usage is extremely high, and it has to come from somewhere.
Last thing on cash is below; FCF versus dividends paid on a TTM basis.
TIKR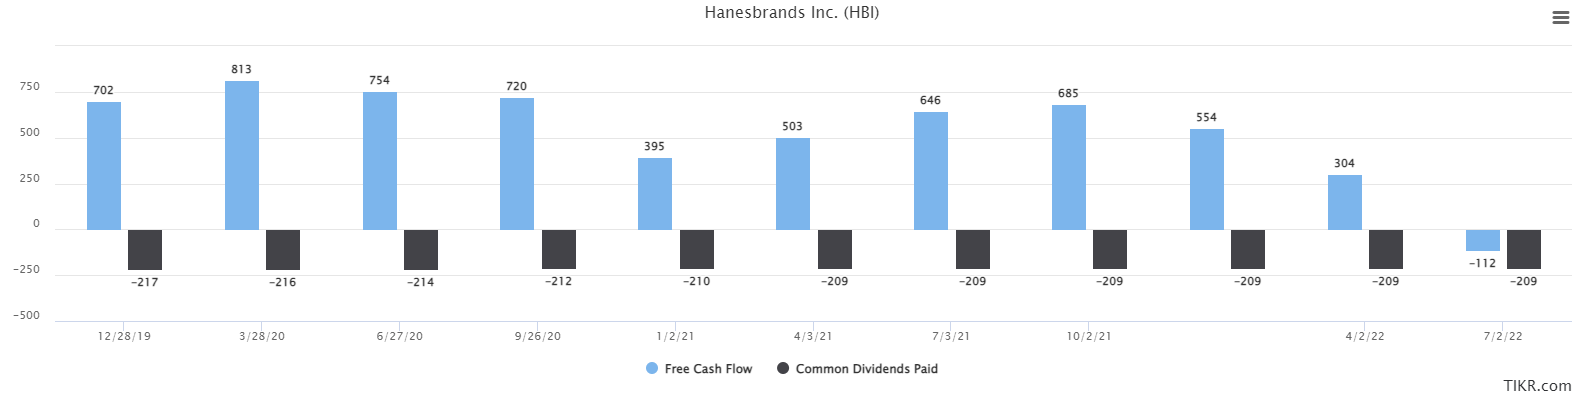
The dividend is just over $200 million annually at the current rate, which was highly affordable a couple of years ago. Today, it just isn’t, so those of you buying for the dividend may be disappointed in 2023 if the cash situation doesn’t improve. Indeed, I think HBI should cut or suspend the dividend given this evidence.
Attempting to find value
Let’s start with EPS revisions, which are, unsurprisingly, down trending.
Seeking Alpha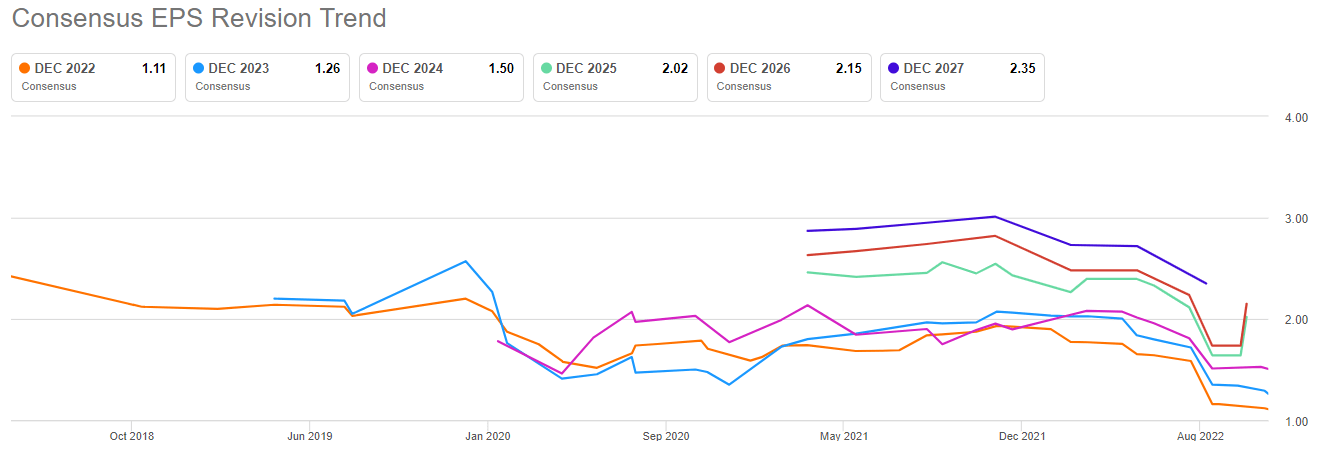
There isn’t a lot to say here because a picture says a thousand words. EPS estimates have plummeted due to a nasty combination of weakening sales and much lower margins. I mentioned above that investors don’t know where the bottom for earnings might be, and this is why. With Q4 guidance coming in so weak, I suspect we’re not done with the downward revisions.
An alternative way to value a dividend stock is through the yield, and we can see that below for the past decade.
Seeking Alpha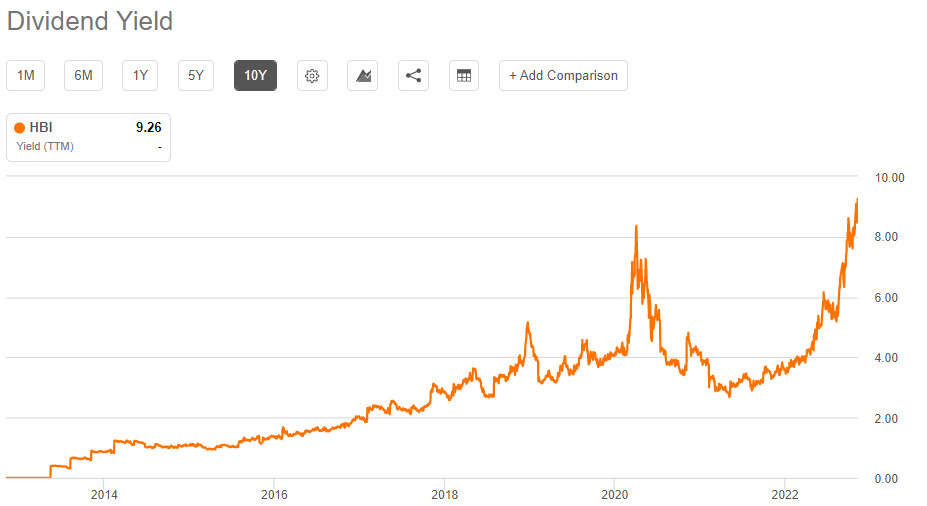
The yield is over 9% today, which is more than 5X the S&P 500. Either HBI is the deal of the century from a yield perspective, or the dividend is going to be cut. I believe it is the latter, as I do not think HBI has the ability to produce enough FCF to run its business and pay the dividend. In addition, given its net debt is already almost double its market cap, there’s no room to borrow for a bit to pay the dividend. I personally do not think the payout is sustainable and the stock is being priced for it.
Finally, let’s take a look at historical forward P/E ratios to get a sense of how the stock is priced on an earnings basis.
TIKR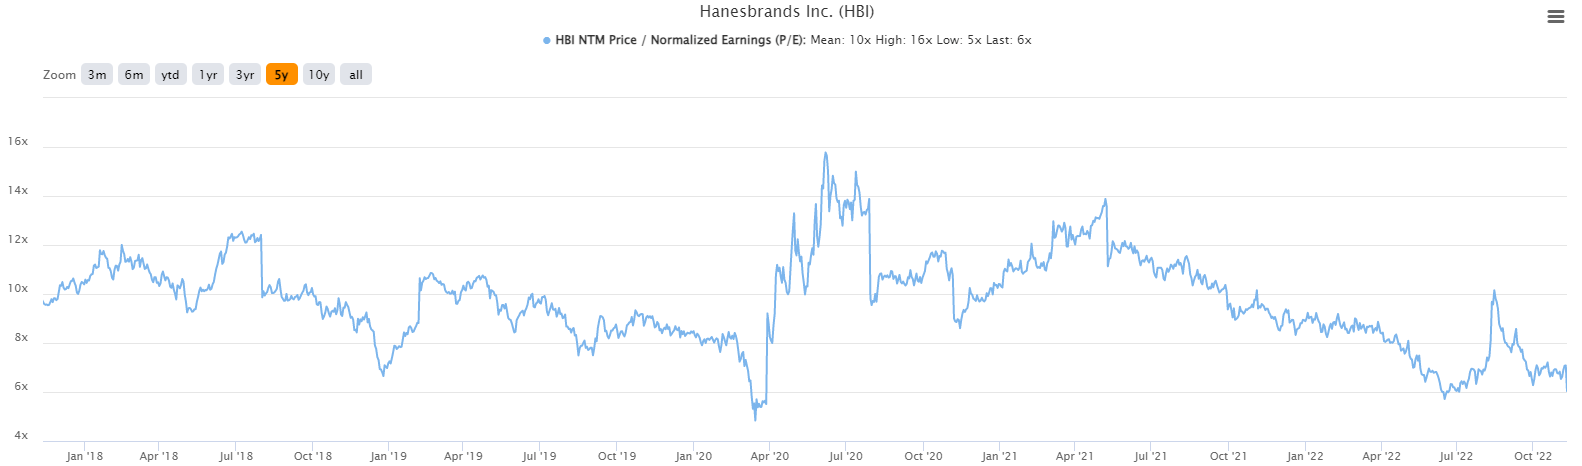
Shares look cheap today at 6X forward earnings, which is very near the COVID spike low. However, I’ll remind you that earnings weren’t endlessly tanking the last time the stock was this cheap, so it should be cheap. Is 6X earnings too cheap? That’s up to each investor to figure out for themselves, but in my view, it’s not cheap enough to warrant buying given all the problems this company has.
I honestly think one of the best things HBI can do right now is cut or suspend the dividend. It cannot afford to continue to pay it, and I think dividend action would be good for the stock. Until that happens, and as long as the management team stubbornly sticks to paying an unsustainable dividend, I don’t want anything to do with HBI. The chart is ugly, sales are falling, and margins are compressing, so there’s nothing here.
Be the first to comment