


fatido/iStock via Getty Images
This article was coproduced with Dividend Sensei.
Recession is top of mind for many investors right now, with the economy slowing and the Fed hiking interest rates at the fastest rate in 40 years.
The bond market, the “smart money” on Wall Street, is relatively confident that a recession is coming by early 2023.
-
the 2-10 yield curve one of the best recession predictors in history, is 32 basis points inverted right now
-
the most since 2000
But just because recession risk is high and rising doesn’t mean there aren’t safe and glorious high-yield opportunities just waiting to help you potentially retire rich and stay rich in retirement.
Let me share the four reasons why Fresenius Medical Care (NYSE:FMS) isn’t just one of the best high-yield dividend aristocrats you’ve never heard of, but why it’s the best time in 21 years to buy this blue chip today.
Fresenius isn’t just an undervalued aristocrat, it’s a Buffett-style anti-bubble “fat pitch” that could deliver 235% returns in the next five years. That’s 25% Buffett-like returns from an aristocrat bargain hiding in plain sight.
Reason One: Fresenius Is The Complete Safe High-Yield Dividend Growth Package
Here’s the bottom line up front about FMS.
-
What You Need To Know About Foreign Dividend Withholding Taxes
-
Fresenius is a German company, so US investors face 26.375% dividend withholding taxes on their shares
-
a tax credit recoups this if you fill out the paperwork and own them in taxable accounts
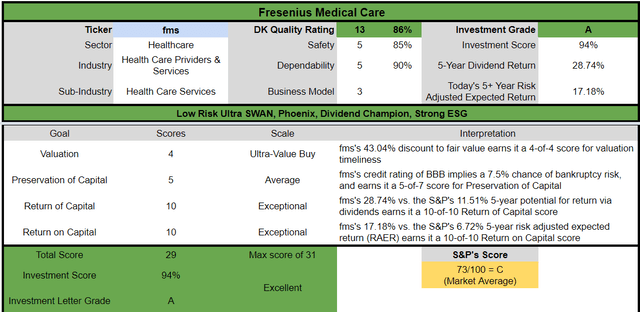
Reasons To Potentially Buy FMS Today
-
86% quality low-risk 13/13 Ultra SWAN global aristocrat
-
128th highest quality company on the Master List (78th percentile)
-
85% dividend safety score
-
25-year dividend growth streak
-
3.1% very safe yield
-
0.5% average recession dividend cut risk
-
1.8% severe recession dividend cut risk
-
42% historically undervalued (potential Ultra Value “Fat Pitch” buy)
-
Fair Value: $39.18 (18.4 PE)
-
10.7X forward earnings vs. 18X to 19X historical
-
7.1X cash-adjusted earnings = anti-bubble blue-chip priced for -2.8% CAGR growth
-
BBB stable outlook credit rating = 7.5% 30-year bankruptcy risk
-
71st industry percentile risk management consensus = good
-
0.8% to 16% CAGR margin-of-error growth consensus range
-
15.4% CAGR median growth consensus (one of the highest in the company’s history)
-
5-year consensus total return potential: 24% to 26% CAGR
-
base-case 5-year consensus return potential: 25% CAGR (5X more than the S&P consensus)
-
consensus 12-month total return forecast: 49%
-
Fundamentally Justified 12-Month Returns: 75% CAGR
Supreme Court Ruling Raises Uncertainty for DaVita (DVA) and Fresenius
“Shares of U.S. dialysis service providers declined substantially on June 21 after the U.S. Supreme Court offered a surprising decision in the case of Marietta Memorial Hospital Employee Health Benefit Plan versus DaVita.
In that decision, the majority of the court ruled that Marietta’s decision to keep DaVita (and its key peer Fresenius Medical Care) out-of-network for Marietta’s insured population did not break the law since it treated all insurance plan holders equally.
As a result of this ruling, we are raising our uncertainty ratings for DaVita and Fresenius Medical Care to high from medium (and keeping Fresenius SE’s uncertainty rating at high) since this decision could allow insurers to push outpatient dialysis services out of network for all plan members, including dialysis patients.
We suspect such a shift, if unchecked by a statutory language change by Congress for example, could create a significant financial burden on the roughly 10% of U.S. dialysis patients that currently receive treatment through commercial insurance plans and represent the vast majority of U.S. dialysis service-related profits.
However, Morningstar said that it “suspects Congress may move relatively quickly to make sure Medicare’s budget is not negatively affected by more end-stage renal disease, or ESRD, patients being pushed into that program because they cannot afford out-of-network dialysis treatment rates.”
570,000 Americans are on kidney dialysis which is legally required to be covered by Medicare.
“We do not expect that this case triggers a major change in the relationship between providers and health insurers, as the vast majority of those in the industry are interested in the well-being of patients. Limiting coverage for certain conditions is, in our view, not appropriate or ethical behavior and raises a significant health equity issue for patients living with kidney disease.
The U.S. government has a long-standing history of supporting end-stage renal disease (ESRD) patients beginning with Nixon’s signing of the Medicare ESRD act 50 years ago to the 2019 Executive Order on Advancing American Kidney Health.
To reduce healthcare costs covered by the U.S. government, the coordination period for ESRD under the Medicare Secondary Payer Statute (‘MSP’) has been extended several times from 12 to 30 months. We do not expect any financial impact on our fiscal year 2022.” – Fresenius Medical care
The bond market has estimated that FMS’s default risk has roughly doubled since this ruling came out.
-
but still prices FMS fundamental risk as a BBB+ rated company
-
higher than its official credit ratings
This is the second worst bear market in FMS history.
The only time FMS fell more was during the Medicare apocalypse of 2001 when CMS drastically changed Medicare and Medicaid funding (bankrupting much of the skilled nursing facility industry at the time).
-
FMS kept growing its dividend
The Best Time To Buy Fresenius In 21 Years
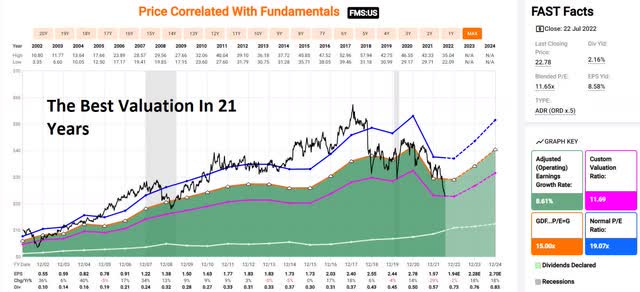
FAST Graphs
It’s very simple if you like FMS’s business and are comfortable with the risk profile, then it’s the best time in 21 years to buy it.
-
lower PE than during the Pandemic
-
lower than the Great Recession
-
priced for -2.8% CAGR growth forever
Fresenius Medical Rolling Returns Since October 1996
FMS is historically an 8% growing company that’s delivered consistent 8% to 9% returns that slightly outperformed the S&P.
From bear market lows? The last time FMS was this undervalued, it delivered
-
up to 28% annually for the next 10 years = 11.5X
-
up to 20% annually for the next 15 years = 16.3X
FMS Growth Thesis Has Rarely Been Stronger 15% CAGR Growth From 2021 – 2027
|
Metric |
2021 Growth |
2022 Growth Consensus |
2023 Growth Consensus |
2024 Growth Consensus |
2025 Growth Consensus |
2026 Growth Consensus |
2027 Growth Consensus |
|
Sales |
3% |
-4% |
5% |
4% |
NA |
NA |
NA |
|
Dividend |
14% |
28% |
9% |
13% |
18% (29-Year Streak) |
NA |
NA |
|
EPS |
-29% |
-2% |
18% |
18% |
17% |
13% |
8% |
|
Operating Cash Flow |
-39% |
4% |
8% |
11 |
-9% |
NA |
NA |
|
Free Cash Flow |
-51% |
-18% |
18% |
11% |
NA |
NA |
NA |
|
EBITDA |
-2% |
-10% |
8% |
10% |
NA |
NA |
NA |
|
EBIT (operating income) |
-6% |
-17% |
22% |
18% |
NA |
NA |
NA |
(Source: FAST Graphs, FactSet Research)
Even with the Pandemic induced downturn, FMS is expected to grow at 12% CAGR through 2027.
-
15.4% CAGR median growth consensus
-
the stock is priced for -2.8% growth according to the Graham/Dodd fair value formula
Analysts expect FMS to grow the dividend at 13.7% CAGR through 2025 and achieve a 29-year dividend growth streak by 2025.
FMS 2024 Consensus Total Return Potential
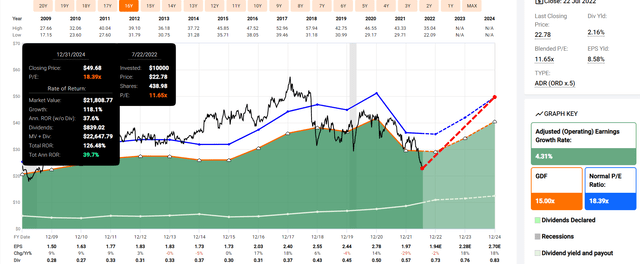
FAST Graphs
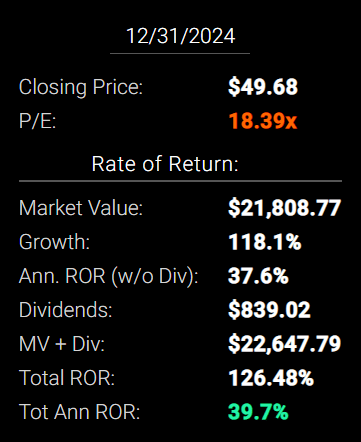
FAST Graphs
If FMS grows as analysts expect by 2024 and returns to the mid-range of historical fair value, it could deliver 126% total returns or 40% annually.
-
Buffett-like returns from a global aristocrat anti-bubble bargain hiding in plain sight
Now compare that to the S&P 500 consensus.
S&P 2024 Consensus Total Return Potential
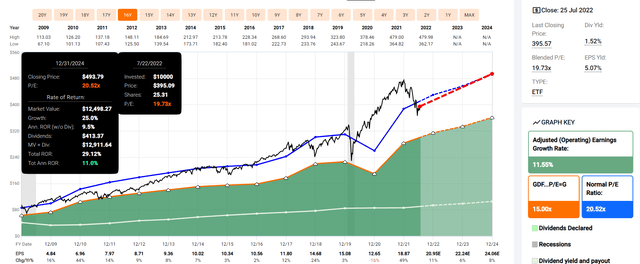
FAST Graphs
FAST Graphs
Analysts expect about 29% or 11% annual returns from the S&P 500 over the next 2.5 years.
FMS 2027 Consensus Total Return Potential
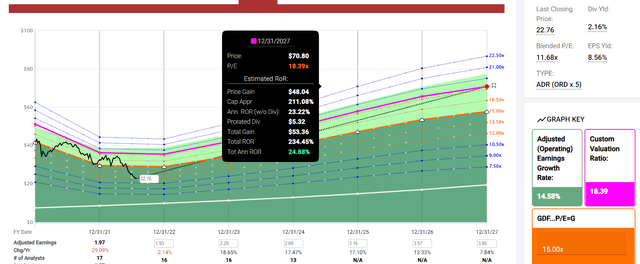
FAST Graphs
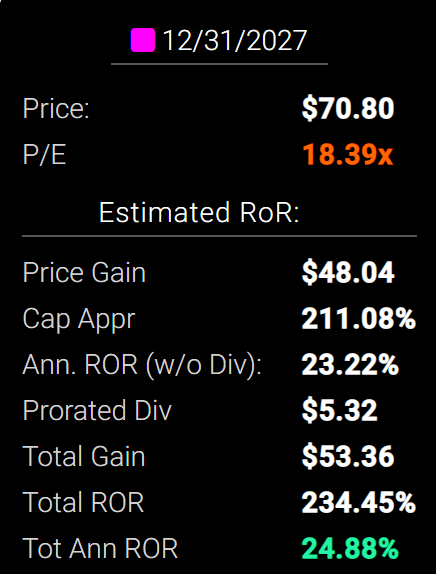
FAST Graphs
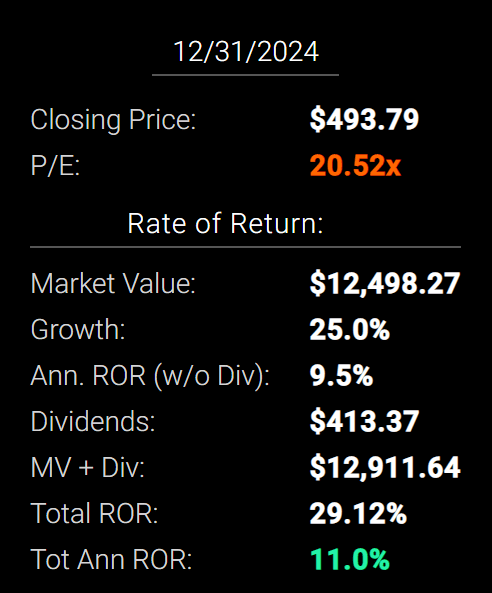
By 2027 if FMS grows as expected and returns to historical mid-range historical fair value, it could deliver 234% total returns or 25% annually.
-
about 5X more than the S&P 500 consensus
-
potentially more than 3X your money
-
Buffett-like returns from a global aristocrat bargain hiding in plain sight
S&P 500 2027 Consensus Return Potential
|
Year |
Upside Potential By End of That Year |
Consensus CAGR Return Potential By End of That Year |
Probability-Weighted Return (Annualized) |
Inflation And Risk-Adjusted Expected Returns |
Expected Market Return Vs. Historical Inflation-Adjusted Return |
Years To Double |
|
2027 |
53.77% |
8.99% |
6.74% |
4.63% |
68.09% |
15.55 |
(Source: DK S&P 500 Valuation And Total Return Tool)
FMS Long-Term Consensus Total Return Potential (Ignoring Valuation Entirely, Cancels Out Over Time)
|
Investment Strategy |
Yield |
LT Consensus Growth |
LT Consensus Total Return Potential |
Long-Term Risk-Adjusted Expected Return |
Long-Term Inflation And Risk-Adjusted Expected Returns |
Years To Double Your Inflation & Risk-Adjusted Wealth |
10-Year Inflation And Risk-Adjusted Expected Return |
|
Fresenius Medical Care (Analyst Consensus) |
3.1% |
15.40% |
18.5% |
13.0% |
10.5% |
6.9 |
2.71 |
|
Fresenius Medical Care (20-Year Growth Rate Of 8.3%) |
3.1% |
8.30% |
11.4% |
8.0% |
5.5% |
13.1 |
1.71 |
|
Dividend Aristocrats |
2.6% |
8.6% |
11.1% |
7.8% |
5.3% |
13.5 |
1.68 |
|
S&P 500 |
1.7% |
8.5% |
10.2% |
7.1% |
4.7% |
15.4 |
1.58 |
(Sources: Morningstar, FactSet, YCharts)
Analysts think FMS could deliver 18.5% long-term returns, but even if it grows at the same rate as in the last 20 years, it’s likely to beat the S&P 500 and aristocrats.
-
if analysts are right, it beats the Nasdaq long-term
-
and in the medium term, it could be one of the best-performing stocks in the world
FMS Total Returns Since October 2002 (The Last Time It Was This Undervalued, Bottom Of Its Last Medicare Induced Crash)
-
2002: 83% return (in the last 3 months of the year)
-
2003: 73% return
-
by Jan 2018: 14X inflation-adjusted return vs. 3.4X S&P 500
-
still beating the market despite a 56% crash since Jan 2018
The power of deep value aristocrat investing.
A Dividend Growth Blue-Chip You Can Trust
|
Portfolio |
1998 Income Per $1000 Investment |
2021 Income Per $1000 Investment |
Annual Income Growth |
Starting Yield |
2021 Yield On Cost |
|
S&P 500 |
$21 |
$130 |
8.25% |
2.1% |
13.0% |
|
Fresenius Medical Care |
$8 |
$99 |
11.56% |
0.8% |
9.9% |
(Source: Portfolio Visualizer Premium)
In 1998 FMS had a yield of just 0.8%, one-fourth of its current level. And it delivered almost 12% annual income growth, 50% more than the S&P 500.
What about the future? According to analysts, FMS is expected to grow 2X as fast as it has in the last 20 years. And it’s starting with a much higher safe yield.
FMS Consensus Future Income Growth Potential
|
Analyst Consensus Income Growth Forecast |
Risk-Adjusted Expected Income Growth |
Risk And Tax-Adjusted Expected Income Growth |
Risk, Inflation, And Tax Adjusted Income Growth Consensus |
|
26.4% |
18.5% |
15.7% |
13.2% |
(Source: DK Research Terminal, FactSet)
Analysts think FMS could deliver 26% annual income growth, which adjusted for the risk of the company not growing as expected, inflation, and taxes is 13.2% real expected income growth.
Now compare that to what they expect from the S&P 500.
|
Time Frame |
S&P Inflation-Adjusted Dividend Growth |
S&P Inflation-Adjusted Earnings Growth |
|
1871-2021 |
1.6% |
2.1% |
|
1945-2021 |
2.4% |
3.5% |
|
1981-2021 (Modern Falling Rate Era) |
2.8% |
3.8% |
|
2008-2021 (Modern Low Rate Era) |
3.5% |
6.2% |
|
FactSet Future Consensus |
2.0% |
5.2% |
(Sources: S&P, FactSet, Multipl.com)
-
1.7% post-tax inflation-adjusted income growth from the S&P 500
-
S&P 500’s historical post-tax inflation-adjusted income growth rate (current tax code) is 5.8% CAGR
What about a 60/40 retirement portfolio?
-
0.5% consensus inflation, risk, and tax-adjusted income growth.
In other words, FMS is expected to potentially generate about 8X faster real income growth than the S&P 500 and 26X faster income growth than a 60/40.
-
conservatively it should at least double the market’s income growth
What inflation-adjusted returns do analysts expect in the future?
Inflation-Adjusted Consensus Return Potential: $1,000 Initial Investment (Ignoring Valuation)
|
Time Frame (Years) |
7.7% CAGR Inflation-Adjusted S&P Consensus |
8.6% Inflation-Adjusted Aristocrat Consensus |
16.0% CAGR Inflation-Adjusted FMS Guidance |
Difference Between Inflation-Adjusted FMS Consensus And S&P Consensus |
|
5 |
$1,451.05 |
$1,512.69 |
$2,103.06 |
$590.37 |
|
10 |
$2,105.56 |
$2,288.22 |
$4,422.86 |
$2,134.64 |
|
15 |
$3,055.27 |
$3,461.36 |
$9,301.53 |
$5,840.17 |
|
20 |
$4,433.36 |
$5,235.95 |
$19,561.67 |
$14,325.72 |
|
25 |
$6,433.04 |
$7,920.35 |
$41,139.34 |
$33,218.99 |
|
30 |
$9,334.69 |
$11,981.01 |
$86,518.46 |
$74,537.45 |
(Source: DK Research Terminal, FactSet)
Analysts currently expect FMS to potentially deliver life-changing wealth over the coming years and decades.
|
Time Frame (Years) |
Ratio Aristocrats/S&P Consensus |
Ratio Inflation-Adjusted FMS Consensus vs. S&P consensus |
|
5 |
1.04 |
1.45 |
|
10 |
1.09 |
2.10 |
|
15 |
1.13 |
3.04 |
|
20 |
1.18 |
4.41 |
|
25 |
1.23 |
6.40 |
|
30 |
1.28 |
9.27 |
(Source: DK Research Terminal, FactSet)
Potentially as much as 9X the market’s return and 7.2X more than the dividend aristocrats.
FMS Investment Decision Score
Dividend Kings
For anyone comfortable with its risk profile, FMS is one of the most reasonable and prudent high-yield deep value aristocrats you can buy today.
-
43% discount vs 1% market discount = 42% better valuation
-
3.1% yield vs. 1.7% yield (and a much safer yield at that)
-
85% better consensus long-term return potential
-
3X better risk-adjusted expected return over the next five years
-
29% of your investment repaid in consensus dividends within five years, about 2.5X more than the S&P 500
Reason Two: Fresenius Is One Of The Highest Quality Dividend Stocks On Earth
There are many ways to measure safety and quality, and I factor in pretty much all of them.
The Dividend Kings’ overall quality scores are based on a 257-point model that includes:
-
Dividend safety
-
Balance sheet strength
-
Credit ratings
-
Credit default swap medium-term bankruptcy risk data
-
Short and long-term bankruptcy risk
-
Accounting and corporate fraud risk
-
Profitability and business model
-
Growth consensus estimates
-
Management growth guidance
-
Historical earnings growth rates
-
Historical cash flow growth rates
-
Historical dividend growth rates
-
Historical sales growth rates
-
Cost of capital
-
GF Scores
-
Morningstar business model uncertainty score
-
Long-term risk-management scores from MSCI, Morningstar, FactSet, S&P, Reuters’/Refinitiv, and Just Capital
-
Management quality
-
Dividend-friendly corporate culture/income dependability
-
Long-term total returns (a Ben Graham sign of quality)
-
Analyst consensus long-term return potential
It includes over 1,000 fundamental metrics, including the 12 rating agencies we use to assess fundamental risk.
-
credit and risk management ratings make up 41% of the DK safety and quality model
-
dividend/balance sheet/risk ratings make up 82% of the DK safety and quality model
How do we know that our safety and quality model works well?
During the two worst recessions in 75 years, our safety model 87% of blue-chip dividend cuts, the ultimate baptism by fire for any dividend safety model.
How does FMS score on our comprehensive safety and quality models?
Fresenius Dividend Safety
|
Rating |
Dividend Kings Safety Score (163 Point Safety Model) |
Approximate Dividend Cut Risk (Average Recession) |
Approximate Dividend Cut Risk In Pandemic Level Recession |
|
1 – unsafe |
0% to 20% |
over 4% |
16+% |
|
2- below average |
21% to 40% |
over 2% |
8% to 16% |
|
3 – average |
41% to 60% |
2% |
4% to 8% |
|
4 – safe |
61% to 80% |
1% |
2% to 4% |
|
5- very safe |
81% to 100% |
0.5% |
1% to 2% |
|
FMS |
85% |
0.50% |
1.80% |
|
Risk Rating |
Low-Risk (71st industry percentile risk-management consensus) |
BBB stable outlook credit rating 7.5% 30-year bankruptcy risk |
20% OR LESS Max Risk Cap Recommendation |
Long-Term Dependability
|
Company |
DK Long-Term Dependability Score |
Interpretation |
Points |
|
Non-Dependable Companies |
21% or below |
Poor Dependability |
1 |
|
Low Dependability Companies |
22% to 60% |
Below-Average Dependability |
2 |
|
S&P 500/Industry Average |
61% (61% to 70% range) |
Average Dependability |
3 |
|
Above-Average |
71% to 80% |
Very Dependable |
4 |
|
Very Good |
81% or higher |
Exceptional Dependability |
5 |
|
FMS |
90% |
Exceptional Dependability |
5 |
Overall Quality
|
FMS |
Final Score |
Rating |
|
Safety |
85% |
5/5 Very Safe |
|
Business Model |
80% |
3/3 Wide And Stable Moat |
|
Dependability |
90% |
5/5 Exceptional |
|
Total |
86% |
13/13 Ultra SWAN Global Aristocrat |
|
Risk Rating |
3/3 Low-Risk |
|
|
20% OR LESS Max Risk Cap Rec |
5% Margin of Safety For A Potentially Good Buy |
FMS is the 128th highest quality company on the DK 500 Master list.
How significant is this? The DK 500 Master List is one of the world’s best watchlists, including
-
every dividend aristocrat (S&P companies with 25+ year dividend growth streaks)
-
every dividend champion (every company, including foreign, with 25+ year dividend growth streaks)
-
every dividend king (every company with 50+ year dividend growth streaks)
-
every foreign aristocrat (every company with 20+ year dividend growth streaks)
-
every Ultra SWAN (wide moat aristocrats, as close to perfect quality companies as exist)
-
40 of the world’s best growth stocks
In other words, even among the world’s best companies, FMS is higher quality than 78% of them.
Why I Trust Fresenius And So Can You
Fresenius was founded in 1996 in Bad Homburg, Germany.
-
345,425 patients at the end of 2021
-
4,171 dialysis centers around the world
-
69% of revenue from North America (mostly the US)
-
expected to increase to 76% by 2025
-
53 million dialysis treatments in 2021 (average of 153 per year per patient, once every 2 days)
-
78% of patients “highly recommend” FMS
-
34% global market share
FMS is the only fully integrated dialysis company in the world.
-
80% of revenue from dialysis
-
20% of revenue from dialysis products
“The company’s position as the top dialysis service provider and equipment maker in the world remains symbiotic and unique. Fresenius’ experience operating over 4,100 dialysis clinics around the globe (about 1,000 more than the next-largest player, DaVita) gives it insights into caregiver and patient needs to inform service offerings and product innovation.
Fresenius Medical Care treats end-stage renal disease patients through its dialysis clinic network, medical technology, and care coordination activities. Its strengths in these related areas help Fresenius maintain the leading global position in this market.
With global ESRD patient growth expected to remain in the low to mid-single digits in the long run, we expect top-line growth for Fresenius to be toward the top of that range after a very weak 2021 and even higher earnings growth compounded annually during the next five years, as the firm wrings out more efficiencies and repurchases shares.” – Morningstar
No one in the world has the technology, expertise, or scale that FMS does.
If you believe that obesity, diabetes, and kidney failure will grow in the future (sadly, they will), then you understand FMS’s core growth thesis.
FMS and DaVita control 75% of the global market, where the majority of profits in this industry are made.
-
FMS has profitability in the top 20% of its peers
-
and with regulatory uncertainty at the highest levels in 20 years, no one is going to spend billions to recreate their network capacity
“The Medicare Payment Advisory Commission has identified higher-volume dialysis facilities as having a cost-per-treatment advantage based on direct reports from individual clinics. Based on the treatments per facility, we think Fresenius and DaVita benefit from a mild cost advantage versus their smaller dialysis clinic peers.” – Morningstar
570,000 Americans are getting treatment for kidney disease. If Congress ever tries to change this, it will be a PR nightmare.
-
Thousands of dead children laid at the feet of Congress
FMS can offer dialysis cheaper than smaller clinics and is improving on cost-effective and safe at-home solutions.
-
Currently, 15% of its treatments.
FMS working with CMS is the easiest way to lower the cost of dialysis.
-
Because literally, no one can do it cheaper than FMS
In Q1’s conference call, management focused a lot on the company’s challenges.
“We were expecting a weak start into the year, driven by high excess mortality and inflationary pressures in all spending categories for the company. January excess mortality was even higher than expected. And while we did see very significant declines in February and March, overall, first quarter excess mortality was higher than we had assumed…
We all see higher oil and energy prices, increasing raw materials and logistics costs. We have a sizable negative effect, particularly on our product margins, which are already under inflationary pressures…
Despite the unprecedented and not improving labor shortage situation and the resulting lack of training capacity for our home dialysis business. I’m glad to say that we’ve managed to keep our share of U.S. treatments in a home setting at a high level of slightly more than 15% through the first quarter…
We also had negative impacts of €22 million related to the war in Ukraine, consisting mainly of bad debt expenses in Ukraine and Russia. These costs have been treated as special items. ” – CEO, Q1 conference call
FMS is dealing with rising input prices, a labor shortage, and excess mortality that continues to be caused by the pandemic.
-
$100 million cost due to excess mortality in Q1
However, rating agencies and analysts remain confident that FMS will overcome these challenges just as it has adapted and overcome all challenges for the last 26 years.
Quantitative Analysis: The Math Backing Up The Investment Thesis
Ben Graham recommended combining qualitative (the story) analysis with quantitative analysis looking at the past, present, and likely future.
FMS Credit Ratings
|
Rating Agency |
Credit Rating |
30-Year Default/Bankruptcy Risk |
Chance of Losing 100% Of Your Investment 1 In |
|
S&P |
BBB Stable Outlook |
7.50% |
13.3 |
|
Fitch |
BBB- Stable Outlook |
11.00% |
9.1 |
|
Moody’s |
Baa3 (BBB- equivalent) Stable Outlook |
11.00% |
9.1 |
|
Consensus |
BBB- Stable Outlook |
9.83% |
10.2 |
(Source: S&P, Fitch, Moody’s)
FMS has a 9.8% fundamental risk, according to rating agencies.
-
3% is the dividend aristocrat average
S&P last reviewed FMS in May 2022.
Fresenius Group Upgraded To ‘BBB’ On Reduced Risk Of Acquisitions Denting The Balance Sheet; Outlook Stable” – S&P
Rating agencies have kept FMS’s rating low due to its history of debt-funded acquisitions.
“FSE’s financial profile is characterized by a track record of acquisitions that use debt as the primary source of financing. Acquisitions exceeded €2.0 billion per year between 2012 and 2014. After a temporary break in 2015, the group announced the sizable acquisition of Quironsalud for almost €6.0 billion in 2016 and then that of NxStage for about €1.7 billion in 2017, which only closed in 2019. The group also bid for Akorn, a U.S. hospital supplier, for an enterprise value of about $5.2 billion. Still, Fresenius eventually canceled the transaction.” – S&P
FMS Leverage Consensus Forecast
|
Year |
Debt/EBITDA |
Net Debt/EBITDA (3.0 Or Less Safe According To Credit Rating Agencies) |
Interest Coverage (8+ Safe) |
|
2020 |
1.92 |
2.76 |
6.10 |
|
2021 |
3.01 |
3.33 |
6.08 |
|
2022 |
2.80 |
3.21 |
5.87 |
|
2023 |
2.56 |
2.76 |
6.77 |
|
2024 |
2.04 |
2.35 |
7.10 |
|
2025 |
1.32 |
2.17 |
8.34 |
|
2026 |
0.97 |
NA |
10.32 |
|
Annualized Change |
-10.80% |
-4.72% |
9.16% |
(Source: FactSet Research Terminal)
Analysts expect FMS’s leverage to reach safe levels this year, net leverage to become safe next year, and interest coverage to become safe in 2025.
FMS Balance Sheet Consensus Forecast
|
Year |
Total Debt (Millions) |
Cash |
Net Debt (Millions) |
Interest Cost (Millions) |
EBITDA (Millions) |
Operating Income (Millions) |
|
2020 |
$9,467 |
$1,305 |
$13,624 |
$494 |
$4,934 |
$3,012 |
|
2021 |
$11,722 |
$1,647 |
$12,983 |
$345 |
$3,898 |
$2,097 |
|
2022 |
$10,657 |
$1,697 |
$12,224 |
$348 |
$3,805 |
$2,043 |
|
2023 |
$10,689 |
$2,106 |
$11,513 |
$357 |
$4,170 |
$2,417 |
|
2024 |
$9,534 |
$2,146 |
$10,981 |
$393 |
$4,675 |
$2,789 |
|
2025 |
$6,298 |
$1,316 |
$10,378 |
$406 |
$4,787 |
$3,386 |
|
2026 |
$5,154 |
$1,056 |
NA |
$358 |
$5,333 |
$3,693 |
|
2027 |
$4,063 |
$1,393 |
NA |
NA |
NA |
$3,901 |
|
Annualized Growth |
-11.38% |
0.94% |
-5.30% |
-5.23% |
1.30% |
3.76% |
(Source: FactSet Research Terminal)
Debt is expected to fall at 11% annually and net debt 5.3% annually while cash flows recover strongly from the Pandemic.
FMS Bond Profile
-
$4.9 billion in liquidity
-
well-staggered bond maturities (no problem refinancing maturing debt)
-
93% unsecured bonds for very good financial flexibility
-
bond investors are confident enough in FMS to lend to them at 3.5% for eight years (1.5% originally)
-
the average borrowing cost is 2.5%
-
0% after the bond market’s 30-year inflation expectations
-
0% real borrowing costs vs. 7.5% cash returns on invested capital
FMS Credit Default SWAPs: Real-Time Fundamental Risk Analysis From The Bond Market
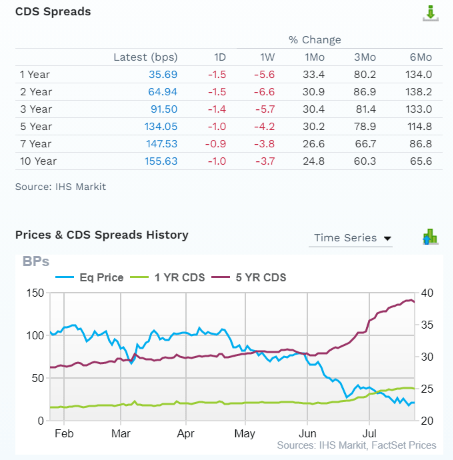
FactSet
Credit default SWAPs are the insurance policies bond investors take out against default.
-
they represent real-time fundamental risk assessment from the “smart money” on Wall Street
-
FMS’s fundamental risk roughly doubled following the Supreme court decision
-
the bond market is pricing in a 4.67% 30-year default risk, which is consistent with BBB+ credit ratings
-
higher than its actual credit ratings
-
analysts, rating agencies, and the bond market all agree
-
FMS’s thesis is intact
-
19 analysts, seven rating agencies, and the bond market make up our FMS expert consensus
-
26 expert consensus + the bond market monitoring ENB’s risk profile
-
how we track fundamental risk in real-time
-
to ensure high-probability/low-risk investment recommendations
FMS GF Score: The Newest Addition To The DK Safety And Quality Model
The GF Score is a ranking system that is closely correlated to the long-term performances of stocks by back testing from 2006 to 2021.” – Gurufocus
GF Score considers five key aspects. They are:
-
Financial Strength
-
Profitability
-
Growth
-
Valuation
-
Momentum
FMS’s good 82/100 GF score confirms its solid fundamentals, attractive valuation, and appealing investment potential.
FMS Profitability: Wall Street’s Favorite Quality Proxy
FMS’s profitability is historically in the top 20% of its peers.
-
A wide moat company
-
regulatory uncertainty now makes that moat stronger
-
no one is going to spend billions recreating 4,100 dialysis centers with regulatory uncertainty hanging over the industry
FMS Trailing 12-Month Profitability Vs. Peers
|
Metric |
TTM |
Industry Percentile |
Major Healthcare providers More Profitable Than FMS (Out Of 673) |
|
Gross Margins |
28.56% |
29 |
478 |
|
Operating Margin |
9.19% |
64.5 |
239 |
|
Net Margin |
4.89% |
62.65 |
251 |
|
Return On Equity |
7.10% |
56.71 |
291 |
|
Return On Assets |
2.60% |
55.87 |
297 |
|
Returns On Invested Capital |
3.99% |
55.06 |
302 |
|
Return On Capital (Greenblatt) |
17.73% |
60.03 |
269 |
|
Return On Capital Employed |
6.74% |
55.28 |
301 |
|
Average |
10.10% |
54.89 |
304 |
(Source: GuruFocus Premium)
In a hellish year of many problems, FMS’s overall profitability remained in the top 45% of peers, with returns on capital in the top 40%.
FMS has managed to maintain stable industry-leading profitability for the last 26 years.
FMS Profit Margin Consensus Forecast
|
Year |
FCF Margin |
EBITDA Margin |
EBIT (Operating) Margin |
Net Margin |
Return On Capital Expansion |
Return On Capital Forecast |
|
2020 |
17.6% |
22.7% |
13.9% |
6.5% |
1.33 |
|
|
2021 |
9.3% |
19.5% |
10.5% |
5.5% |
TTM ROC |
17.73% |
|
2022 |
7.5% |
19.1% |
10.2% |
5.2% |
Latest ROC |
14.00% |
|
2023 |
8.7% |
19.8% |
11.5% |
6.1% |
2027 ROC |
23.64% |
|
2024 |
9.7% |
21.1% |
12.6% |
7.0% |
2027 ROC |
18.67% |
|
2025 |
8.4% |
20.2% |
14.3% |
8.0% |
Average |
21.16% |
|
2026 |
10.6% |
20.2% |
14.0% |
8.1% |
Industry Median |
10.29% |
|
2027 |
NA |
NA |
14.0% |
8.3% |
FMS/Industry Median |
2.06 |
|
Annualized Growth |
-8.05% |
-1.95% |
0.14% |
3.51% |
Vs. S&P |
1.45 |
|
Annualized Growth (Post Pandemic/Insurance Business Sale) |
2.79% |
0.67% |
4.91% |
7.09% |
(Source: FactSet Research Terminal)
Outside of the pandemic, analysts expect modest to impressive 0.7% to 7.1% margin growth for FMS in the next few years.
Returns on capital are expected to rise to 2X its industry norm and 1.5X that of the S&P 500.
-
confirming the stability of its wide moat
Reason Three: A Strong Growth Runway For Decades To Come
FMS is priced for -2.8% CAGR growth according to the Graham/Dodd fair value formula. And here’s what analysts actually expect.
FMS Medium-Term Growth Consensus Forecast
|
Year |
Sales |
Free Cash Flow |
EBITDA |
EBIT (Operating Income) |
Net Income |
|
2020 |
$21,716 |
$3,819 |
$4,934 |
$3,012 |
$1,415 |
|
2021 |
$19,970 |
$1,849 |
$3,898 |
$2,097 |
$1,098 |
|
2022 |
$19,937 |
$1,487 |
$3,805 |
$2,043 |
$1,027 |
|
2023 |
$21,015 |
$1,831 |
$4,170 |
$2,417 |
$1,288 |
|
2024 |
$22,117 |
$2,146 |
$4,675 |
$2,789 |
$1,549 |
|
2025 |
$23,657 |
$1,988 |
$4,787 |
$3,386 |
$1,901 |
|
2026 |
$26,418 |
$2,807 |
$5,333 |
$3,693 |
$2,136 |
|
2027 |
$27,860 |
NA |
NA |
$3,901 |
$2,311 |
|
Annualized Growth |
3.62% |
-5.00% |
1.30% |
3.76% |
7.26% |
|
Annualized Growth (Post Pandemic) |
5.71% |
8.71% |
6.47% |
10.90% |
13.21% |
|
Cumulative (2022 Through 2026) |
$113,144 |
$10,259 |
$22,770 |
$14,328 |
$7,901 |
(Source: FactSet Research Terminal)
Post pandemic analysts expect sales growth of around 6%, with earnings and cash flows growing at 6.5% to 13.2% CAGR.
$10.3 billion in cumulative consensus free cash flow over the next five years compared to $7.9 billion in net profit.
-
130% earnings to free cash flow conversion ratio are excellent for this industry and blue-chip in general
A company’s cash conversion ratio is usually a good indicator of:
-
efficient capital allocation
-
low risk of fraud
Most blue-chips will have close to 100% cash conversion ratios over the long term.
Companies with low ratios are potentially poorly run and or committing accounting fraud.
FMS’s excellent cash conversion further indicates good management, a solid business, and honest accounting.
-
as well as a very safe dividend
FMS Dividend Growth Consensus Forecast
|
Year |
Dividend Consensus |
EPS/Share Consensus |
EPS Payout Ratio |
Retained (Post-Dividend) Earnings |
Buyback Potential |
Debt Repayment Potential |
|
2022 |
$0.68 |
$1.93 |
35.2% |
$733 |
5.60% |
6.9% |
|
2023 |
$0.75 |
$2.29 |
32.8% |
$902 |
6.90% |
8.4% |
|
2024 |
$0.85 |
$2.69 |
31.6% |
$1,078 |
8.24% |
10.1% |
|
2025 |
$1.00 |
$3.15 |
31.7% |
$1,260 |
9.63% |
13.2% |
|
Total 2022 Through 2025 |
$3.28 |
$10.06 |
32.6% |
$3,973.08 |
30.37% |
37.17% |
|
Annualized Rate |
13.72% |
17.74% |
-3.41% |
19.81% |
19.81% |
24.35% |
(Source: FactSet Research Terminal)
60% is the safe payout ratio for this industry, according to rating agencies.
-
the payout ratio is a very safe 35% in 2022 and is expected to fall to 32% by 2025
-
average 33% through 2025
-
14% annual dividend growth and 18% EPS growth
-
$4 billion in consensus post-dividend retained earnings through 2025
-
enough to pay off almost 37% of its debt
-
or buyback up to 30% of shares at existing valuations
FMS Buyback Consensus Forecast
|
Year |
Consensus Buybacks ($ Millions) |
% Of Shares (At Current Valuations) |
Market Cap |
|
2022 |
$2 |
0.0% |
$13,080 |
|
2023 |
$2 |
0.0% |
$13,080 |
|
2024 |
$3 |
0.0% |
$13,080 |
|
Total 2022-2024 |
$7 |
0.1% |
$13,080 |
|
Annualized Rate |
0.03% |
Average Annual Buybacks |
$2 |
(Source: FactSet Research Terminal)
Analysts don’t expect FMS to buy back much stock despite its low valuation.
Over the last 10 years, FMS has bought back 4% of its net shares.
FMS Long-Term Growth Outlook
-
1.1% to 15.4% growth consensus range (five sources)
-
the median consensus from all 22 analysts is 15.4%
How accurate are analyst forecasts for FMS (partially based on management guidance)?
-
Smoothing for outliers, historical analyst margins-of-error are 20% to the downside and 5% to the upside
-
margin-of-error adjusted consensus growth range: 0.8% to 16% CAGR
-
70% statistical probability that FMS grows 0.8% to 16% over time
Analysts are now extremely bullish on FMS, expecting very strong post-pandemic growth though I think the 20-year historical growth rate of 8% is likely a more realistic long-term forecast.
However, FMS has the catalysts, growth markets, and financial resources to potentially double its historical growth rate.
Reason Four: A Wonderful Company At A Ridiculous Wonderful Price
For the last six to 20 years, tens of millions of income investors have consistently paid 18X to 19X earnings outside of bear markets and bubbles for FMS.
-
even when it was growing near zero
-
imagine what they might pay if FMS doubles its historical growth rate?
-
91% statistical probability that intrinsic value is 18X to 19X earnings
|
Metric |
Historical Fair Value Multiples (16-Years) |
2021 |
2022 |
2023 |
2024 |
2025 |
12-Month Forward Fair Value |
|
Earnings |
18.39 |
$36.23 |
$35.49 |
$42.11 |
$49.47 |
$57.93 |
|
|
Average |
$36.23 |
$35.49 |
$42.11 |
$49.47 |
$57.93 |
$39.18 |
|
|
Current Price |
$22.76 |
||||||
|
Discount To Fair Value |
37.18% |
35.87% |
45.96% |
53.99% |
60.71% |
41.92% |
|
|
Upside To Fair Value (NOT Including Dividends) |
59.18% |
55.94% |
85.03% |
117.35% |
154.52% |
72.17% (75% including dividend) |
|
|
2022 EPS |
2023 EPS |
2021 Weighted EPS |
2022 Weighted EPS |
12-Month Forward EPS |
12-Month Average Fair Value Forward PE |
Current Forward PE |
|
|
$1.93 |
$2.29 |
$0.85 |
$1.28 |
$2.13 |
18.4 |
10.7 |
I estimate FMS is conservatively worth 18.4X earnings and today trades at 10.7X.
-
7.4X cash-adjusted earnings
-
anti-bubble valuation by even private equity standards
-
priced for -2.8% growth
-
as long as FMS grows at 0+%, it’s mathematically impossible to lose money over the long-term
-
as long as you avoid becoming a forced seller for emotional or financial reasons
|
Analyst Median 12-Month Price Target |
Morningstar Fair Value Estimate |
|
$33.09 (15.5 PE) |
$42.00 (19.7 PE) |
|
Discount To Price Target (Not A Fair Value Estimate) |
Discount To Fair Value |
|
31.22% |
45.81% |
|
Upside To Price Target (Not Including Dividend) |
Upside To Fair Value (Not Including Dividend) |
|
45.39% |
84.53% |
|
12-Month Median Total Return Price (Including Dividend) |
Fair Value + 12-Month Dividend |
|
$33.80 |
$42.71 |
|
Discount To Total Price Target (Not A Fair Value Estimate) |
Discount To Fair Value + 12-Month Dividend |
|
32.66% |
46.71% |
|
Upside To Price Target (Including Dividend) |
Upside To Fair Value + Dividend |
|
48.50% |
87.65% |
Morningstar’s discounted cash flow model estimates that FMS is worth 19.7X earnings and has an 88% upside to fair value.
Analysts expect a 15.5 P/E within 12 months and a 49% total return.
Fundamentally speaking FMS could soar 75% within 12 months and simply return to fair value.
-
just like it did in the final 3 months of 2002
-
and again in 2003
-
the last time it was this undervalued
I don’t recommend companies based on 12-month forecasts but on the margin of safety and whether or not it sufficiently compensates you for a company’s risk profile.
Margin Of Safety Not 12-Month Price Targets Are How I Make Investment Decisions
|
Rating |
Margin Of Safety For Low-Risk 13/13 Ultra SWAN quality companies |
2022 Fair Value Price |
2023 Fair Value Price |
12-Month Forward Fair Value |
|
Potentially Reasonable Buy |
0% |
$35.49 |
$42.11 |
$39.18 |
|
Potentially Good Buy |
5% |
$33.72 |
$40.01 |
$37.23 |
|
Potentially Strong Buy |
15% |
$30.17 |
$35.80 |
$33.31 |
|
Potentially Very Strong Buy |
25% |
$25.29 |
$31.58 |
$29.39 |
|
Potentially Ultra-Value Buy |
35% |
$23.07 |
$27.37 |
$25.47 |
|
Currently |
$22.76 |
35.87% |
45.96% |
41.92% |
|
Upside To Fair Value (Not Including Dividends) |
55.94% |
85.03% |
72.17% |
FMS is a potential Ultra Value Buffett-style “fat pitch” opportunity for anyone comfortable with its risk profile.
Risk Profile: Why Fresenius Isn’t Right For Everyone
There are no risk-free companies, and no company is right for everyone. You have to be comfortable with the fundamental risk profile.
What Could Cause FMS’s Investment Thesis To Break
-
safety falls to 40% or less
-
balance sheet collapses (10% probability according to rating agencies)
-
a giant failed acquisition (FMS likes to acquire major rivals)
-
CMS applies draconian cost-cutting to dialysis and significantly and permanently impairs FMS profitability
-
growth outlook falls to less than 5% for seven years
-
FMS’s role in my portfolio is to deliver long-term 8+% returns with minimal fundamental risk
-
8+% total return requirement for defensive sectors (including healthcare)
-
10+% for non-defensive (cyclical) sectors
How long it takes for a company’s investment thesis to break depends on the quality of the company.
|
Quality |
Years For The Thesis To Break Entirely |
|
Below-Average |
1 |
|
Average |
2 |
|
Above-Average |
3 |
|
Blue-Chip |
4 |
|
SWAN |
5 |
|
Super SWAN |
6 |
|
Ultra SWAN |
7 |
|
100% Quality Companies (MSFT, LOW, and MA) |
8 |
These are my rule of thumb for when to sell a stock if the investment thesis has broken. FMS is highly unlikely to suffer such catastrophic declines in fundamentals.
Risk Profile Summary
-
high reliance on the US market (69% of 2021 sales and 76% 2025 consensus)
-
M&A execution risk: from future debt-funded deals
-
regulatory risk: CMS changing pricing for dialysis is the biggest risk to long-term profitability
-
talent retention risk in the tightest job market in 50 years (high wage costs right now)
-
inflation risk: a big impact on margins this year due to relatively fixed pricing
-
currency risk: including the dividend
-
governance risk: controlled by a German foundation
“We also think investors should be aware of the firm’s ownership structure, which does not adequately protect outside shareholders, in our opinion.
The management team of Fresenius Medical Care is controlled by minority owner Fresenius SE, which is controlled by another minority shareholder, the Else Kroener-Fresenius-Stiftung, a nonprofit foundation created by Kroener, who was the foster daughter of Fresenius SE’s founder.
While we do not have any specific concerns about the actions of these owners currently, we believe this ownership structure holds the potential for abuse and much prefer to see control of an organization in the hands of a majority of shareholders rather than the minority.” – Morningstar
How do we quantify, monitor, and track such a complex risk profile? By doing what big institutions do.
Long-Term Risk Analysis: How Large Institutions Measure Total Risk
-
see the risk section of this video to get an in-depth view (and link to two reports) of how DK and big institutions measure long-term risk management by companies
FMS Long-Term Risk-Management Consensus
|
Rating Agency |
Industry Percentile |
Rating Agency Classification |
|
MSCI 37 Metric Model |
51.0% |
BBB Average, Positive Trend |
|
Morningstar/Sustainalytics 20 Metric Model |
94.9% |
17.0/100 Low Risk |
|
Reuters’/Refinitiv 500+ Metric Model |
97.4% |
Excellent |
|
S&P 1,000+ Metric Model |
65.0% |
Above-Average, Positive Trend |
|
FactSet |
30.0% |
Below-Average, Stable Trend |
|
Morningstar Global Percentile (All 15,000 Rated Companies) |
85.6% |
Very Good |
|
Consensus |
71% |
Low-Risk, Good Risk-Management, Stable Trend |
(Sources: MSCI, Morningstar, FactSet, S&P, Reuters)
FMS’s Long-Term Risk Management Is The 162nd Best In The Master List (68th Percentile)
|
Classification |
Average Consensus LT Risk-Management Industry Percentile |
Risk-Management Rating |
|
S&P Global (SPGI) #1 Risk Management In The Master List |
94 |
Exceptional |
|
Strong ESG Stocks |
78 |
Good – Bordering On Very Good |
|
Foreign Dividend Stocks |
75 |
Good |
|
Fresenius Medical Care |
71 |
Good |
|
Ultra SWANs |
71 |
Good |
|
Low Volatility Stocks |
68 |
Above-Average |
|
Dividend Aristocrats |
67 |
Above-Average |
|
Dividend Kings |
63 |
Above-Average |
|
Master List average |
62 |
Above-Average |
|
Hyper-Growth stocks |
61 |
Above-Average |
|
Monthly Dividend Stocks |
60 |
Above-Average |
|
Dividend Champions |
57 |
Average bordering on above-average |
(Source: DK Research Terminal)
FMS’s risk-management consensus is in the top 32% of the world’s highest quality companies and similar to that of such other blue-chips as
-
3M (MMM) Ultra SWAN dividend king
-
West Pharmaceutical Services (WST) Ultra SWAN dividend champion
-
Caterpillar (CAT) Ultra SWAN dividend aristocrat
-
British American Tobacco (BTI) Ultra SWAN global aristocrat
-
Clorox (CLX) Super SWAN dividend aristocrat
-
NextEra Energy (NEE) Super SWAN dividend aristocrat
-
McCormick (MKC) – Ultra SWAN dividend aristocrat
-
Johnson & Johnson (JNJ) Ultra SWAN dividend king
-
Federal Realty Investment Trust (FRT) Ultra SWAN dividend king
-
Enbridge (ENB) Ultra SWAN dividend aristocrat
The bottom line is that all companies have risks, and FMS is good at managing theirs.
How We Monitor FMS’ Risk Profile
-
19 analysts
-
3 credit rating agencies
-
7 total risk rating agencies
-
26 experts who collectively know this business better than anyone other than management
-
and the bond market for real-time fundamental risk updates
“When the facts change, I change my mind. What do you do, sir?” – John Maynard Keynes
There are no sacred cows at iREIT or Dividend Kings. Wherever the fundamentals lead, we always follow. That’s the essence of disciplined financial science, the math behind retiring rich and staying rich in retirement.
Bottom Line: It’s The Best Time In 21 Years To Buy This High-Yield Dividend Aristocrat
Are we headed for a recession in 2023? History and the bond market say yes, though most economists still anticipate slow but positive growth.
The good news is that $2.3 trillion in excess savings and $7 trillion in corporate cash means America has never been better prepared for a short and mild recession.
How mild? Bank of America’s latest 2023 US GDP economic growth forecast:
-
-0.2%
-
vs. -0.5% Deutsche Bank
-
vs. 2001’s -0.4% (the mildest recession in US history thus far )
Moody’s expects US job growth to fall steadily to 175K within 12 months.
-
potentially the first recession ever to see falling unemployment
-
Moody’s also expects US home prices to remain flat for 3 to 4 years
-
no big housing crash
Anyone willing to stomach the recent volatility is likely to be very pleased that they spent the 2022 bear market buying blue-chip bargains.
-
the average of the last 20 similar markets to this one saw stocks roar 281% higher in the following 10 years
-
a nearly 4X return 10 years after the bear market bottom
While I can’t predict the market in the short-term, here’s what I can tell you about FMS.
-
FMS is one of the world’s safest, most dependable, and highest quality companies on earth
-
top 22% of the world’s best blue chips
-
3.1% very safe and steadily growing yield expected to grow 14% annually in the coming years
-
18.5% CAGR long-term total return potential, I expect closer to 12%
-
43% discount to fair value = potential Ultra Value
-
10.7X earnings, 7.4X cash-adjusted earnings, lowest PE in 21 years
-
almost 250% consensus return potential over the next five years, 24% CAGR, about 5X more than the S&P 500
-
3X better risk-adjusted expected returns of the S&P 500 over the next five years with almost 2.5X higher consensus dividend income
In the short term, one year or less, studies show that luck is 33X as powerful as fundamentals. But over 30+ years, fundamentals are 33X as powerful as luck.
Or, to put it another way, over two to three years, your portfolio returns are a crap shoot. Over 20 to 30 years? They are destiny.
If you focus on the world’s best dividend blue chips, you never have to pray for luck because you’ll make your own.
That’s what Fresenius Medical Care offers anyone comfortable with its risk profile, who is willing to look at the fundamentals and beyond the “ugly” chart.
The difference between a value trap and a Buffett-style deep value opportunity that can change your life is all about safe dividends, sound balance sheets, decent strong potential, and management you can trust.
And that’s exactly what Fresenius offers today and why I just recommended it for Dividend Kings members and bought some more for my retirement portfolio.
Be the first to comment