

sykono
Thesis
Freeport-McMoRan Inc. (NYSE:FCX) has outperformed our expectations since we last updated in our previous article in early October. Accordingly, FCX notched a total return of nearly 33% compared to the S&P 500’s (SPX) (SP500) 9.4% uptick. Relative to FCX’s 5Y and 10Y total return of 24.7% and 2.2%, buyers who picked the recent lows bravely have been well rewarded as the market thrashed the bears.
As such, we believe it’s opportune to assess whether it’s appropriate for buyers to pause at the current levels, as we postulate a pullback looks increasingly likely.
Despite that, FCX’s long-term growth story remains healthy, and the forward curve of longer-dated copper futures (HG1:COM) has moved firmly back into contango. We have highlighted this phenomenon in our early October article as FCX continued to recover from its July and September lows.
Given Dr. Copper’s massive collapse from its March highs, we believe the market had already priced in significant risks in FCX’s valuation. We also gleaned that Wall Street analysts have turned so downbeat in the copper industry that net earnings revisions through November have likely reached highly pessimistic levels.
Moreover, analysts have also marked down Freeport-McMoRan’s earnings estimates significantly after its underwhelming Q3 report in October. Despite that, FCX’s significant market outperformance from its July/September lows suggests that the market’s forward-discounting mechanism is working very well, captured in FCX’s price action.
With the marked recovery from its recent bottom, we believe FCX’s reward/risk profile is more well-balanced at these levels. As such, investors are encouraged to wait patiently for a deeper pullback to digest its recent sharp recovery before considering adding more positions.
Revising from Buy to Hold.
FCX: Outperformed The Market Despite A Downcast Q3 Release
FCX Average copper price change % and production change % (Company filings)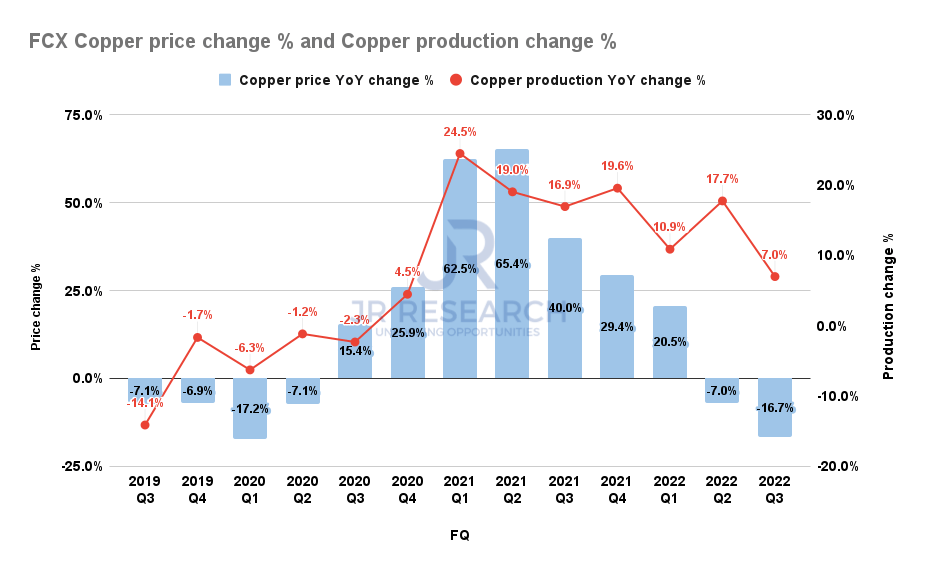
Freeport-McMoRan posted $3.5 in average copper price in FQ3, down 16.7% YoY. It also continued a significant moderation in average price growth, as seen above. Notwithstanding, the company highlighted that its inventories remain low, with production not likely to keep up with medium- and long-term demand.
It’s essential for investors to remember that Freeport-McMoRan’s growth drivers are bolstered by the decarbonization and electrification initiatives, as we discussed in our previous article. Coupled with rising commodity input costs that have kept production costs high, Freeport-McMoRan reiterated that copper futures don’t reflect realities in the physical market. CEO Richard Adkerson accentuated:
Physical market fundamentals remain tight, as evidenced by low levels of global exchange stocks. FCX’s global customer base reports healthy demand for copper. FCX believes the outlook for copper fundamentals in the medium- and long-term remain favorable, with studies indicating that demand for copper may double in 15 years based on the global movement towards decarbonization. In the current environment, stretched supply chains, [and] production shortfalls are becoming commonplace and cost curves are rising. (Freeport-McMoRan FQ3’22 earnings call)
Yet, Analysts Turned Highly Pessimistic On Copper
S&P 500 Copper industry net earnings revisions % (Yardeni Research, Refinitiv)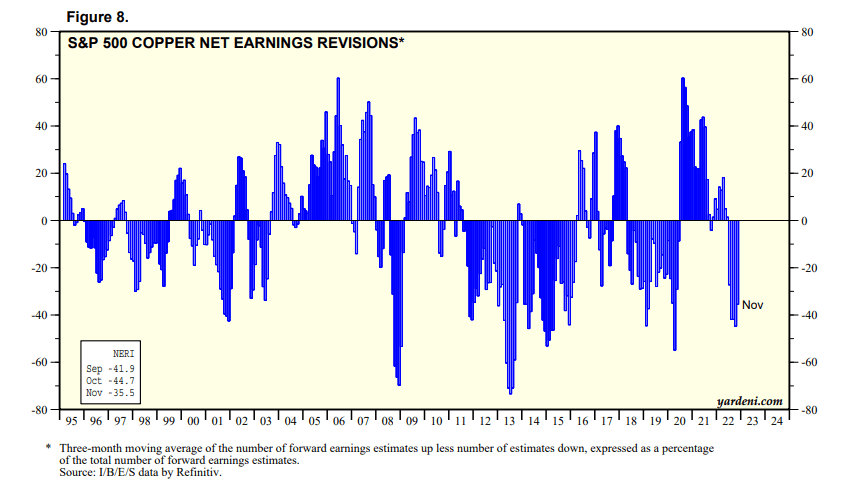
Yet, it didn’t stop analysts from becoming increasingly pessimistic as they continued to slash the Copper industry’s earnings estimates through November. Given Freeport-McMoRan’s tepid Q3 release, it likely triggered widespread fear in Wall Street as analysts adjusted their models to account for the increasing risks of a recession.
HG1 futures price chart (weekly) (TradingView)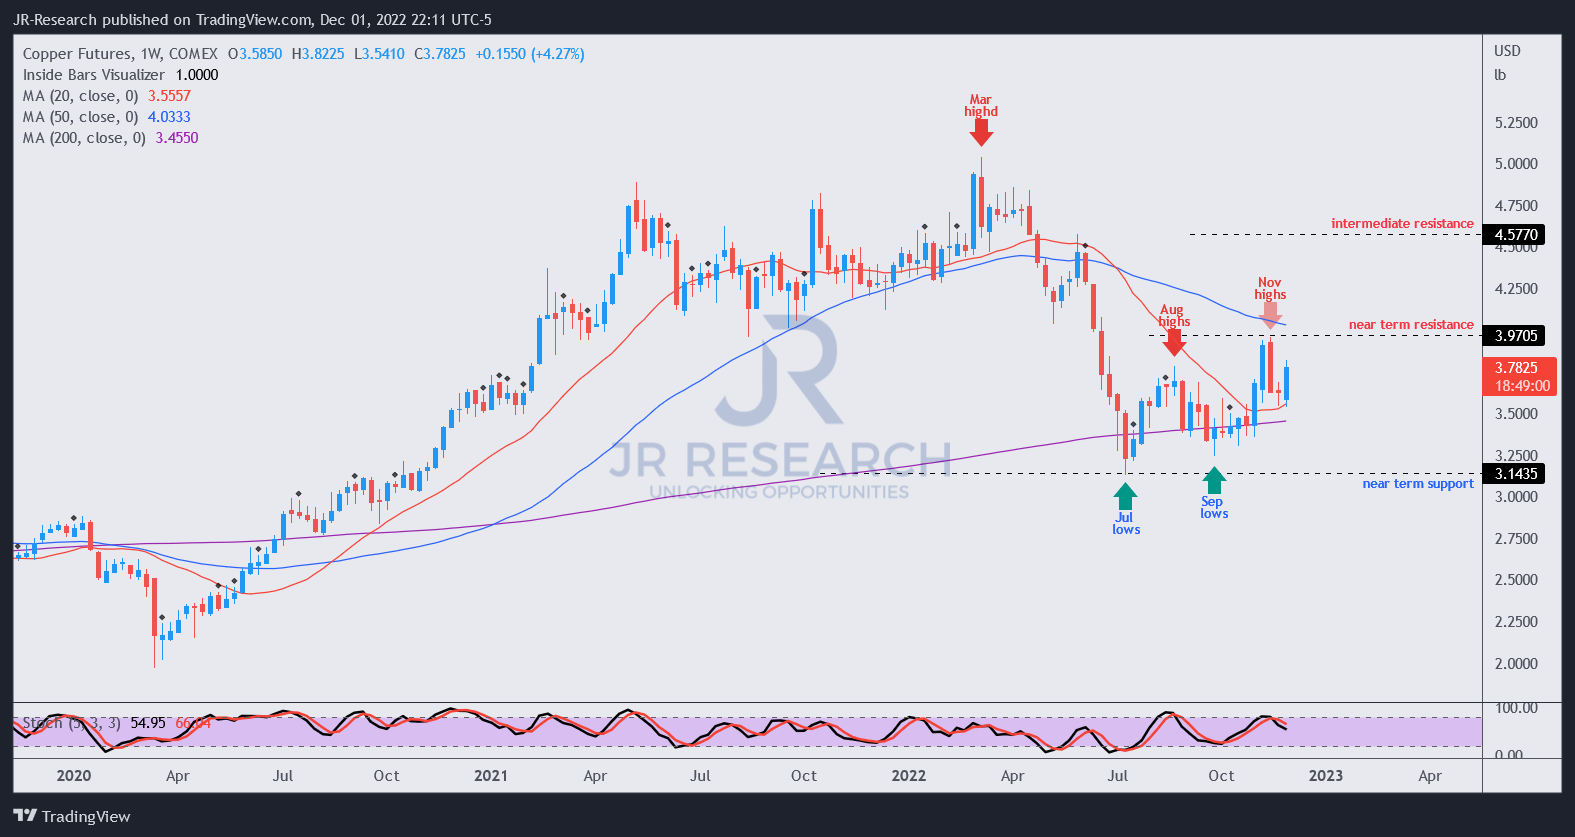
However, price action investors should be able to glean that the battering in HG1 has likely reflected significant macro risks, as it fell nearly 40% from its March highs to its July lows.
Furthermore, it sent HG1 straight to its long-term 200-week moving average (purple line) support level, which has undergirded HG1’s consolidation since July.
As such, we believe long-term buyers returned to bolster copper futures’ price action, seeing attractive levels after a steep selloff from March, despite Wall Street’s pessimism. The market is forward-looking.
FCX Operating CF (S&P Cap IQ)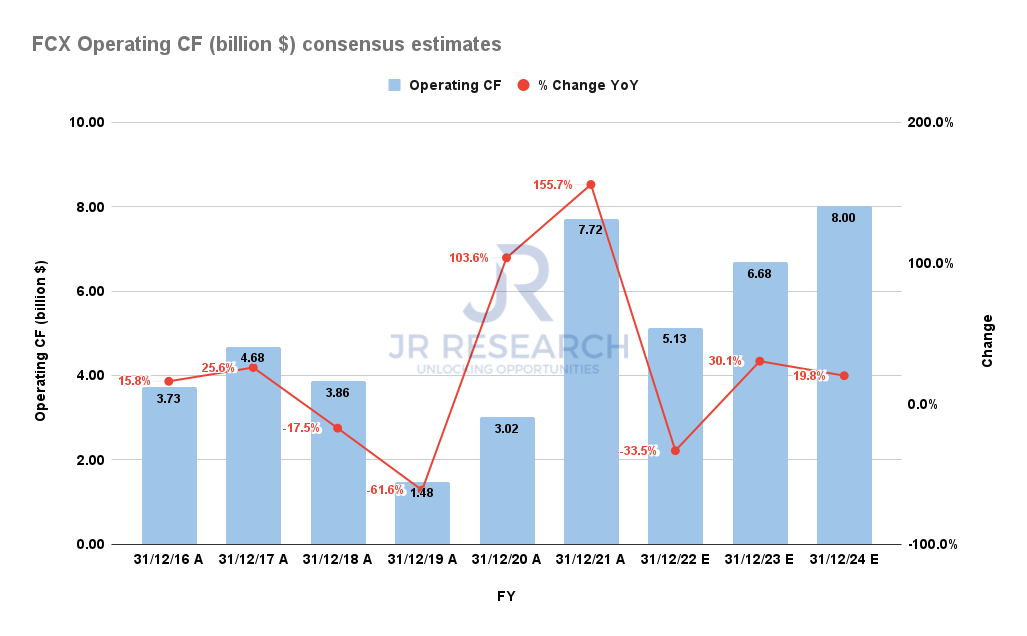
Even the downgraded forward estimates suggest Freeport-McMoRan should return to operating cash flow growth through FY24. It’s critical to note that FCX has significant operating leverage potential linked to the recovery of underlying copper futures.
FCX copper price sensitivity analysis (Company filings, author estimates)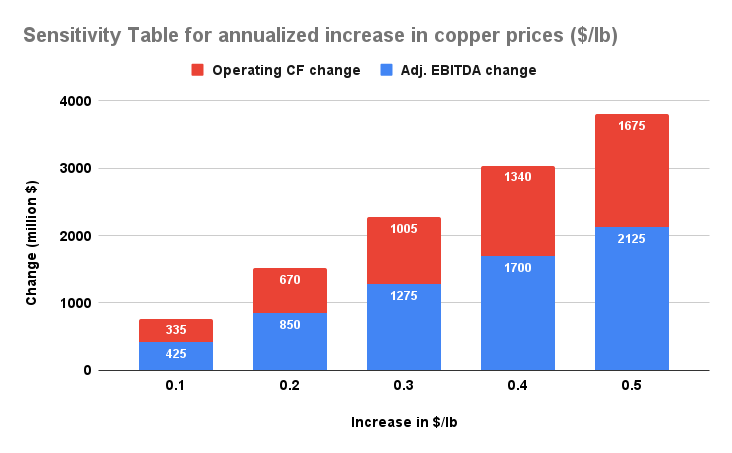
Based on our analysis of the company’s copper price sensitivity assumptions, a $0.50 per pound increase in copper prices could lead to a $1.68B increase in operating cash flow and a $2.13B uptick in adjusted EBITDA.
With copper futures having recovered nearly $0.65 from their July lows, we believe that FCX’s FY23 operating cash flow projections have likely been reflected in FCX’s price action. As such, a further recovery toward its August estimates would likely require a more sustained uplift from the underlying market.
Is FCX Stock A Buy, Sell, Or Hold?
FCX price chart (weekly) (TradingView)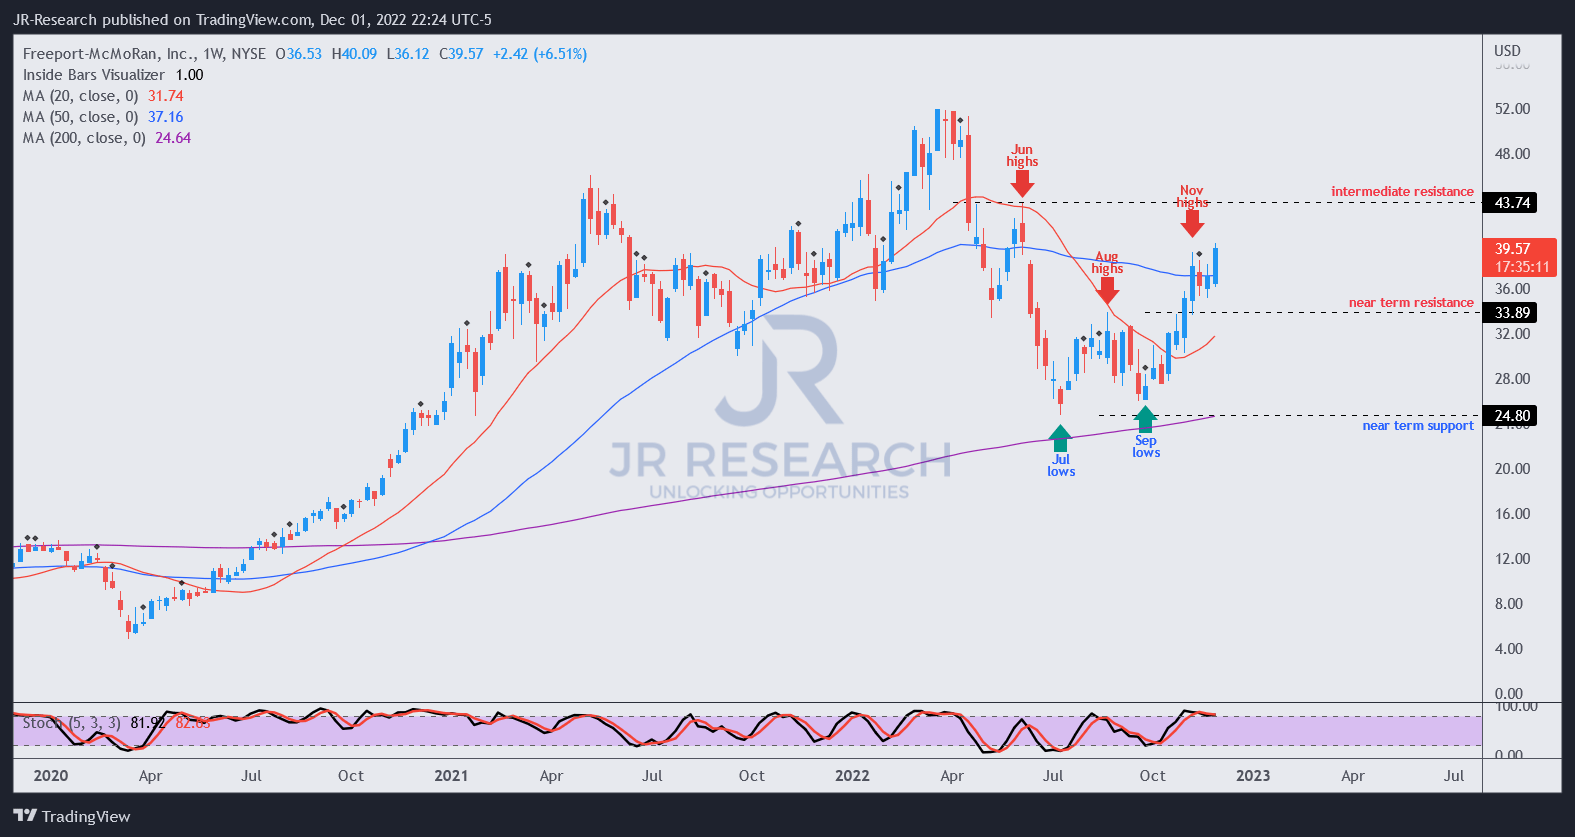
Given the sharp recovery toward its June highs, we believe some caution is warranted for buyers looking to add more exposure.
We expect FCX to face some near-term selling pressure at the current levels, with June highs likely another area of potentially significant resistance.
As such, we encourage investors to bide their time and not rush in to join the recent buyers in the surge.
Revising from Buy to Hold for now.
Be the first to comment