

assistantua/iStock via Getty Images
Part I – Introduction
Fortuna Silver Mines (NYSE:FSM) released its fourth-quarter and full-year 2021 results on March 24, 2022.
Note: This new article is an update of my article published on January 25, 2022. This preceding article analyzed the preliminary gold and silver production for the fourth quarter and full-year 2021.
In this new article, I cover the fourth quarter and full-year 2021 results, including the balance sheet and gold production.
1 – Fourth-quarter and full-year 2021 Highlights. Commentary.
FSM: 4Q21 Highlight Presentation (Fortuna Silver Mines)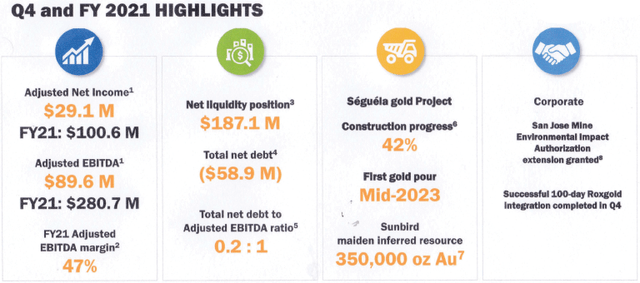
Reminder: On Jul 2, 2021, Fortuna Silver Mines acquired all of the issued and outstanding common shares of Roxgold Inc. The company acquired the high-grade Yaramoko Mine and the Séguéla advanced exploration project in Ivory Coast (the company announced this quarter the start of construction of the mine).
The 4Q21 results were a time of recognition of some sort. We can call it a miss on earnings, but it is a futile technical language with no real meaning for a small producer like FSM. Earnings “expectations” lack basic logic, and I recommend you avoid placing any faith in that.
However, FSM is a mid-tier gold and silver miner with recurring issues that prevent the stock from recovering after a significant drop due to an approval impass at its San Jose mine, which is still going on after a favorable decision then quickly contested Mexican authorities claiming a preposterous typo. In the conference call:
On October 23rd, the Mexican authorities failed to renew our 12-year environmental impact assessment, a key operating permit. The renewal was finally granted in late December for the requested 12 years, only to be reduced in a subsequent communications in two years. The authority is claiming a typographical error, providing no support of any kind for the term reduction in any document. We are contesting this in court and federal judge has accepted our case and granted a preliminary injunction in our favor.
The fact is that free cash flow was $30.9 million in 4Q21, and it was decent, especially with an elevated CapEx. Moreover, 2022 guidance shows Gold equivalent production between 326K and 371K ounces; a projected increase of 7% to 21% over 2021.
On a personal note, Fortuna Silver Mining should change its business name to Fortuna Gold Mining because its primary metal is gold, not silver. It may play a role in the market perception.
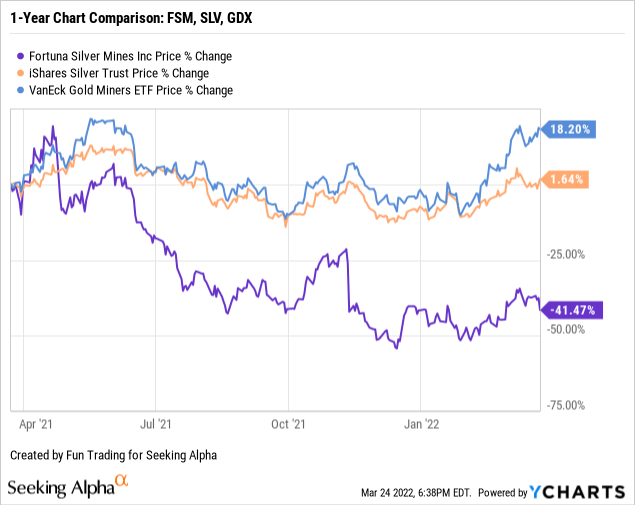
Thus, the focus should be on the gold price, not the silver price, which has tended to underperform since July last year.
Chart comparison Gold versus Silver 1 year (Fun Trading through Stockcharts)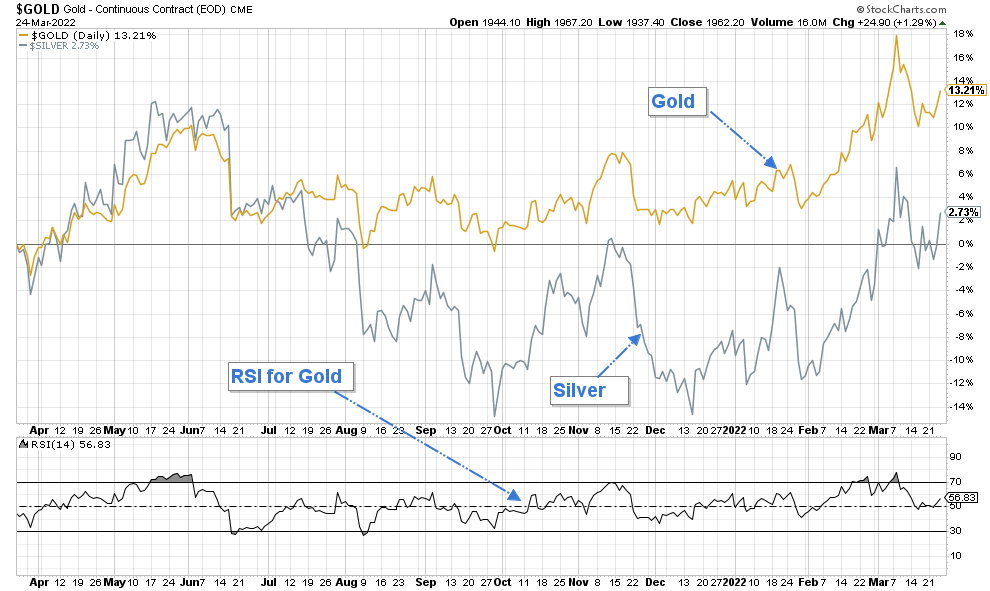
As you all know, Gold represents 69% of the total sales versus 22% for silver.
FSM: Performance per metal Presentation (Fortuna Silver Mines)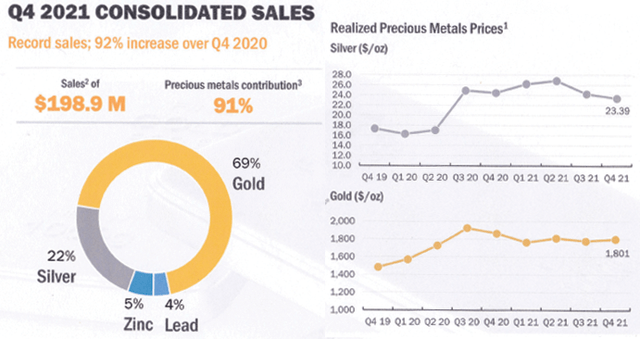
Fortuna Silver Mines posted adjusted earnings of $29.1 million and adjusted EBITDA of $89.6 million in 4Q21 compared to $44.8 million reported in 4Q20.
In 2021, Silver and gold production of 7,498,701 ounces and 207,192 ounces, respectively, compared to 7,133,717 ounces and 55,349 ounces in 2020. For the full-year 2021, the Company produced 305,859 gold equivalent ounces GEOs.
The Lindero Mine had a record quarterly gold production of 36,072 ounces of gold in Argentina, 37% over the previous quarter.
The AISC per ounce of gold sold was $1,116 and $1,317 for the Lindero and Yaramoko mines. More details will follow.
CEO Jorge Alberto Ganoza said in the conference call:
The drivers of the significant growth in financial figures compared to a year ago are the Lindero Mine, which in the quarter delivered record gold production of 36,000 ounces and the contribution of the Yaramoko Mine.
At the end of the year, our liquidity position remains strong at $187 million, while keeping our debt to EBITDA ratio at a low 0.2. The Company remains well-funded to meet all its capital projects for the year.
2 – Stock Performance: A grim chart.
Fortuna Silver Mines has underperformed the group with a loss of 42% on a one-year basis. Most of the recent loss is due to the San Jose mine issues.
3 – The Investment Thesis
The investment thesis for Fortuna Silver is quite tricky in light of the results indicated above. I was expecting a more solid recovery after news of solving the San Jose issue, but despite some confirmed support, the stock has merely recovered a fraction of what it lost. I can understand the disappointment of some long-term shareholders.
It confirms what I said in my preceding article. I believe it is reasonable to use this uncertainty to accumulate the stock, which is now trading at a discount to apparent fair value. However, it is only a gamble at this stage, and you should not invest a significant amount.
Furthermore, it is crucial to trade short-term LIFO about 45% to 55% of your long-term FSM position to profit fully from this increasing gold and silver volatility.
Fortuna Silver Mines: Financials and Production in 4Q 2021. The Raw Numbers
| FSM | 4Q20 | 1Q21 | 2Q21 | 3Q21 | 4Q21 |
| Total Revenues in $ Million | 103.5 | 117.8 | 120.5 | 162.6 | 198.9 |
| Net Income in $ Million | 18.6 | 26.4 | 16.2 | -0.5 | 16.6 |
| EBITDA $ Million | 42.7 | 61.8 | 52.2 | 51.0 | 77.3* |
| EPS diluted in $/share | 0.10 | 0.14 | 0.08 | 0.00 | 0.05 |
| Cash from operating activities in $ Million | 56.5 | 21.1 | 29.6 | 39.4 | 57.1 |
| Capital Expenditure in $ Million | 44.2 | 16.7 | 19.7 | 53.0 | 26.2 |
| Free Cash Flow in $ Million | 12.4 | 4.4 | 9.9 | -13.6 | 30.9 |
| Total cash $ Million | 133.0 | 146.5 | 122.8 | 136.3 | 107.1 |
| Total debt in $ Million | 166 | 166 | 166 | 193.8 | 166 |
| Shares outstanding (diluted) in Million | 195.3 | 195.2 | 196.1 | 289.1 | 295.9 |
| Silver and Gold Production | 4Q20 | 1Q21 | 2Q21 | 3Q21 | 4Q21 |
| Silver Production in M Oz | 1,912,737 | 1,913,755 | 1,892,822 | 1,711,881 | 1,980,243 |
| Gold production in K Oz | 25,357 | 34,555 | 31,048 | 65,425 | 76,162 |
| Gold price realized $/Oz | 1,864 | 1,764 | 1,812 | 1,779 | 1,801 |
| Silver price realized $/Oz | 24.43 | 26.19 | 26.85 | 24.25 | 23.39 |
| Zinc M Lbs | 12,434 | 11,969 | 11,764 | 12,436 | 11,380 |
| Lead M lbs | 8,426 | 8,181 | 8,144 | 8,245 | 8,419 |
Source: Company material
Part 1 – Gold and Silver Production Details
1 – All-In Sustaining Costs or AISC
The AISC per ounce of gold sold in 4Q21 was $994 for the Lindero Mine and $1,436 for the Yaramoko Mine.
The AISC per silver equivalent ounce of payable silver sold in 4Q21 was $14.9 and $20.7 for the San Jose Mine and Caylloma Mine, respectively.
2 – Presentation of Fortuna Gold and Silver Production in Three Charts
2.1 – Gold and silver production history
FSM: Quarterly Gold and Silver Production history (Fun Trading)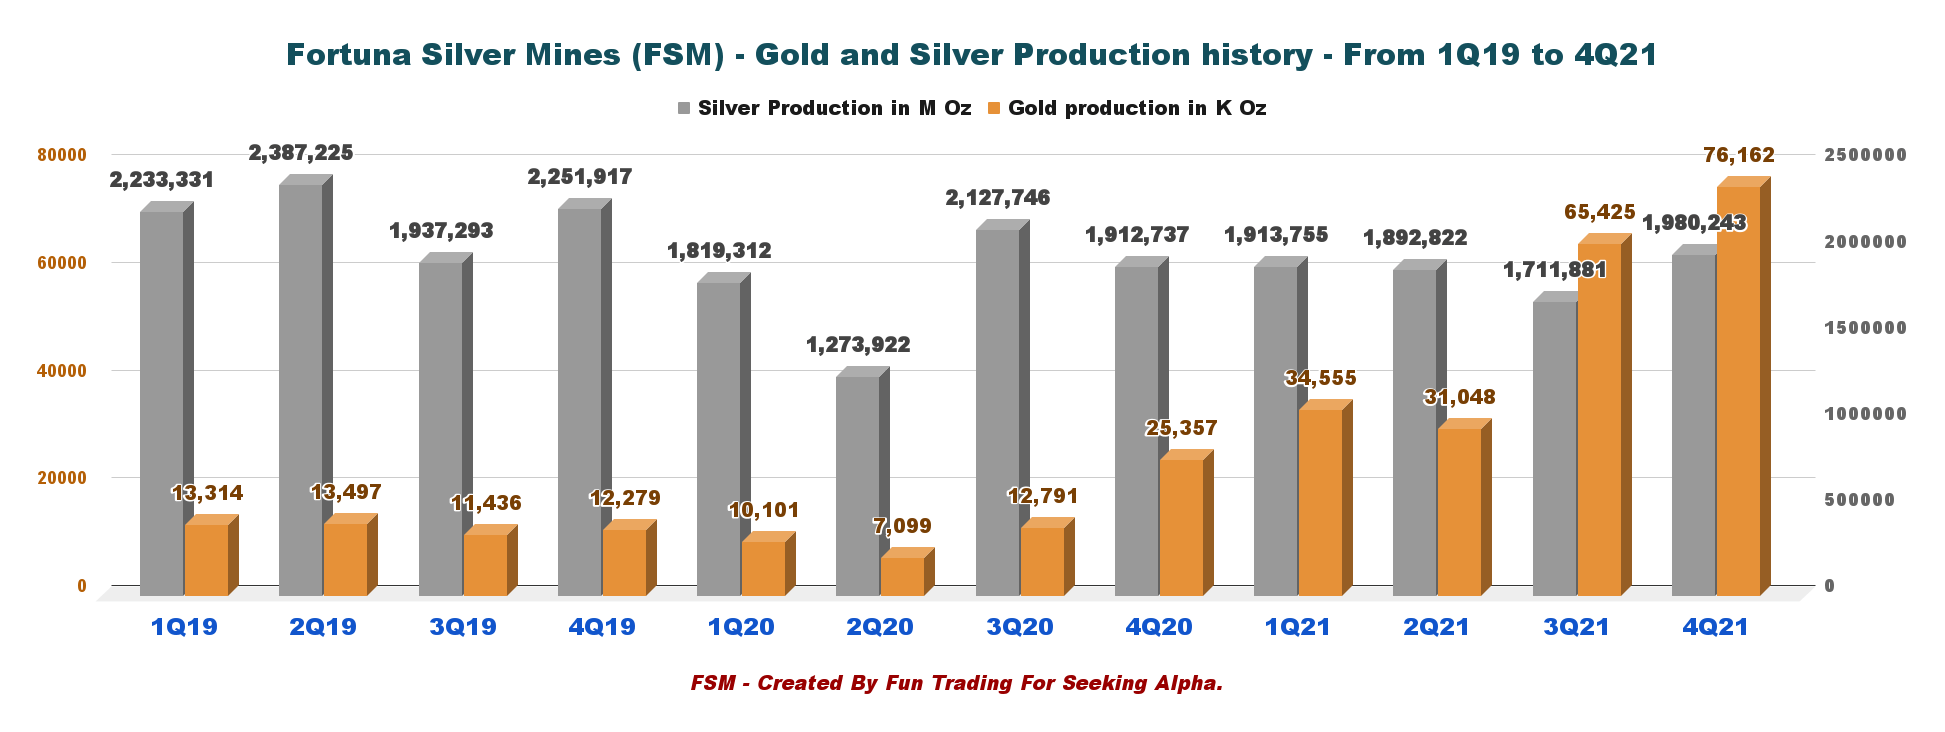
For the full-year 2021, the company produced 207,192 ounces of gold and 7,498,701 ounces of silver or 305,859 gold equivalent ounces GEOs.
Note: To calculate GEOs, the company uses a ratio of silver to gold of 76:1.
- Gold production of 207,192 ounces or 274% increase over 2020
- Silver production of 7,498,701 ounces or 5% increase over 2020
- Lead production of 32,989,973 pounds or 11% increase over 2020
- Zinc production of 47,549,301 pounds or 4% increase over 2020
For 4Q21, Fortuna Silver Mining produced 1,980,243 ounces of silver and 76,162 ounces of gold. As you can see in the graph above, gold production jumped to a historical high.
2.2 – Gold and silver prices history
FSM: Quarterly Gold and Silver prices history (Fun Trading)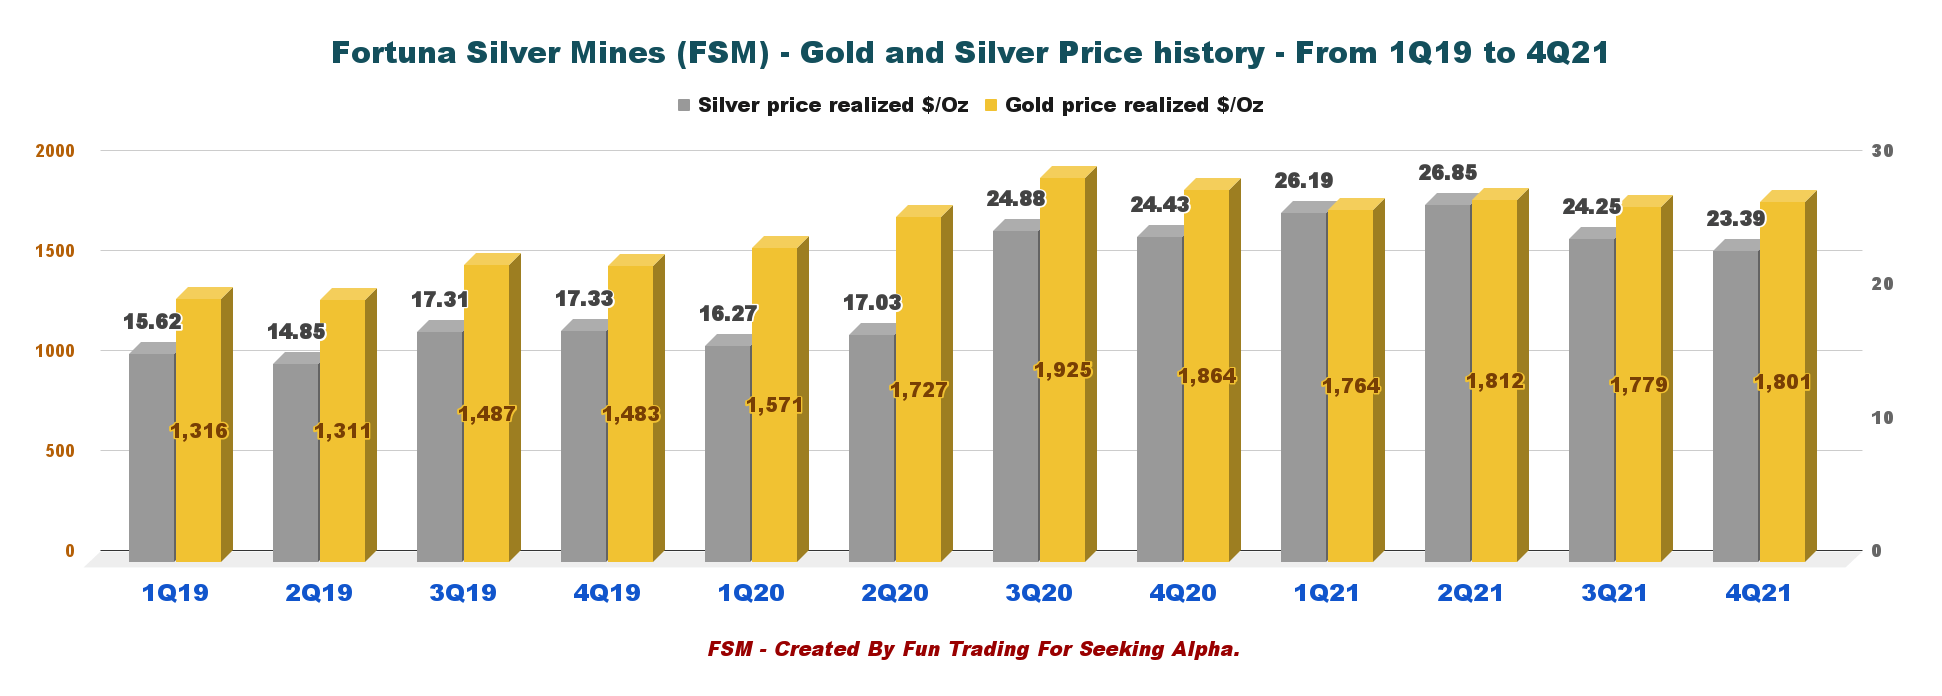
2.3 – Zinc and Lead production history (Caylloma Mine)
FSM: Quarterly Zinc and Lead production history (Fun Trading)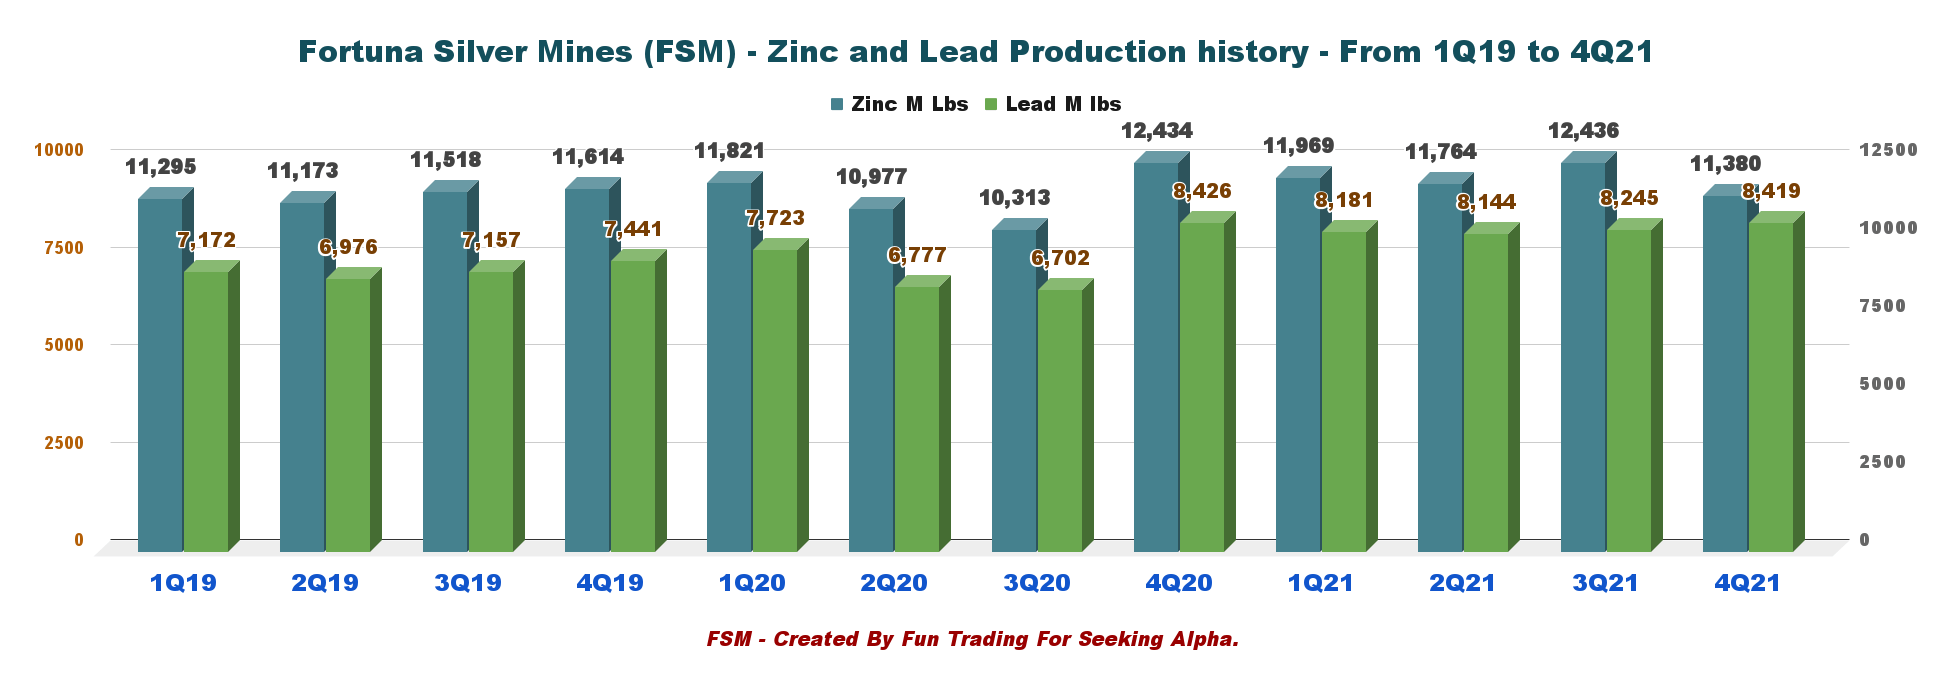
2.4 – Details per mine and metal produced.
| Production per mine | GOLD Oz | SILVER Oz | LEAD K Lbs |
ZINC K Lbs |
| Lindero Mine, Argentina | 36,072 | 0 | 0 | 0 |
| Yaramoko Complex, Burkina Faso | 28,787 | 0 | 0 | 0 |
| San Jose Mine, Mexico | 9,929 | 1,717,533 | 0 | 0 |
| Caylloma Mine, Peru | 1,374 | 262,710 | 8,419 | 11,380 |
| Total | 76,162 | 1,980,243 | 8,419 | 11,380 |
From Fun Trading file.
Note: Reserves P1 P2 represent 3,617K Au Oz and 28.8M Ag Oz, including Séguéla mine.
2.4 – Update on the Séguéla Gold project in Côte d’Ivoire, West Africa.
FSM: Seguala Presentation (Fortuna Silver Mines) The Séguéla Project is 42% complete with critical path items on the schedule, targeting the first gold pour in mid-2023 with ramp-up to nameplate capacity in the third quarter of 2023. CEO Jorge Alberto Ganoza said in the conference call: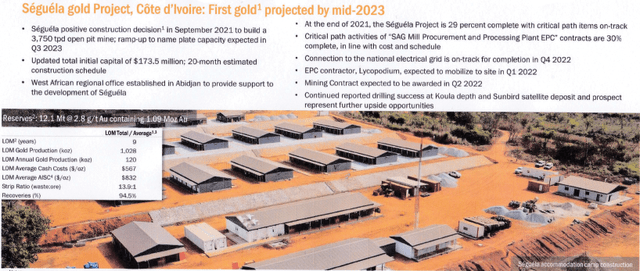
the Séguéla Mine construction, which, once completed, will be Fortuna’s fifth operating mine. As of the end of February, the Séguéla construction is 42% complete, tracking align with our budget and timeline for first gold in mid-2023. The team is delivering an excellent performance at the project. We’re preparing to initiate placing concrete in mid to late April.
3 – Guidance for 2022
Fortuna Silver forecasts consolidated silver production in the range of 6.2 million ounces to 6.9 Moz, and gold production between 244K ounces and 280K ounces in 2022.
FSM: Guidance 2022 Presentation (Fortuna Silver Mines)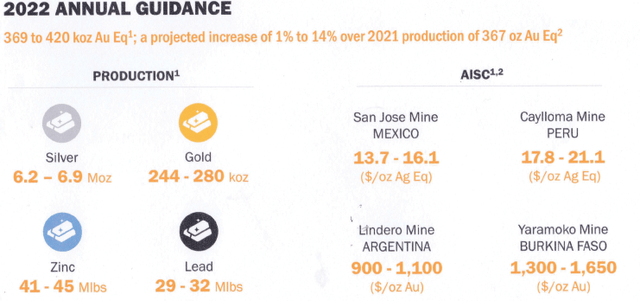
Gold production of between 244K to 280K ounces; a projected increase of between 16% and 35% over 2021.
Silver production of between 6.2Moz to 6.9Moz; a projected decrease of between 8% and 17% over 2021.
Gold equivalent production of between 326K and 371K ounces; a projected increase of 7% to 21% over 2021.
Part 2 – Balance Sheet and Commentary
1 – Fortuna Silver Mines Revenues were $198.9 million in 4Q21
FSM: Quarterly Revenue history (Fun Trading)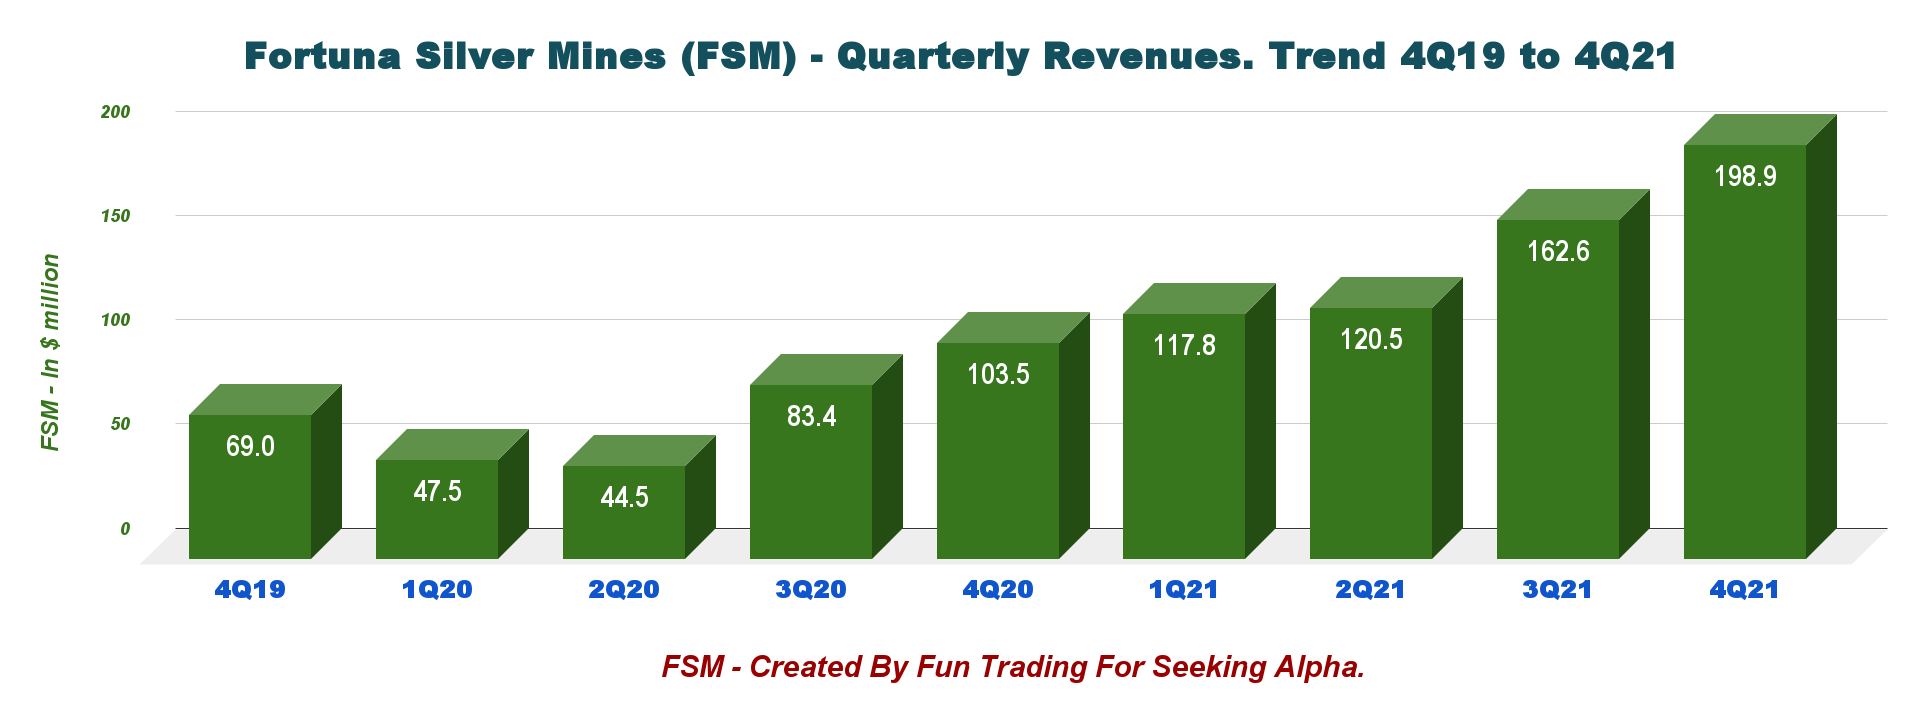
Fortuna Silver’s revenues increased significantly to $198.9 million in 4Q21, up 92.2% yearly.
2 – Fortuna Silver reported a 4Q21 Free Cash estimated at $30.9 million
FSM: Quarterly Free cash flow history (Fun Trading)
Note: The generic free cash flow is the cash flow from operations minus CapEx. The calculation is different from the company. Fortuna Silver indicated gain from the ongoing operations of $33.8 million using another measure, including Roxgold transaction cost and tax paid.
FSM’s trailing 12-month free cash flow was $31.54 million, with $30.9 million in 4Q21.
3 – Fortuna’s total debt was $166 million at the end of December.
FSM: Quarterly Cash versus Total debt history (Fun Trading)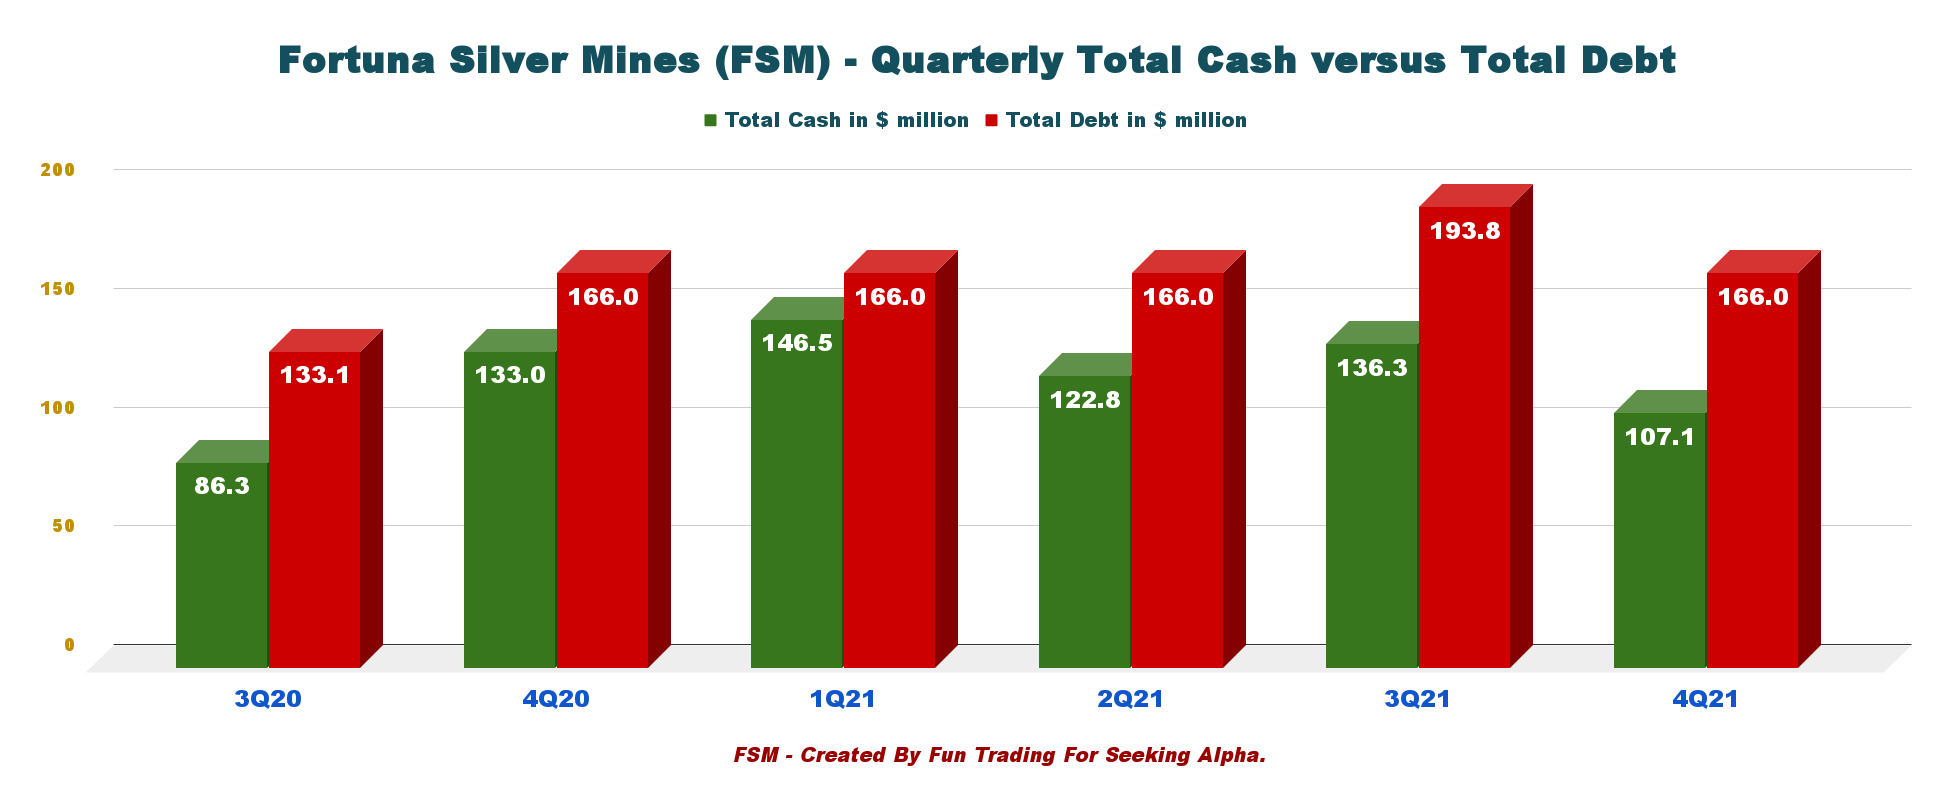
As of December 31, 2021, the Company had cash and cash equivalents of $107.10 million and total debt of $166 million.
FSM: Debt liquidity Presentation (Fortuna Silver Mines)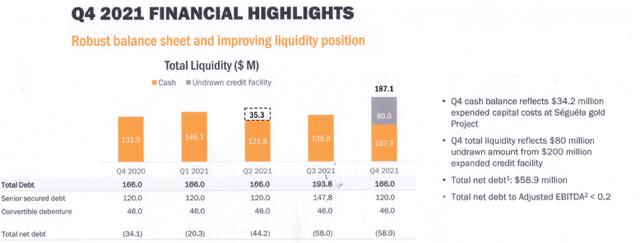
Part 3 – Technical Analysis (Short-Term) and Commentary
FSM: TA Chart (Fun Trading)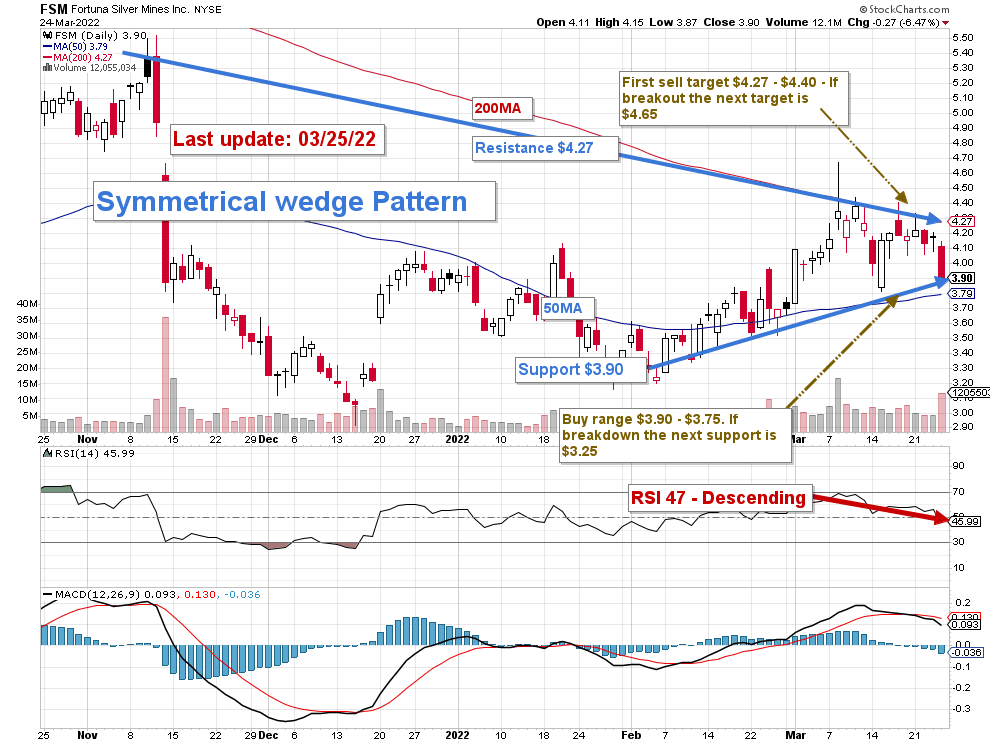
FSM forms a symmetrical wedge pattern with resistance at $4.27 and support at $3.90.
The short-term trading strategy is to trade LIFO about 45-55% of your position and keep a core long-term amount for a much higher payday. I suggest selling between $4.27 and $4.40 and waiting for a retracement between $3.90-$3.75 if possible.
FSM could experience a breakdown if the gold/silver prices lose momentum and retest the lower support at $3.30.
Conversely, if the gold/silver prices continue to be bullish due to a frightening jump in inflation and a continued slow response from the Fed, FSM could break out and reach $4.50 and on its way to $5.50.
The issue for gold and silver is what the FED will do about that? Gold is going up and reached $1,965 per ounce today. However, if the FED starts to tighten and hike interest more vigorously in 2022, I believe the gold price may drop back to the low $ 1800s.
Another element is the Russian invasion of Ukraine, which adds more interest in gold. Recently the USA has been increasing restrictions to the Russian gold stockpile, which represents about $140 billion that cannot be used. Another gold boost.
Watch the gold and silver prices like a hawk.
Warning: The TA chart must be updated frequently to be relevant. It is what I am doing in my stock tracker. The chart above has a possible validity of about a week. Remember, the TA chart is a tool only to help you adopt the right strategy. It is not a way to foresee the future. No one and nothing can.
Author’s note: If you find value in this article and would like to encourage such continued efforts, please click the “Like” button below as a vote of support. Thanks!
Be the first to comment