

Vertigo3d
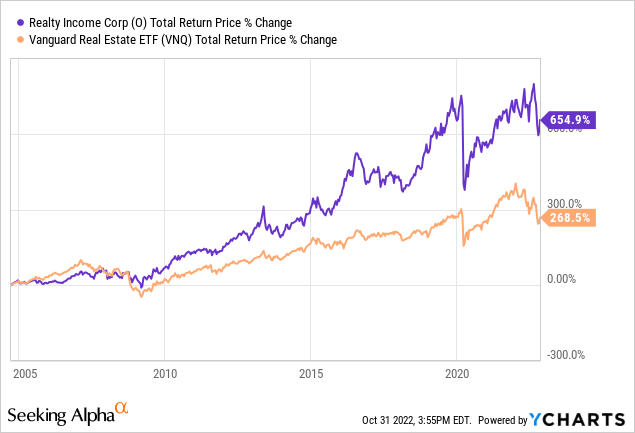
Realty Income Corporation (NYSE:O) is a highly regarded dividend growth machine that has posted incredible total returns and dividend growth consistency (27 years of consecutive annual dividend growth) for shareholders over the years:
Meanwhile, Spirit Realty Capital, Inc. (NYSE:SRC) is a younger and smaller triple net lease real estate investment trust (“REIT”) that employs a similar business model as O’s. While its track record pales in comparison to O’s, it has much greater room to grow and trades at a significantly cheaper valuation while still enjoying a low risk profile.
In this article, we compare these two REITs side by side to show why we think SRC is a better buy than O right now.
Realty Income Vs. Spirit Realty Capital – Balance Sheet
O wins this category simply by virtue of its A- (stable outlook) credit rating compared to SRC’s BBB (stable outlook) from S&P. On top of that, O has a 7.6 year weighted average notes and bonds term to maturity with 93% of its debt locked in at fixed interest rates. That said, based on some other metrics, SRC looks quite well positioned as well, with a greater percentage of unsecured debt relative to total debt, a similar overall weighted average debt term to maturity, similar Adjusted Debt/Adjusted EBITAre ratios, a superior fixed charge coverage ratio, and a similar weighted average interest rate to O.
As a result, while we still give the clear edge to O in this category, we can conclude that SRC’s balance sheet is quite strong as well.
Realty Income Vs. Spirit Realty Capital – Investment Portfolio
O also wins in this category simply by virtue of its unmatched scale. It owns over 11,400 properties spread across 1,125 different tenants and 72 different industries. Additionally, 43% of its rental revenue comes from investment grade tenants, giving it a pretty strong tenant base.
That said, SRC still has a very well-diversified portfolio with over 2,000 properties under its ownership. In addition, despite having a smaller portfolio, it has less concentration than O has in their respective top 10 and 20 tenants, it has more industrial exposure and less retail exposure than O does, and also has a higher occupancy rate and weighted average lease term. It also has greater forward same store sales growth and has more exposure to high growth pro-business states like Texas and Florida and has less exposure to lower growth and anti-business states like California and Illinois relative to O.
While O does have considerably more investment grade exposure and a portfolio that is over five times larger than SRC’s, there comes a point where additional diversification has minimal impact on performance. This is illustrated by the fact that SRC posted strong numbers during the height of the COVID-19 lockdowns as it lost only 0.06% of its rent during that period and its occupancy remained above 99%.
Realty Income Vs. Spirit Realty Capital – Dividend Outlook
Both REITs’ dividends appear to be quite safe for the foreseeable future. SRC’s AFFO (adjusted funds from operations) dividend payout ratio for 2022 is expected to be 72.5%, and O’s is expected to be 76.4%. One area where O shines relative to SRC is that its dividend per share CAGR through 2026 is expected to be 5.6% whereas SRC’s is expected to be just 0.7%, according to consensus analyst estimates. That said, SRC recently hiked its quarterly dividend by 3.9%, so this – combined with its lower payout ratio than O’s – implies that it will likely significantly outgrow the current analyst consensus estimate growth forecast. Still, we give the edge to O here as its lower cost of capital should enable it to continue outgrowing SRC moving forward.
Realty Income Vs. Spirit Realty Capital – Track Record
As we stated previously, O has a much longer and vastly superior track record to SRC’s as its management team and business model have been proven through numerous business cycles, including expansions and severe downturns.
That said, since SRC went public, its stock has only slightly underperformed O’s and it only became a pure play triple net lease a few years ago.
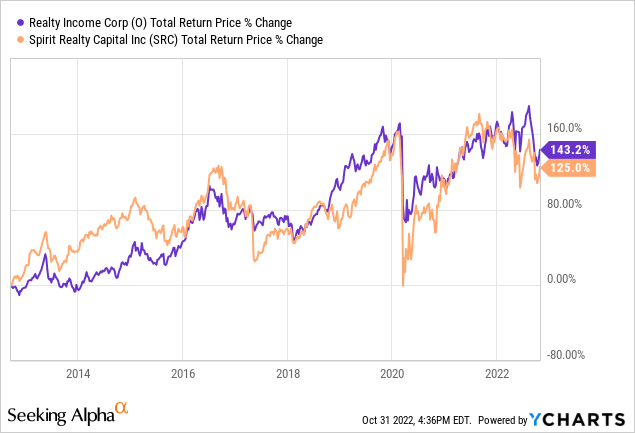
As a result, it is a bit premature to judge SRC’s management and business model as inferior, though O’s long-term track record will certainly be difficult to match.
Realty Income Vs. Spirit Realty Capital – Stock Valuation
Here is a side-by-side comparison of SRC and O on several valuation metrics:
| Valuation Metric | SRC | O |
| P/AFFO | 10.71x | 15.78x |
| P/AFFO (5 Year Average) | 12.69x | 18.58x |
| Dividend Yield | 6.9% | 4.8% |
| Dividend Yield (3 Year Average) | 6.6% | 4.4% |
| P/NAV | 0.86x | 1.11x |
| P/NAV (3 Year Average) | 0.98x | 1.24x |
As is quite evident from the comparison, SRC is significantly cheaper according to every major valuation metric. Its P/AFFO multiple indicates it has nearly 50% upside if it were to be priced at the same level as O, while its P/NAV also indicates that it is clearly undervalued.
It is also important to note that while O has a slightly stronger growth profile, this is largely due to the fact that its shares still trade at a meaningful premium to NAV. Management is able to issue shares at prices above what they can reinvest that equity at in the private market. In contrast, SRC’s shares trade at a deep discount to NAV, so management cannot issue shares on an accretive basis.
However, SRC also offers investors a 210 basis point higher dividend yield, which compensates for its slightly weaker growth outlook. Meanwhile, they also benefit from superior multiple expansion potential relative to O. On top of that, interest rates have been rising faster than cap rates in the triple net lease space. As a result, growth rates will likely be tempered moving forward in the sector as the cost of capital increases relative to the potential returns on invested capital. This will hurt the growthier REITs more, so O will be hurt more than SRC by this trend.
Investor Takeaway
Overall, this is a very close matchup and ultimately comes down to whether an investor prefers track record or current valuation. SRC is hands-down much cheaper than O, while its balance sheet and portfolio are only slightly inferior. As a result, based on a price-to-fundamentals analysis, SRC would appear to be the clear buy here. However, O does have a long and storied history of successfully creating value for shareholders, so it is understandable why investors – especially retirees with a low risk tolerance – would prefer them as their triple net lease REIT.
We prefer SRC, as we believe management has done a solid job of transitioning the REIT to becoming the pureplay triple net lease REIT that it is today. We find the valuation to be very compelling at the moment. In contrast, O looks fairly valued to us. While the management and track record there are obviously impressive, it is such a simple and defensive business model that we think it will be hard for them to generate much more than high single-digit total returns for shareholders for the foreseeable future.
Be the first to comment