

syahrir maulana/iStock via Getty Images
Investment Thesis
The Schwab Fundamental U.S. Large Company Index ETF (NYSEARCA:FNDX) may be a $10 billion fund, but surprisingly, it receives very little coverage on Seeking Alpha. With this article, I hope to change that, as FNDX looks attractive as a Russell 1000 alternative. I think investors will appreciate its 18.46x forward P/E ratio, its strong earnings growth rate, and its overweighting of Energy and Financials. I’m happy to walk you through how this ETF works and hope you’ll consider putting it on your watchlist.
ETF Overview
Strategy and Fund Basics
FNDX tracks the Russell RAFI US Large Company Index. According to the Index Fact Sheet:
The Russell RAFI Index Series methodology selects and weights securities using the average of three fundamental measures of company size including adjusted sales, retained operating cash flow and dividends plus buybacks.
The methodology document provides more color on these three factors:
1. Adjusted sales: average five-year sales adjusting for financial leverage, effectively decreasing the weight of companies with significant leverage. This feature should benefit the Index in a rising rate environment.
2. Retained operating cash flow is the average operating cash flow less dividends and buybacks over the last five years. While I prefer free cash over operating cash, this adjustment makes sense because shareholders expect dividend payments to continue. Excess cash can be used for debt repayments and to grow the business.
3. Dividends and buybacks are considered because buybacks now make up a substantial portion of shareholder distributions. In my article on the Cambria Shareholder Yield ETF (SYLD), I pointed this out. Currently, buybacks exceed dividends for S&P 500 securities.
Cambria Shareholder Yield Investment Case
Below are some additional fund statistics for easy reference:
- Current Price: $57.87
- Assets Under Management: $10.04 billion
- Expense Ratio: 0.25%
- Launch Date: August 15, 2013
- Trailing Dividend Rate: $0.9921
- Trailing Dividend Yield: 1.70%
- Five-Year Dividend CAGR: 8.72%
- Dividend Payout Frequency: Quarterly
- Five-Year Beta: 1.08
- Number of Securities: 731
- Assets in Top Ten: 19.93%
- 30-Day Median Bid-Ask Spread: 0.04%
- Tracked Index: Russell RAFI US Large Company Index
- Benchmark Index: Russell 1000 Index
FNDX isn’t very concentrated, with just 20% of assets in its top ten. Its 0.25% expense ratio is a bit elevated, too. Consider that for the first five years of ownership, assuming an 8% return continuously compounded, 3.60% of your total gains are lost to fees. However, if held for 20 years, 5.77% is lost to fees compared to 0.70% for a low-cost S&P 500 ETF like IVV. For this reason, I generally favor the lowest-cost options, but I’m OK with paying up if short-term opportunities arise.
Sector Exposures and Top Ten Holdings
The table below reflects FNDX’s sector exposures. I’ve compared it with the exposures for the SPDR S&P 500 ETF Trust (SPY) and the iShares Russell 1000 ETF (IWB), against which FNDX benchmarks performance.
Morningstar
Most sectors have minor exposure differences. However, FNDX is overweight Energy by 6-7% compared to SPY and IWB. I believe this to be a great defensive setup, even though energy stocks are notoriously volatile. High oil prices almost always drive inflation, and I think around 10-15% is an appropriate allocation at this time. FNDX is also overweight the Financials by about 5%, and I think the odds favor this sector outperforming as interest rates rise. Still, risks exist if rates rise too quickly.
FNDX underweights the Technology sector by about 11%. It doesn’t exclude stocks like Apple (AAPL), Microsoft (MSFT), and Google (GOOGL, GOOG); it just has less exposure to them. These three stocks total 15.43% in IWB but just 7.75% in FNDX. Underweighting them will likely be a source of underperformance in the long run, but this setup could limit losses this year as tech stocks fall out of favor.
I have listed the top ten holdings below. Also included are Exxon Mobil (XOM), Berkshire Hathaway (BRK.B), and UnitedHealth Group (UNH).
Charles Schwab Asset Management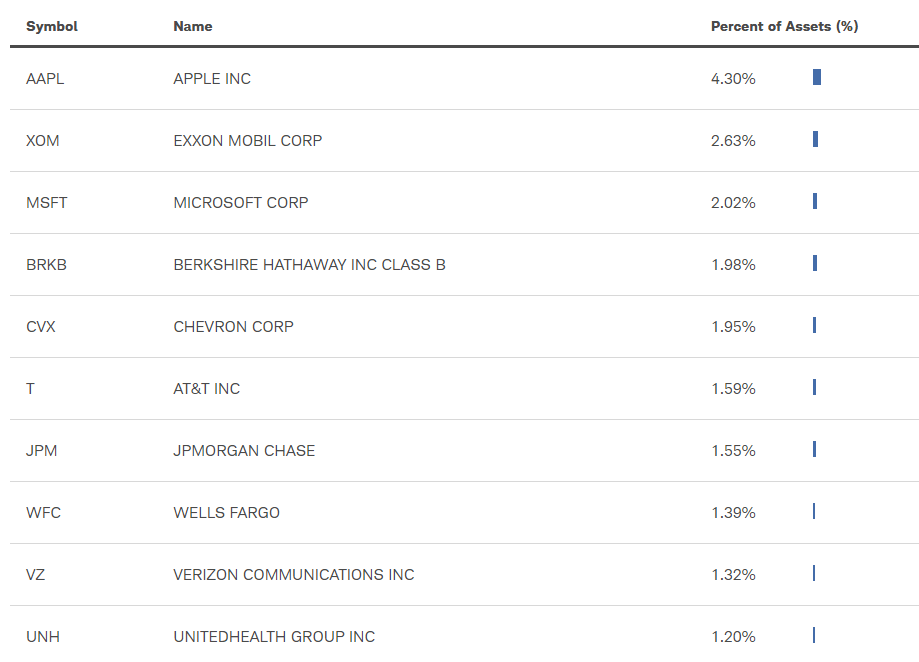
Historical Performance
FNDX has underperformed its benchmark (IWB) by an annualized 1.26% since its inception and also trailed SPY by an annualized 1.49%. Unfortunately, volatility was higher, too, so its risk-adjusted returns (Sharpe and Sortino Ratios) were worse.
Portfolio Visualizer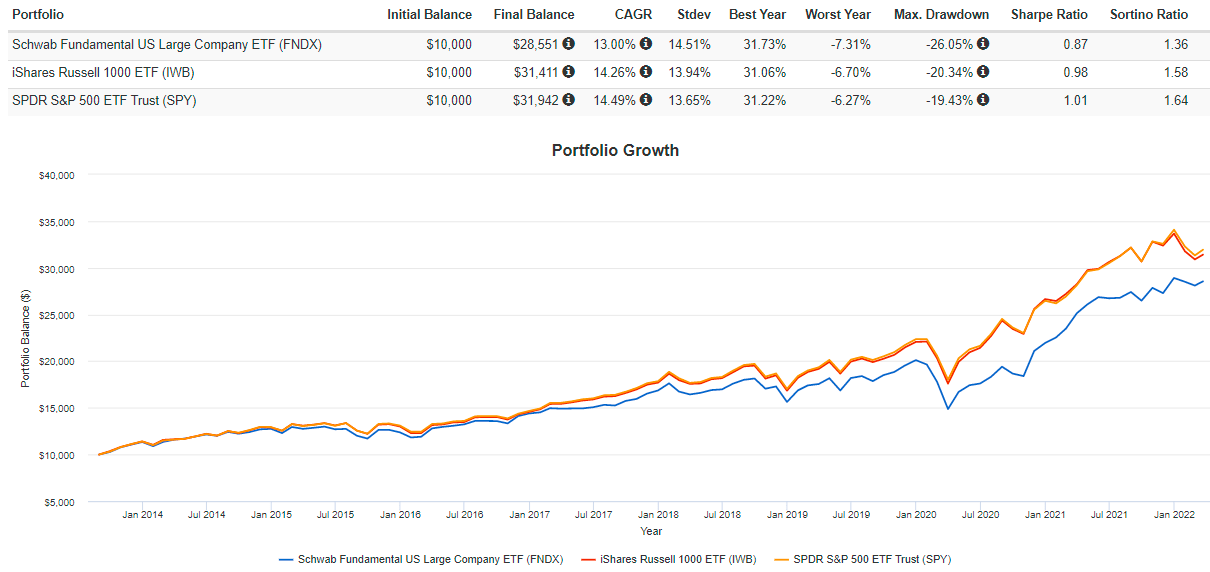
While the numbers don’t lie, I want to provide some additional context. Per the graph below, most underperformance came in 2020, when FNDX underperformed IWB and SPY by 11.63% and 9.23%, respectively.
Portfolio Visualizer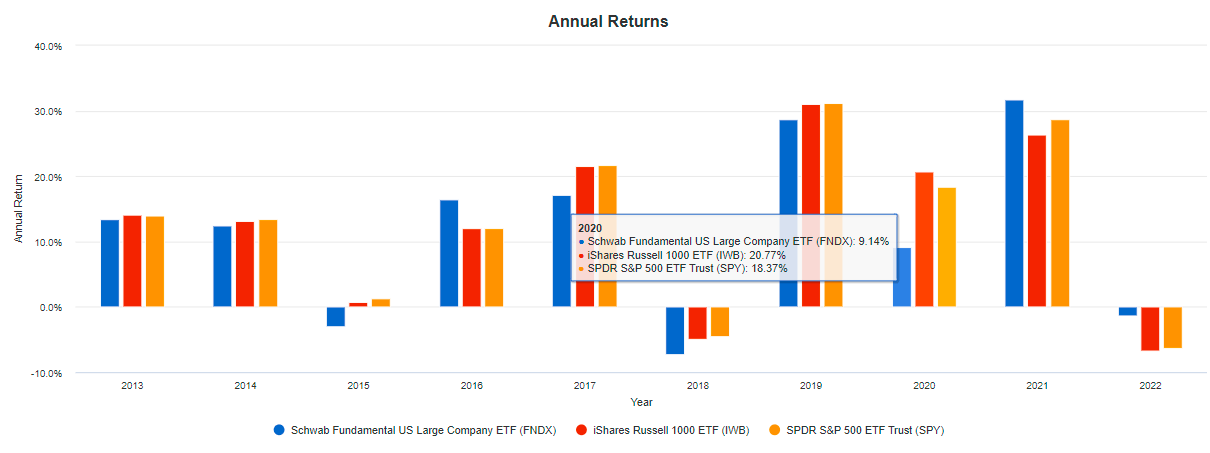
Market watchers surely know how little fundamentals mattered in 2020. Overhyped stocks and ETFs like the ARK Innovation ETF (ARKK) soared to inexplicable heights but have since fallen back down to earth. Cathie Wood was 2020’s stock picker of the year, but it’s beginning to look more like luck. Previously, I did a value-weighted analysis of profitable vs. unprofitable stocks over the last 30 years using the Ken French Data Library. It’s telling how in years like 1999, 2009, and 2020, unprofitable stocks gained 53.00%, 63.05%, and 79.31%, but always reversed significantly in subsequent years.
Author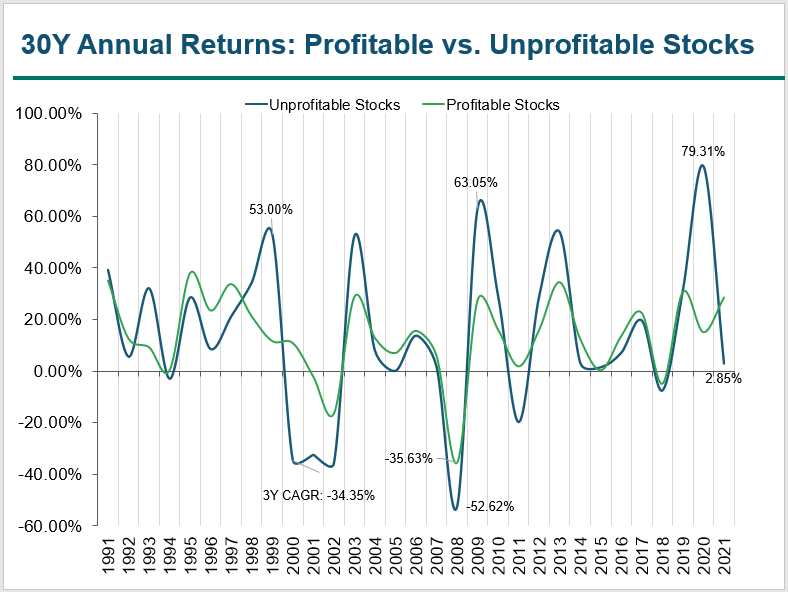
A similar, but not as extreme, truth exists for high P/E vs. low P/E stocks. This graph relates to FNDX because it will not have as much allocation to these names. Assuming this graph is a fair representation of risk-on sentiment, you’ll have to decide whether the blue line above (unprofitable stock returns) will continue trending downward and fully reverse like it did in 1999/2000-2002 and 2009/2010-2011, or if we’ll get another uptrend. I think a downtrend is more likely, so that’s why I’m more interested in fundamental ETFs like FNDX.
Fundamental Analysis
Since FNDX is not a concentrated ETF, I’ve summarized it by its top 20 industries instead, which total 51.36%. Interestingly, despite it having fewer holdings than the iShares Russell 1000 ETF, the concentration is 7.42% less. As mentioned earlier, the lower weightings assigned to mega-cap stocks are the cause. It’s also why the weighted-average market capitalization is $233 billion lower.
Author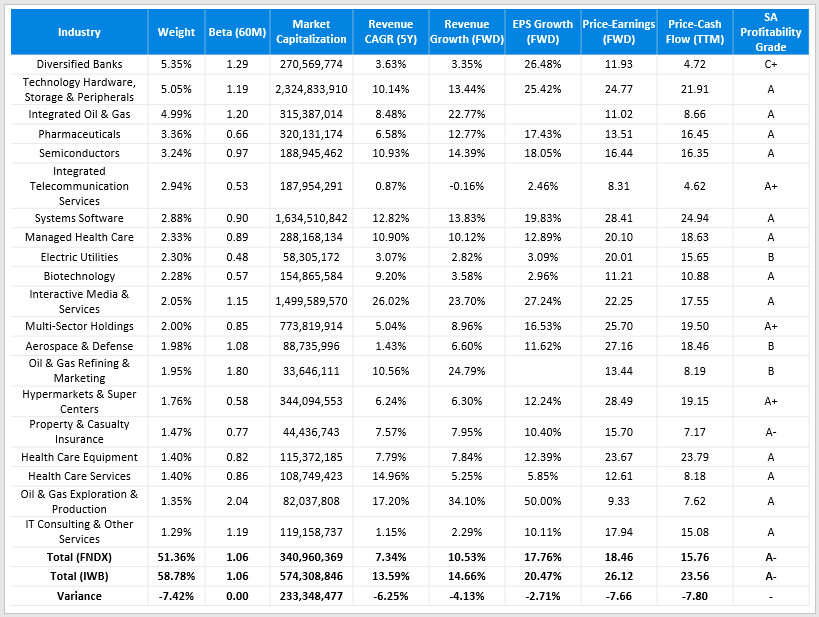
However, FNDX has many positive features. For instance, its forward price-earnings and trailing price-cash flow ratios are nearly eight points lower than IWB. Profitability isn’t impacted, as both ETFs have a weighted-average Profitability Grade of A- from Seeking Alpha.
For a discount like that, investors should expect a trade-off on growth. Indeed, FNDX has a 6.25% lower trailing five-year revenue growth rate than IWB. However, revenue growth estimates are increasing faster for FNDX’s constituents since the gap narrows to 4.13% for the following year. For earnings per share, it’s even smaller – only 2.71%. In my view, those trade-offs are minor. FNDX is the short-term opportunity I hinted at earlier as the trend toward favoring value stocks persists.
Key Differences vs. Russell 1000 Index
Some may just be looking for a list of key allocation changes FNDX made to the Russell 1000 Index. Here’s a list of the top ten positive increases:
- Exxon Mobil (XOM): 1.82%
- AT&T (T): 1.21%
- Chevron (CVX): 1.21%
- Wells Fargo (WFC): 0.86%
- Verizon Communications (VZ): 0.82%
- Citigroup (C): 0.70%
- Intel (INTC): 0.66%
- Walmart (WMT): 0.66%
- CVS Health (CVS): 0.55%
- JPMorgan Chase (JPM): 0.54%
And here is a list of the top ten negative changes:
- Microsoft (MSFT): 3.41%
- Amazon (AMZN): 2.70%
- Alphabet (GOOGL, GOOG): 2.35%
- Apple (AAPL): 2.06%
- Tesla (TSLA): 1.96%
- NVIDIA (NVDA): 1.31%
- Meta Platforms (FB): 0.64%
- Visa (V): 0.53%
- Mastercard (MA): 0.46%
- salesforce.com (CRM): 0.40%
Of course, no one will be happy with all these changes. Personally, Intel and AT&T are two stocks I wouldn’t overweight, but I’m pleased with the boosted exposure to stocks like Exxon Mobil, Chevron, and Walmart. On the other side of the coin, I think Microsoft, Alphabet, and Apple are terrific long-term investments, but I believe their growth rates will slow down and potentially lead to P/E compression.
Investment Recommendation
Try thinking in terms of probabilities when you’re trying to decide which broad-based ETF to own. Which ETF will give me the best chance to outperform should my assessment of market conditions be correct, and which one will protect me the most should my assessment be wrong? My view is value-oriented at the moment, so you’ll find me naturally leaning toward low P/E ETFs. However, many low P/E value ETFs also have low growth rates, so you’ll underperform should growth stocks turn things around.
I like how FNDX looks today and am rating it a buy, but it’s probably not the best long-term holding, and there are likely more cost-efficient ways to mimic its exposure. As I described initially, a 0.25% expense ratio means you’re paying 5.77% of your total gains in fees over 20 years. You can mitigate this by simply allocating new capital to rules-based ETFs with lower Tech exposure and higher exposure to Energy and Financials. Even better, pick a few of your favorites from XLE and XLF to temporarily boost exposure in these sectors and wait for more clarity as global markets settle down. Try to avoid doing anything drastic, as that could generate an unwanted taxable event, and work on creating a portfolio with the combination of valuation and growth you desire. Thank you for reading, and I’m happy to answer questions about other ETFs you may hold in the comments section.
Be the first to comment