


TARIK KIZILKAYA/iStock via Getty Images
Strong loan growth will likely be the chief driver for FNCB Bancorp’s (NASDAQ: NASDAQ:FNCB) earnings in the next year and a half. On the other hand, the margin will likely dip this year as the re-pricing of deposits will outweigh the re-pricing of earning assets. Meanwhile, the provisioning for expected loan losses will likely remain at a normal level. Overall, I’m expecting FNCB Bancorp to report earnings of $1.06 per share in 2022, almost unchanged from last year. For 2023, I’m expecting the company to report earnings of $1.15 per share, up 9% year-over-year. The year-end target price suggests a moderate upside from the current market price. Further, FNCB is offering a high dividend yield. Based on the total expected return, I’m adopting a buy rating on FNCB Bancorp.
Pennsylvania’s Economy is Pivotal for Loan Growth
Compared to previous years, FNCB Bancorp’s loan growth has been extraordinary so far this year. The portfolio has already grown by 11.2% in the first half (22% annualized), raising hopes of at least mid-teen growth for the full year. However, high interest rates are likely to dampen credit appetite, leading to a deceleration of the growth rate from the first half’s level.
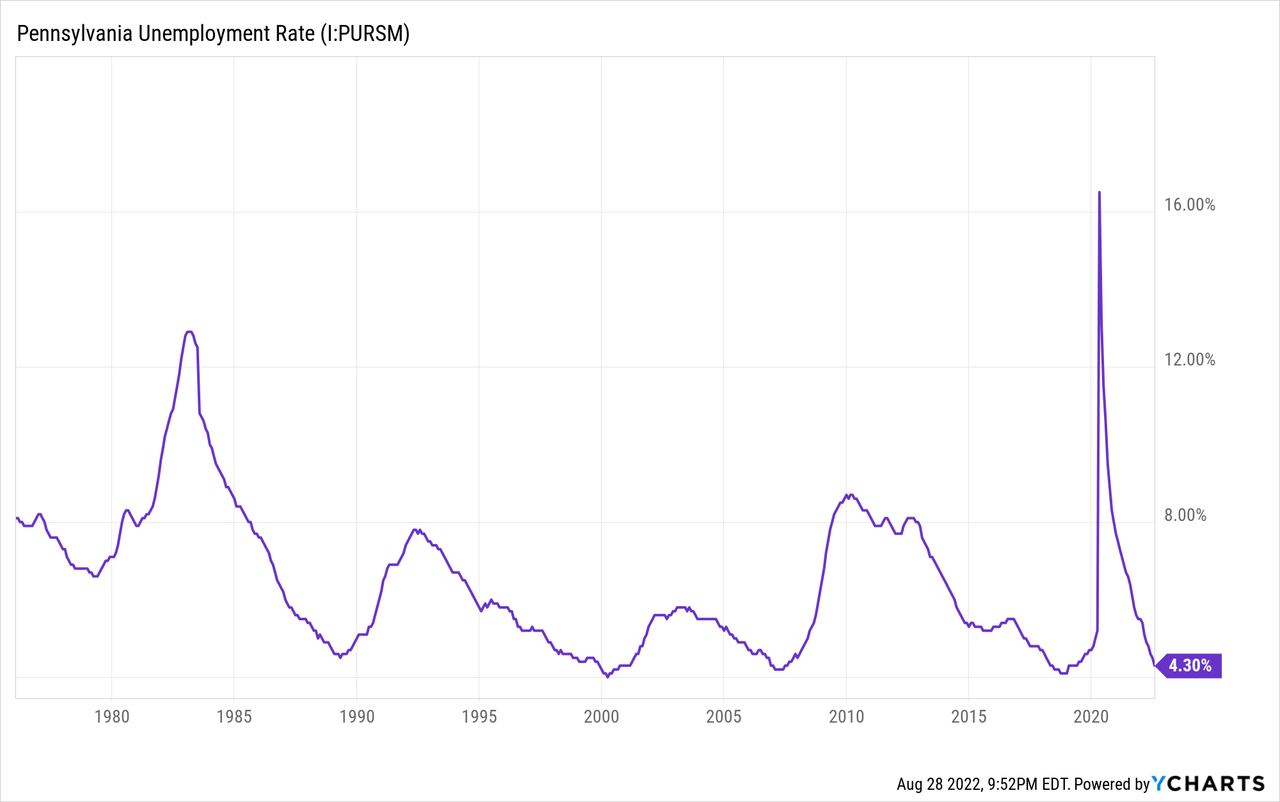
On the other hand, strong job markets and reasonable economic activity in local markets will likely keep loan growth near the historical median. FNCB mainly operates in northeastern Pennsylvania, including Lackawanna, Luzerne, and Wayne counties. The state has a commendable job market, with an unemployment rate that is very low from a historical perspective.
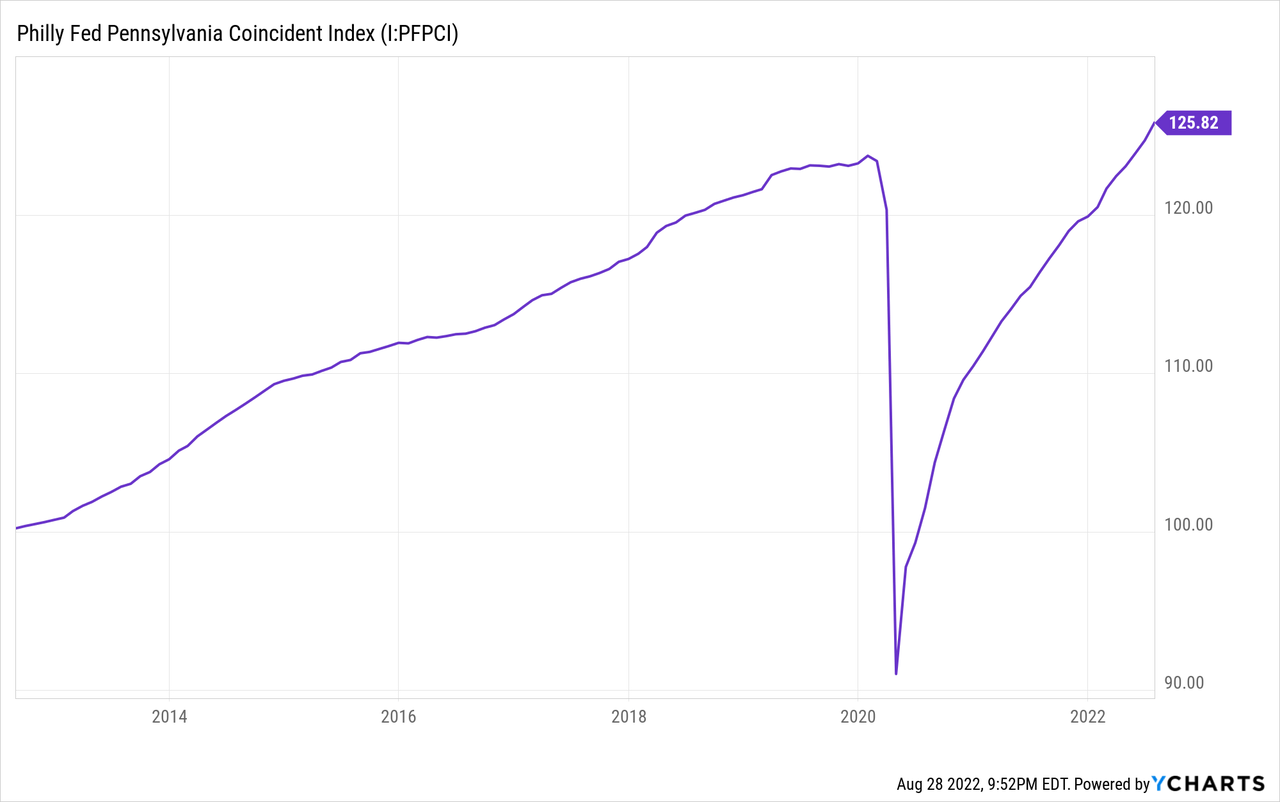
Further, the coincident index indicates that economic activity in Pennsylvania is at a satisfactory level.
Overall, I’m expecting the loan portfolio to grow by 2% every quarter, or 8% annualized, through the end of 2023, which is close to the historical trend.
Margin to Suffer from Rising Interest Rates
FNCB’s balance sheet is liability sensitive in the short term, which means the re-pricing of liabilities will outweigh the re-pricing of assets. The following factors contribute to liability sensitivity.
- A large balance of adjustable-rate deposits. Non-maturing interest-bearing deposits made up a hefty 66% of total deposits at the end of June 2022, according to details given in the 10-Q filing. These deposits re-price frequently; therefore, they will pressurize the margin amid a rising rate environment.
- A large balance of securities. The available-for-sale debt securities portfolio made up a sizable 31% of total earning assets at the end of June 2022. A majority of debt securities are based on fixed rates. Therefore, they will weigh down the average earning-asset yield as rates rise.
The results of the management’s interest-rate sensitivity analysis given in the 10-Q filing showed that a 200-basis points hike in interest rates could DECREASE the net interest income by 7.4% over months. Considering these factors, I’m expecting the margin to dip by 5 basis points in the second half of 2022 and then remain unchanged throughout 2023.
Normalized Provisioning Likely
The loan portfolio’s asset quality has improved tremendously over the last year. Nonperforming loans made up just 0.26% of total loans at the end of June 2022, down from 0.46% at the end of June 2021. As a result of the reduction in nonperforming loans, the allowance now appears at a comfortable level. Allowances were 1.23% of total loans at the end of June 2022. In my opinion, FNCB can easily ride out the upcoming headwinds without making any out-of-the-ordinary contributions to reserves. The upcoming headwinds include high inflation, rising interest rates, and the possibility of a recession.
Overall, I believe provisioning will likely remain at a normal level through the end of 2023. I’m expecting the net provision expense to make up around 0.17% of total loans (annualized) in every quarter till the end of next year, which is the same as the average from 2017 to 2019.
Expecting Flattish Earnings for 2022, Moderate Growth for 2023
The anticipated loan growth discussed above will likely be the chief driver of earnings for the next year and a half. On the other hand, the reduction in net interest margin will likely drag earnings. Meanwhile, provisioning for expected loan losses will likely remain at a normal rate. Overall, I’m expecting FNCB to report earnings of $1.06 per share for 2022, almost unchanged from last year. For 2023, I’m expecting earnings to grow by 9% to $1.15 per share. The following table shows my income statement estimates.
| FY18 | FY19 | FY20 | FY21 | FY22E | FY23E | |||||
| Income Statement | ||||||||||
| Net interest income | 37 | 36 | 40 | 49 | 54 | 59 | ||||
| Provision for loan losses | 2.6 | 0.8 | 1.9 | 0.2 | 1.8 | 2.0 | ||||
| Non-interest income | 12 | 8 | 9 | 8 | 7 | 7 | ||||
| Non-interest expense | 29 | 30 | 29 | 31 | 34 | 36 | ||||
| Net income – Common Sh. | 13 | 11 | 15 | 21 | 21 | 23 | ||||
| EPS – Diluted ($) | 0.79 | 0.56 | 0.76 | 1.06 | 1.06 | 1.15 | ||||
|
Source: SEC Filings, Earnings Releases, Author’s Estimates (In USD million unless otherwise specified) |
||||||||||
Actual earnings may differ materially from estimates because of the risks and uncertainties related to inflation, and consequently the timing and magnitude of interest rate hikes. Further, a stronger or longer-than-anticipated recession can increase the provisioning for expected loan losses beyond my estimates.
Further Book Value Erosion Likely
FNCB has a large balance of available-for-sale securities, which made up 31% of total earning assets at the end of June 2022. As a result, the company has accumulated significant mark-to-market losses on this portfolio amid the rising-rate environment. These unrealized losses have bypassed the income statement and gone directly to the equity account, as per relevant accounting standards. Consequently, the equity book value (tangible) has plunged from $8.13 per share at the end of December 2021 to $6.38 per share at the end of June 2022, according to details given in the earnings release.
I’m expecting a 150-basis point hike in the Federal Funds rate in the second half of 2022 and no change in the first half of 2023 before some rate cuts in late 2023. Therefore, the equity book value will face further pressure this year. On the other hand, retained earnings will lift the book value per share. The following table shows my balance sheet estimates.
| FY18 | FY19 | FY20 | FY21 | FY22E | FY23E | |
| Financial Position | ||||||
| Net Loans | 820 | 820 | 889 | 967 | 1,119 | 1,211 |
| Growth of Net Loans | 9.0% | (0.1)% | 8.5% | 8.8% | 15.7% | 8.2% |
| Other Earning Assets | 300 | 290 | 488 | 612 | 532 | 576 |
| Deposits | 1,096 | 1,002 | 1,287 | 1,455 | 1,485 | 1,607 |
| Borrowings and Sub-Debt | 34 | 57 | 10 | 30 | 134 | 145 |
| Common equity | 97 | 134 | 156 | 162 | 118 | 132 |
| Book Value Per Share ($) | 5.8 | 6.7 | 7.7 | 8.1 | 6.0 | 6.7 |
| Tangible BVPS ($) | 5.8 | 6.7 | 7.7 | 8.1 | 6.0 | 6.7 |
|
Source: SEC Filings, Author’s Estimates (In USD million unless otherwise specified) |
High Dividend Yield, Moderate Upside Calls for a Buy Rating
The annual dividend has increased every year since 2016 when FNCB resumed dividend payments. Given the earnings outlook, I believe it’s very likely that the company will increase its dividend by around $0.025 per share in the third quarter of 2023, leading to a full-year dividend payout of $0.41 per share. This estimate suggests a payout ratio of 36% for 2023, which is higher than the four-year average of 29%, but still easily sustainable.
Despite the reduction in equity book value discussed above, FNCB’s capital is still greater than adequate. The total risk-based capital ratio stood at 13.90% at the end of June 2022, as opposed to a minimum regulatory requirement of 10.50%, given in the 10-Q filing. Therefore, the capital position presents no threats to the dividend payout. My dividend estimate implies an attractive forward dividend yield of 5.0%.
I’m using the historical price-to-tangible book (“P/TB”) and price-to-earnings (“P/E”) multiples to value FNCB Bancorp. The stock has traded at an average P/TB ratio of 1.13 in the past, as shown below.
| FY18 | FY19 | FY20 | FY21 | Average | ||
| T. Book Value per Share ($) | 5.8 | 6.7 | 7.7 | 8.1 | ||
| Average Market Price ($) | 9.0 | 7.9 | 6.4 | 7.7 | ||
| Historical P/TB | 1.55x | 1.17x | 0.83x | 0.96x | 1.13x | |
| Source: Company Financials, Yahoo Finance, Author’s Estimates | ||||||
Multiplying the average P/TB multiple with the forecast tangible book value per share of $6.0 gives a target price of $6.7 for the end of 2022. This price target implies a 17.5% downside from the August 26 closing price. The following table shows the sensitivity of the target price to the P/TB ratio.
| P/TB Multiple | 0.93x | 1.03x | 1.13x | 1.23x | 1.33x |
| TBVPS – Dec 2022 ($) | 6.0 | 6.0 | 6.0 | 6.0 | 6.0 |
| Target Price ($) | 5.5 | 6.1 | 6.7 | 7.3 | 7.9 |
| Market Price ($) | 8.2 | 8.2 | 8.2 | 8.2 | 8.2 |
| Upside/(Downside) | (32.1)% | (24.8)% | (17.5)% | (10.1)% | (2.8)% |
| Source: Author’s Estimates |
The stock has traded at an average P/E ratio of around 10.3x in the past, as shown below.
| FY18 | FY19 | FY20 | FY21 | Average | ||
| Earnings per Share ($) | 0.79 | 0.56 | 0.76 | 1.06 | ||
| Average Market Price ($) | 9.0 | 7.9 | 6.4 | 7.7 | ||
| Historical P/E | 11.3x | 14.1x | 8.4x | 7.3x | 10.3x | |
| Source: Company Financials, Yahoo Finance, Author’s Estimates | ||||||
Multiplying the average P/E multiple with the forecast earnings per share of $1.06 gives a target price of $10.9 for the end of 2022. This price target implies a 33.4% upside from the August 26 closing price. The following table shows the sensitivity of the target price to the P/E ratio.
| P/E Multiple | 8.3x | 9.3x | 10.3x | 11.3x | 12.3x |
| EPS 2022 ($) | 1.06 | 1.06 | 1.06 | 1.06 | 1.06 |
| Target Price ($) | 8.8 | 9.8 | 10.9 | 11.9 | 13.0 |
| Market Price ($) | 8.2 | 8.2 | 8.2 | 8.2 | 8.2 |
| Upside/(Downside) | 7.4% | 20.4% | 33.4% | 46.4% | 59.4% |
| Source: Author’s Estimates |
Equally weighting the target prices from the two valuation methods gives a combined target price of $8.8, which implies an 8.0% upside from the current market price. Adding the forward dividend yield gives a total expected return of 12.0%. Hence, I’m adopting a buy rating on FNCB Bancorp.
Be the first to comment