

JimVallee/iStock via Getty Images
(This article was co-produced with Hoya Capital Real Estate)
Introduction
When it became clearer the US Federal Reserve Board would need to increase the Fed Rate due to 40-year levels of inflation, I posted VRP: Variable Rate Preferred ETF: Nice Choice If Rates Rise. I was only half right and not the part investors desired.
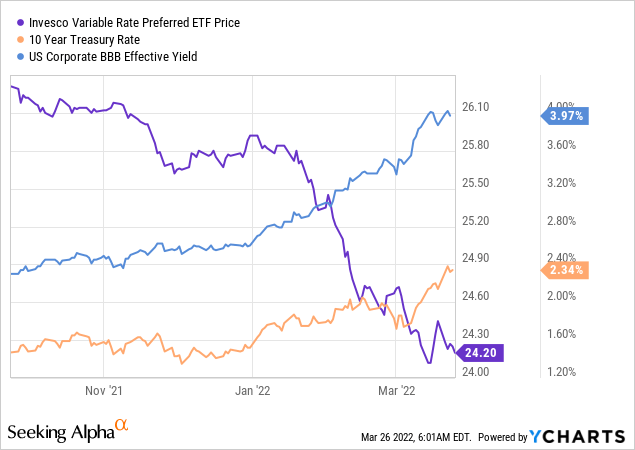
Rates rose but VRP’s floating-rate focus did not protect it against that. One reason being that rates adjust slower than investors’ expectations of where rates will eventually go. A fund’s duration and weighted-average-maturity seem correlated to how fast a fund will respond.
Since that is critical, here are the definitions for both measurements:
Effective duration is the sensitivity of a bond‘s price against the benchmark yield curve. One way to assess the risk of a bond is to estimate the percentage change in the price of a bond against a benchmark yield curve such as a government par curve.
The effective duration figure is used for hybrid securities, which can be divided into a bond and an option (callable bonds). Embedded bonds increase the uncertainty of cash flows and make it difficult for investors to measure the internal rate of return. This is where the concept of effective duration comes into effect.
Source: corporatefinanceinstitute.com
Weighted average maturity (WAM) is the weighted average amount of time until the maturities on mortgages in a mortgage-backed security (MBS). This term is used more broadly to describe maturities in a portfolio of debt securities, including corporate debt and municipal bonds. The higher the WAM, the longer it takes for all of the mortgages or bonds in the portfolio to mature. WAM is used to manage debt portfolios and to assess the performance of debt portfolio managers.
Source: investopedia.com
In short, duration measures price movement related to interest rates and WAM how fast the fund receives its investment back. Both will effect a fund’s return as rates make large movements. Another useful data point is the weighted-average-coupon rate of the underlying bonds in the fund.
As bad as the iShares Floating Rate Bond ETF (BATS:FLOT) long history is, it has been one of the best floating-rate funds over the last six months. While not being a fixed-income expert or analyst, the fore-mentioned factors seem to explain the radical performance change seen in FLOT versus other funds.
Those above listed factor drive the other characteristics of FLOT and why I see the FLOT ETF as more of a cash substitute than a means of providing inflation-matching/beating returns as interest rates are pushed up by both the Fed’s actions and inflationary pressure causing the need to achieve real rates of return. That said, later readers will see even in the cash-substitute area, there appear to be better choices than FLOT.
Investigating the iShares Floating Rate Bond ETF
Seeking Alpha describes this ETF as:
iShares Floating Rate Bond ETF is managed by Blackrock Fund Advisors. The fund invests in the fixed income markets of the United States. It primarily invests in U.S. dollar-denominated, investment grade floating rate notes which have a remaining maturity of greater than or equal to one month and less than five years. The fund seeks to replicate the performance of the Bloomberg Barclays US Floating Rate Note < 5 Years Index. FLOT was formed on June 14, 2011 and is domiciled in the United States.
FLOT has $8.9b in assets and provides investors with (not a typo) only a .4% yield. For that, the managers collect 15bps in fees. Normally at this point, I would give details about the underlying index. Without a Bloomberg subscription, I didn’t have access, nor could I find details online elsewhere.
FLOT Holdings review
ishares.com FLOT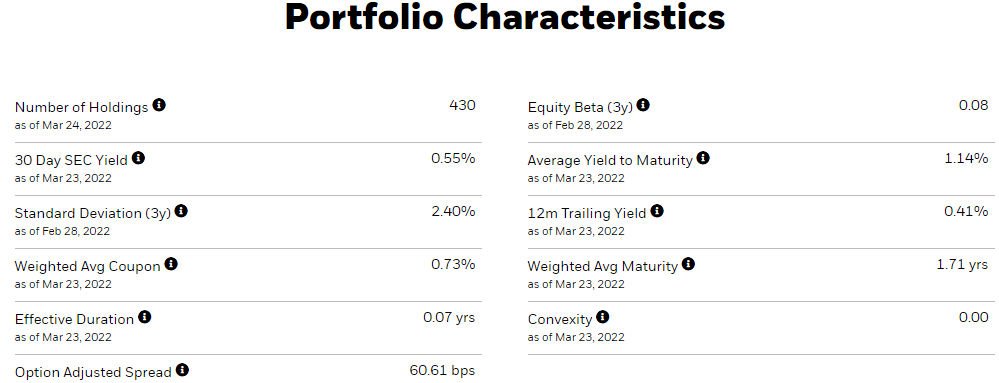
The Effective Duration and Weighted-Average-Maturity are some of the lowest I have seen in a ETF, and I see these as key to unlocking FLOT’s performance when compared to other floating-rate funds. The Option Adjusted Spread measures the weighted average incremental yield earned over similar duration US Treasuries, measured in basis points. In layman’s terms, this fund should yield above a fund owning similar UST debt. That leads to the next holdings chart.
ishares.com FLOT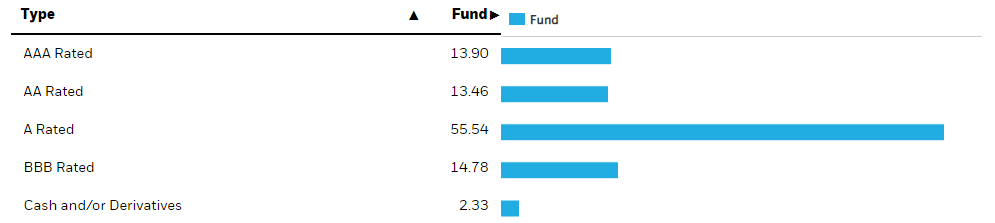
A pure UST fund would be 100% in AAA-rated debt, whereas FLOT is just under 14%. Whether an OAS of 60.61bps is enough reward for the risk of owner lower-rate but still Investment-grade debt is up to each investor to decide. The allocation to the top two ratings is down 5% from year-end. Based on the Corporate/Government allocation, all of the AAA-rate debt was government issued. FLOT is also holds less AAA-rate bonds than its category and the 1-5Y Core Bond index, which should have enhanced its yield via the Index.
Another way to look at Effective Duration is it measures the sensitivity of the price of a bond with or without embedded options to changes in interest rates, taking into account the likelihood of the bond being called, put and/or sunk prior to its final maturity date while incorporating after-tax impacts on the bond.
ishares.com FLOT
The Portfolio Characteristics data states the WAM is 1.71 years. Notice the above footnote includes debt the managers believe will be called within each time frame listed. If this comes to pass, 63+% of the portfolio will be replaced during a period of steadily increase rates. Seeing that the WAC is only 73bps, I thought that the replacement debt should carry a higher coupon than retiring debt, but my calculation brings that into question. Quarterly review of the iShares site will indicate if this is actually happening.
Fidelity.com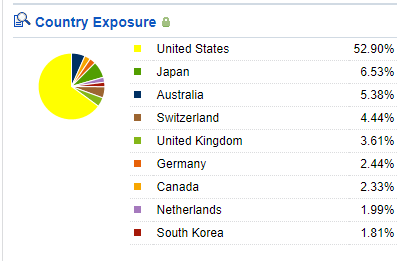
Despite almost 41% of the issuers being non-US, all bonds are denominated in USD, so investors are not taking on any currency risk.
ishares.com FLOT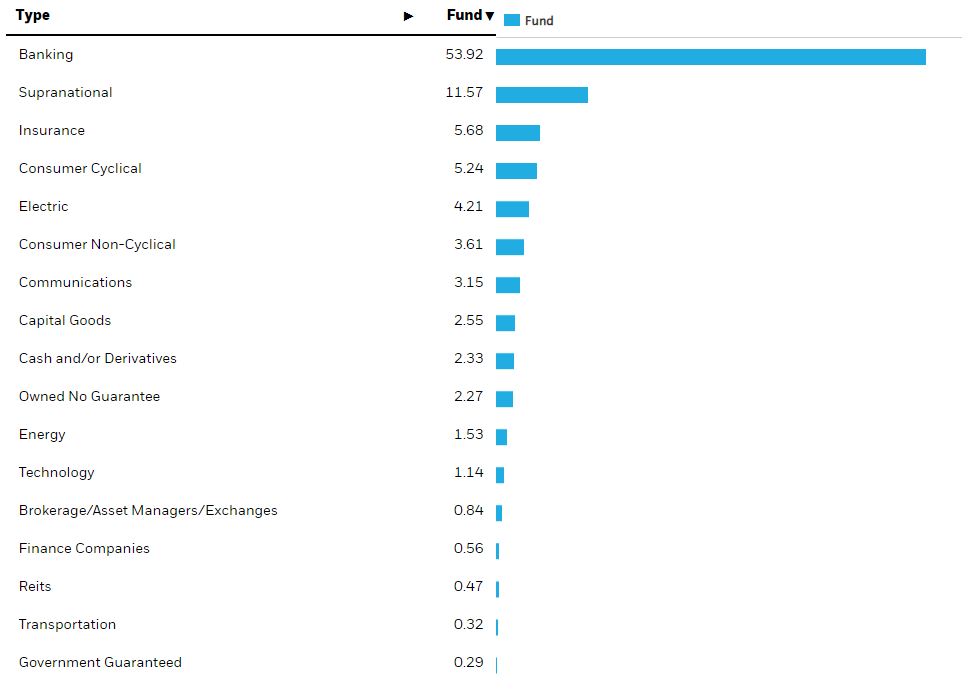
Here we see Banking as the dominate sector with over 53% of the assets. These most likely are loans that a bank made, packaged, and then sold to investors to spread the risk of some large loans the bank made. A Supranational is an issuer like the World Bank where the debt was issued in USDs.
Top 20 holdings
ishares.com; compiled by Author
Out of 432 assets held, the Top 10 are 9.5% of the portfolio; the Top 20 13.7%. FLOT holds debt from about 160 different issuers. The Top 20 are responsible for 48% of the instrument weight held. Several of the Supranational issuers make this list.
ishares.com; compiled by Author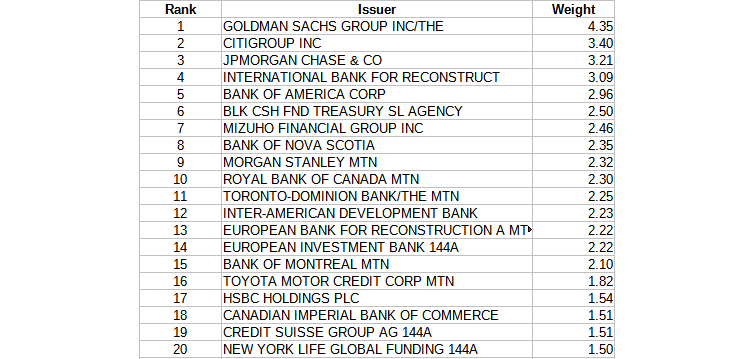
FLOT Distribution review
seekingalpha.com FLOT DVDs
Payouts peaked the summer before COVID-19 had interest rate tumbling. Recent monthly payouts are only about 10% of what was paid at the peak.
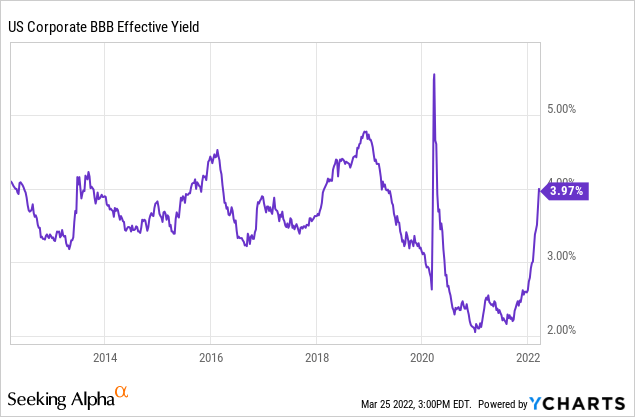
There isn’t a perfect correlation between this BBB-rated index and payouts but the recent upswing in rates should bode well that payouts have bottomed out. That said, recent coupons (.3%) are below the WAC (.9%) of those maturing over the next year.
FLOT Comparison
I ran two comparisons; the first against other funds that have very short durations who also existed most of the time FLOT has. I found four:
- SPDR Bloomberg Barclays Investment Grade Floating Rate ETF (FLRN);
- VanEck Investment Grade Floating Rate ETF (FLTR);
- Invesco Ultra Short Duration ETF (GSY);
- PIMCO Enhanced Short Maturity Active ETF (MINT).
Morningstar.com; compiled by Author
The first two have even shorter durations, a key metric when rates are moving. The other two have longer durations but much shorter Effective Maturity lengths.
PortfolioVisualizer.com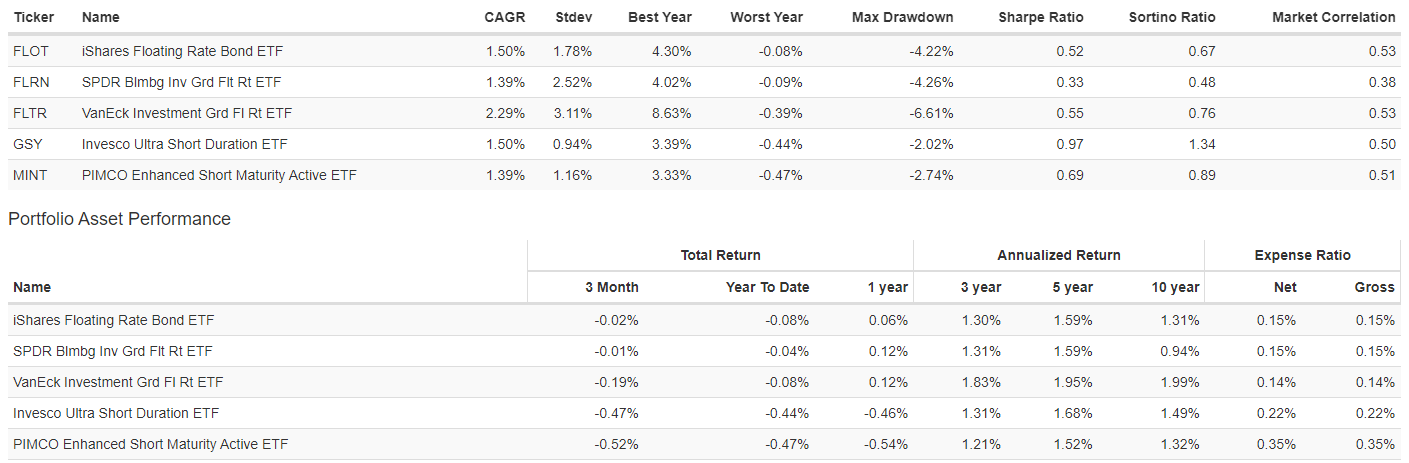
Since 2011, FLTR had the best CAGR but the worst StdDev. Based on the Sharpe and Sortino ratios, the clear winner was GSY. Showing the effect of duration, GSY and MINT, with much higher durations, had, by far, the worst CAGR over the past year.
The second compared FLOT with CEFs that did not focus on duration, only on owning floating-rate securities. These were:
- Nuveen Floating Rate Income Opportunity Fund (JRO)
- Eaton Vance Senior Floating-Rate Fund (EFR)
- Eaton Vance Floating-Rate Income Trust (EFT)
- First Trust Senior Floating Rate Income Fund II (FCT)
PortfolioVisualizer.com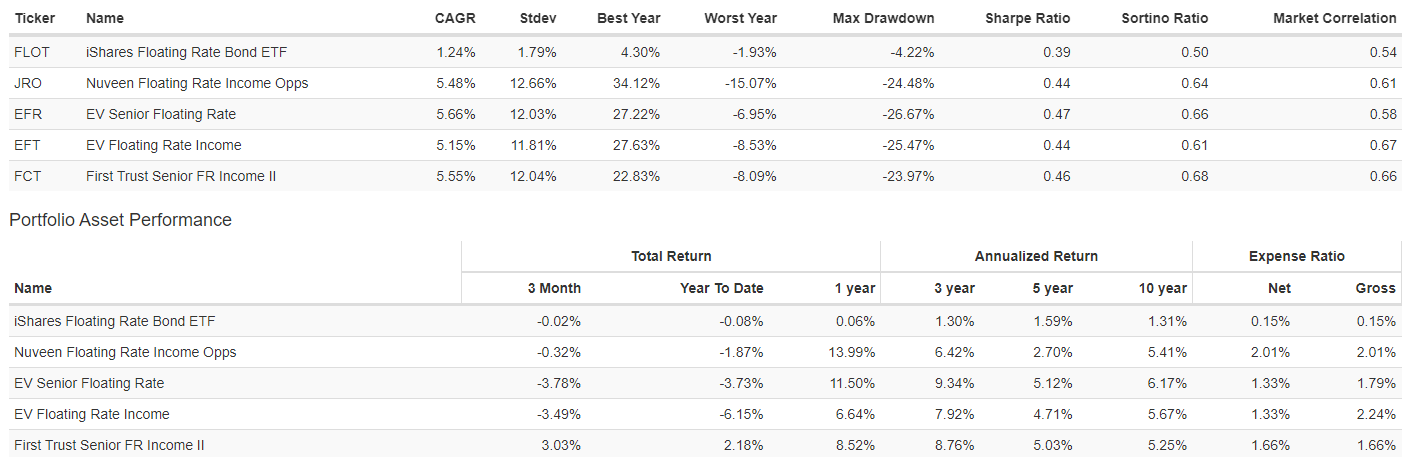
Here, despite having much higher fees, all outperformed FLOT by 391bps or better annually since FLOT started. The trade off is all the CEFs had StdDev of 11.81 or higher, versus FLOT’s meager 1.79. That said, all the CEFs had better Sharpe and Sortino ratios, justifying the risks they took.
To show how the price movements varied, I charted FLOT against the ETF and CEF with the highest StdDev.
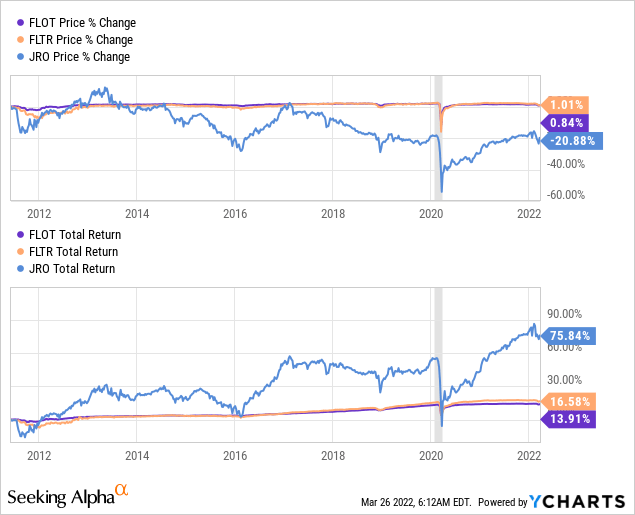
FLOT was the most stable in its price movement, a reflection of it low duration and short WAM. While JRO had the poorest price movement, its superior yield resulted in the best performance.
Portfolio Strategy
We currently are in a very tough investment environment, even discounting the interruptions caused by Putin’s invasion of Ukraine and the economic sanctions imposed on Russia and the inflationary consequences of the grain, fuels, and metals supply chain issues it has caused. Even before that started, inflation in the US was at levels not seen in 40 years, and similar stats appeared around the world. With equity values, especially in the US, at historic levels too, predictions of a “lost decade” for investors were regular headlines in the financial press.
Investors of the pre-2008 GFC, would safely put their “risk avoidance” funds in 5% CDs and wait it out. While I see 2.4% available today, a year ago those rates were easily half that level.
So where does this leave investors as far as the FLOT ETF is concerned? While Floating-rate CEFs have the ability to invest anywhere in that space, index-linked ETFs are restricted. This shows in the above chart as FLOT and FLTR show similar results and that is due to both investing based on the same index. They do not get to set those important variables listed above: duration, WAM, and WAC.
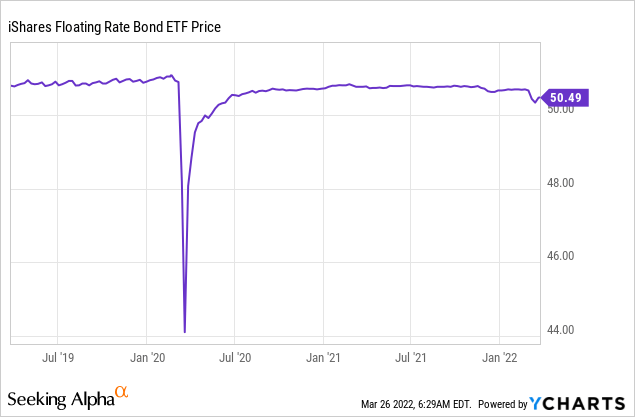
In this investor’s opinion, unless you need instant access to those funds, laddering a set of 3-to-9 month CDs, yielding .5-1%, seems a better options than FLOT’s smaller yield and higher risk. Even though its price movement is very sedate, black swan events can happen as shown below.
Final Thoughts
Because each investor’s goals, net worth, and life situations differ from most other investors, they need to evaluate any asset reviewed on Seeking Alpha or other financial site from where they are in life, not the “crowd.” Opinions expressed by authors most likely reflect, to some degree, their own situation and investment preferences; while I know, like me, they try to present an unbiased analysis. Just something to keep in mind when reading articles or watching all those TV ads about the “next great investment!”.
Be the first to comment