Luis Alvarez
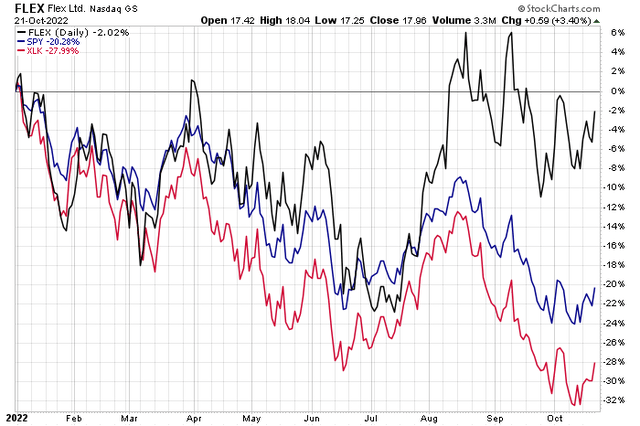
Many tech stocks have stumbled hard in this year. The Technology Select Sector SPDR ETF (XLK) is down 28% year-to-date, underperforming the S&P 500 ETF (SPY) by nearly eight percentage points.
One of the sector’s stocks, though, has rallied big from earlier this summer. Will shares move higher after earnings this week? Let’s weigh the risks.
FLEX: Relative Strength This Year, Big Q3 Rally
According to Bank of America Global Research, Flex Ltd (NASDAQ:FLEX) is a global provider of vertically-integrated supply chain services starting from PCB fabrication, design, engineering, and manufacturing services through after-sales support. The core business includes the Reliability Solutions and Agility Solutions segments.
The California-based $8.2 billion market cap Electronic Equipment Instruments & Components industry company within the Information Technology sector trades at a low 9.3 trailing 12-month GAAP price-to-earnings ratio and does not pay a dividend, according to The Wall Street Journal.
The firm has been transitioning into higher-margin segments and features good free cash flow. Moreover, penetration into new markets creates upside earnings potential. Downside risks include ongoing component shortages and elevated transport and logistics costs due to the pandemic’s aftereffects. Also, a global recession might hit this cyclical tech stock harder than others. Emerging market exposure is another question mark.
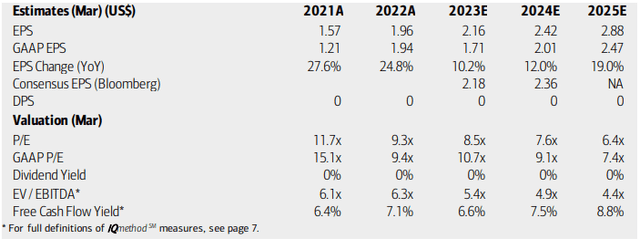
On valuation, analysts at BofA see earnings growing strongly this year while real EPS, net of inflation, is seen even better next year and in 2024. The Bloomberg consensus per-share profit forecasts are even higher. While FLEX does not pay a dividend, its EV/EBITDA multiple remains low and the FCF multiple is in the low teens looking out into ‘23 and ‘24. Overall, the valuation case is compelling and has an A- rating from Seeking Alpha.
FLEX: Earnings, Valuation, Free Cash Flow Forecasts
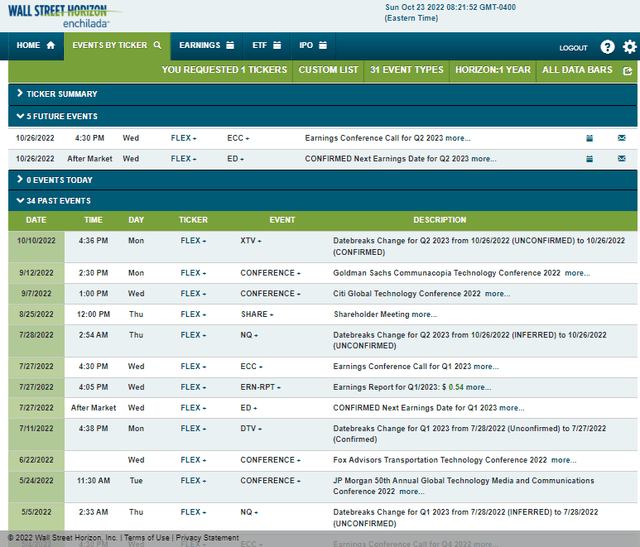
Looking ahead, FLEX has a confirmed Q2 earnings date of Wednesday, Oct. 26 AMC with a conference call immediately after results post. You can listen live here. The corporate event calendar is light aside from the earnings report.
Corporate Event Calendar
The Options Angle
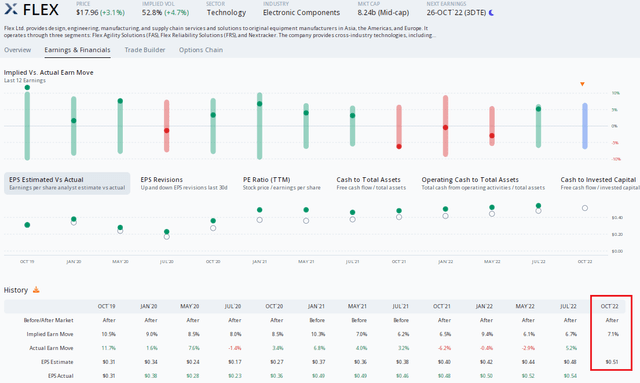
Data from Option Research & Technology Services (ORATS) show a consensus EPS forecast of $0.51 which would be a slight increase from the $0.48 figure earned in the same quarter a year ago. FLEX has a very impressive earnings beat rate history, topping estimates in each of the previous 12 releases. Shares have traded lower, however, in three of the last four report reactions.
As for this Wednesday’s anticipated move, ORATS reports that the options market has priced in a 7.1% post-earnings stock price swing using the nearest-expiring at-the-money straddle. Considering that shares have not moved more than 7% since the May 2020 report, that might be on the expensive side for those playing the options.
FLEX: Pricey Options Ahead Of Earnings
The Technical Take
Last time, I described a bullish cup and handle pattern on FLEX shares. That feature is still very much in play, but let’s home in on the near-term look.
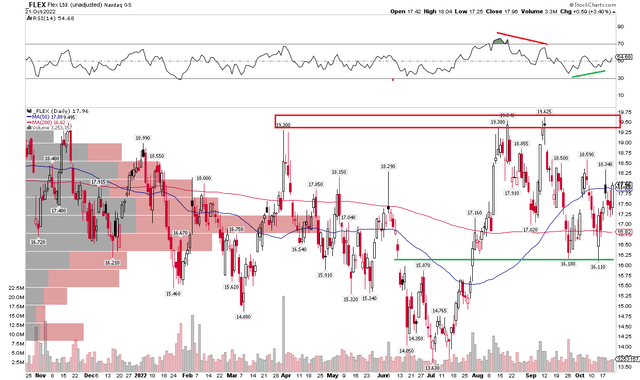
I see resistance in the $19.30 to $19.60 area. A break above $20 on a closing basis would support further upside action and a potential bullish price objective to near $23 based on its recent $3.50 trading range. The base of that range is support from a double-bottom feature that held in September and October.
Also notice that shares have churned with varying levels of momentum as seen in the RSI figure at the top of the chart. There was bearish divergence in September but then bullish positive divergence just recently at the October low. Overall, this sideways price action is a net positive considering weakness in the broad market since mid-August and throughout the year.
FLEX: A Near-Term Trading Range Within A Broader Cup & Handle
The Bottom Line
FLEX has an attractive valuation, strong earnings beat rate history, and favorable long-term and near-term technicals. Relative strength suggests this could be a market leader should we see a rally into year-end. I maintain a buy recommendation.


Be the first to comment