

GBP/USD started a recovery wave and climbed above the 1.1300 resistance. EUR/GBP is trading above the 0.8650 support and might eye a fresh increase.
Important Takeaways for GBP/USD and EUR/GBP
· The British Pound started a fresh increase after it broke the 1.1250 resistance against the US Dollar.
· There was a break above a major bearish trend line at 1.1290 on the hourly chart of GBP/USD.
· EUR/GBP started a downside correction after it failed to clear the 0.8780 zone.
· There was a break below a contracting triangle with support near 0.8720 on the hourly chart.
GBP/USD Technical Analysis
The British Pound found support near the 1.1050 zone against the US Dollar. The GBP/USD pair started a recovery wave and was able to clear the 1.1150 resistance zone.
There was a decent increase above the 1.1250 level and the 50 hourly simple moving average. The pair even climbed above the 1.1300 level. During the increase, there was a break above a major bearish trend line at 1.1290 on the hourly chart of GBP/USD.
A high was formed near 1.1408 on FXOpen and the pair is now correcting gains. On the downside, an initial support is near the 1.1280 level. It is near the 38.2% Fib retracement level of the upward move from the 1.1061 swing low to 1.1408 high.
The next major support is near the 1.1235 level and the 50 hourly simple moving average. It is near the 50% Fib retracement level of the upward move from the 1.1061 swing low to 1.1408 high. Any more losses could lead the pair towards the 1.1180 support zone or even 1.1150.
On the upside, an initial resistance is near the 1.1350 level. The next main resistance is near the 1.1400 zone. A clear upside break above the 1.1400 and 1.1410 resistance levels could open the doors for a steady increase in the near term. The next major resistance sits near the 1.1500 level.
EUR/GBP Technical Analysis
The Euro started a major increase from the 0.8580 zone against the British Pound. The EUR/GBP pair was able to clear the 0.8650 resistance zone to move into a positive zone.
The pair even traded above the 0.8720 level and the 50 hourly simple moving average. It traded as high as 0.8780 and recently started a downside correction. There was a move below the 0.8750 support zone.
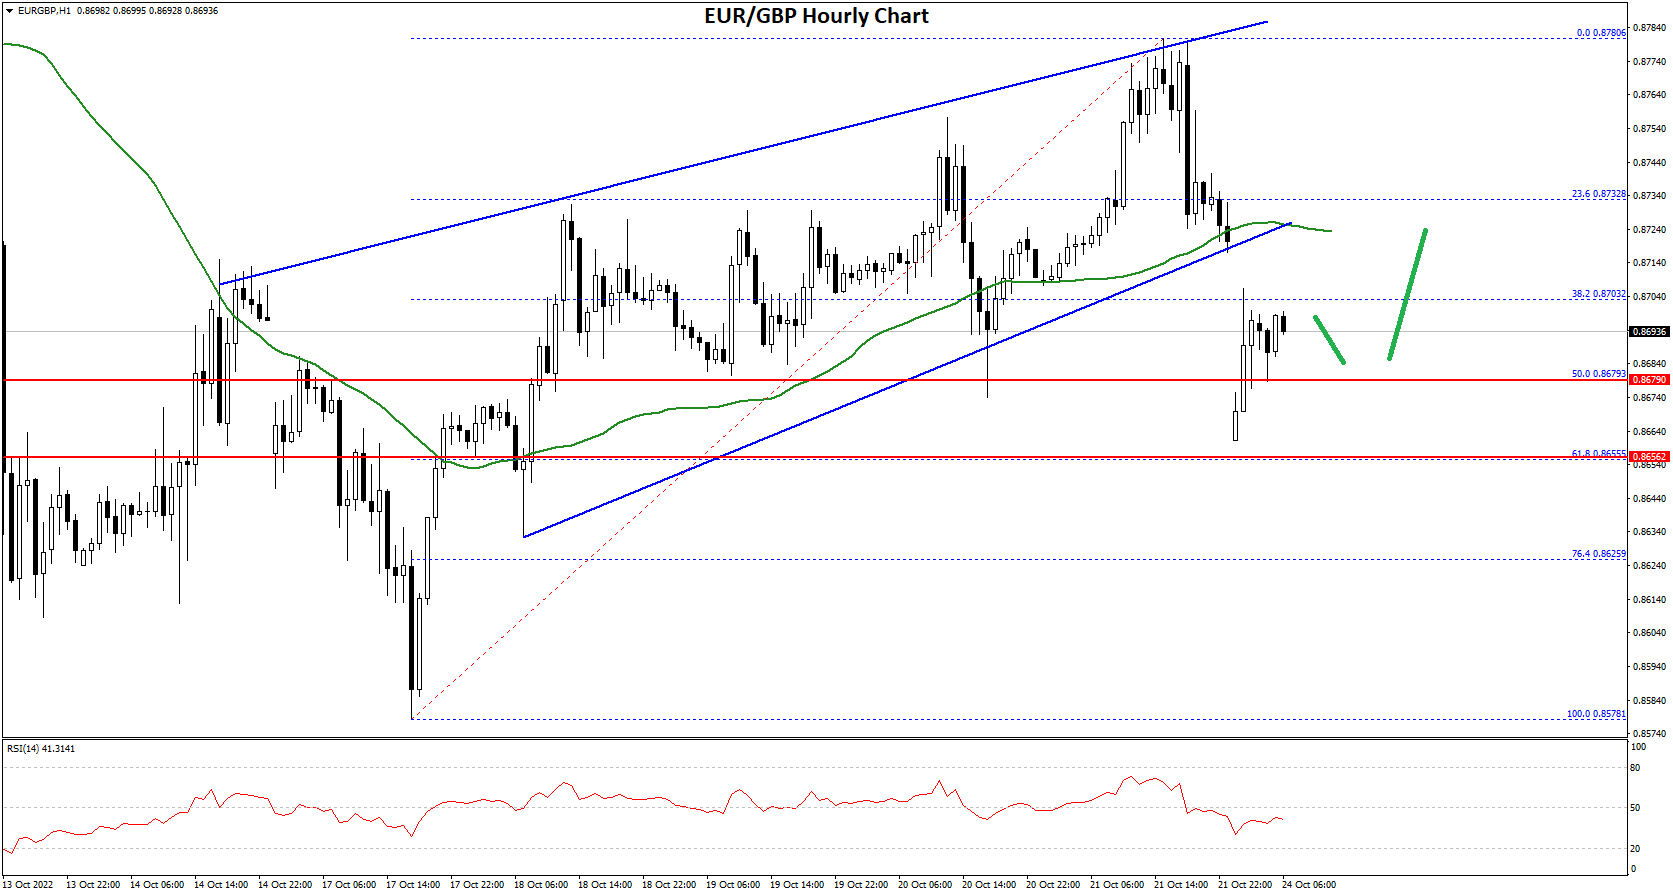
The pair declined below the 50% Fib retracement level of the upward move from the 0.8578 swing low to 0.8780 high. Besides, there was a break below a contracting triangle with support near 0.8720 on the hourly chart.
On the downside, an initial support is near the 0.8675 level. The next major support is near 0.8650. It is close to the 61.8% Fib retracement level of the upward move from the 0.8578 swing low to 0.8780 high.
A downside break below the 0.8650 support might call for more downsides. In the stated case, the pair could decline towards the 0.8600 support level in the near term. On the upside, an immediate resistance is near the 0.8720 level.
The next major resistance for the bulls is near the 0.8780 level. A clear move above the 0.8780 resistance might push the price higher towards the 0.8880 level.
This forecast represents FXOpen Companies opinion only, it should not be construed as an offer, invitation or recommendation in respect to FXOpen Companies products and services or as financial advice.
Trade global forex with the best ECN broker of 2021*.
Choose from 50+ forex markets 24/5.
Open your FXOpen account now or learn more about making your money go further with FXOpen.
* FXOpen International, best ECN broker of 2021, according to the IAFT

Be the first to comment