

cemagraphics
October flash PMI data will provide much needed insights into the risk of some of the world’s major economies falling into recession. Prior data showed global output dropping for a second successive month in September amid worsening worldwide demand linked to the escalating cost of living, tightening financial conditions and rising risk aversion.
However, this slowdown is also exerting downward pressure on many prices, which could in turn drive speculation about monetary policy needing to be tightened less than previously anticipated. However, it is evident that trends vary by region.
We explore more about the recent signals from the PMI surveys for the US, eurozone, UK and Japan, and consider what to look out for in the October flash releases.
Flash PMI data to provide Q4 insights after disappointing Q3
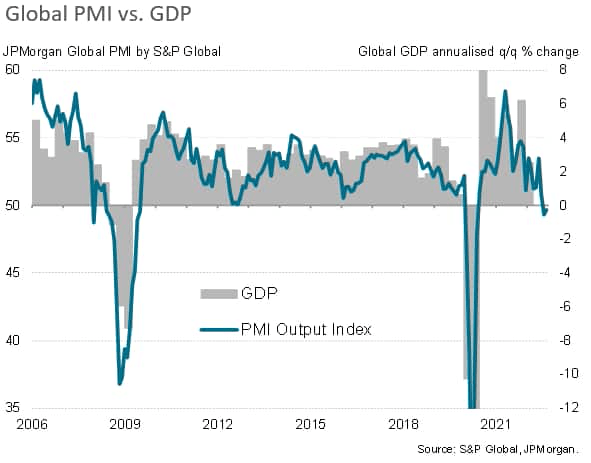
The upcoming October flash PMI data follow downbeat survey findings during the third quarter. Global business activity contracted for a second successive month in September, according to the PMI survey data compiled by S&P Global, with the latest JPMorgan Global PMI reading rounding off the worst calendar quarter since 2009 if pandemic-related lockdowns are excluded. Service sector output was unchanged after falling in August, registering the second-worst monthly performance since early-2020. Manufacturing output meanwhile fell for a second consecutive month, also declining at the second-steepest rate since early-2020.
Japan leads developed economies for first time in PMI history
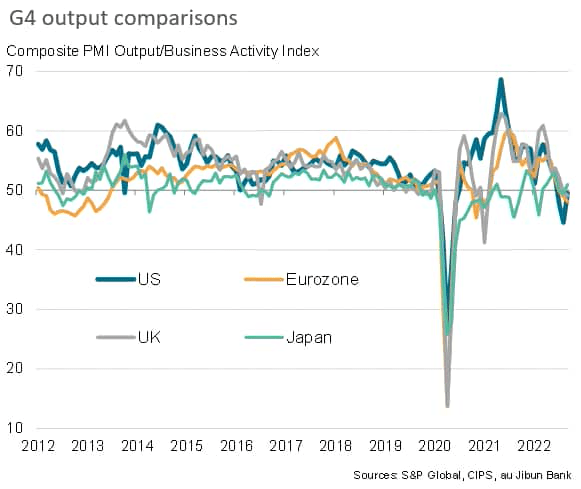
Falling or near-stalled output was seen across the four largest developed economies – the ‘G4’. Only Japan recorded expansion, and even here the rise was only modest. However, Japan’s expansion was notable in representing the first time since comparable PMI data were available in 2009 that Japan outperformed the US, eurozone and UK.
Eurozone facing recession
The eurozone’s third successive monthly decrease in output was the steepest since the debt crisis in 2012-13, excluding pandemic lockdown months. Although signalling only a 0.1% decline in GDP in the third quarter, this contrasts with a more upbeat picture presented by recent official data, which we believe will therefore weaken in coming months in line with the PMI.
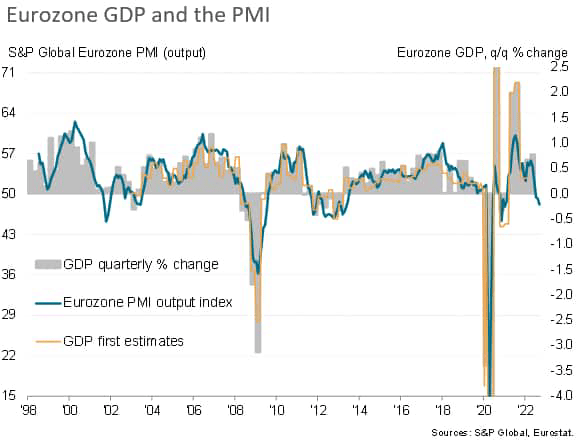
Our forecasting team anticipates falling euro area GDP in the fourth quarter of 2022 and the opening quarter of 2023, leading to a loss of economic output in excess of 1% before modest growth resumes in the spring of 2023.
UK in recession
In the UK, a second monthly drop in output during September was the steepest since 2009, again excluding lockdowns, indicative of GDP falling at a quarterly rate of 0.25%. Similarly, subsequent August GDP numbers showed the economy contracting in the latest three months by 0.3%. The third quarter therefore looks highly likely to be one in which the UK economy contracted, and that was even before the botched ‘mini’ budget in late September.
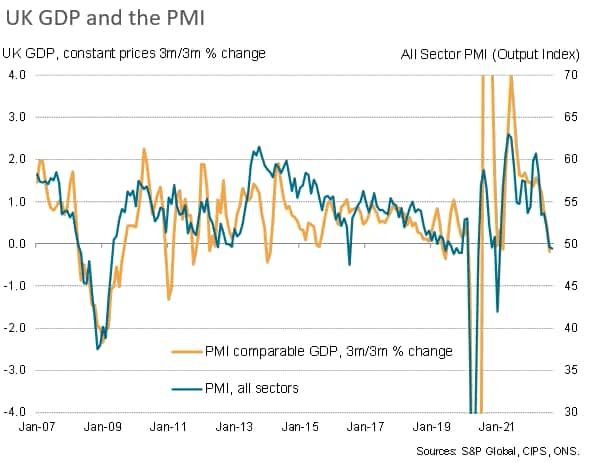
The final September PMI numbers showed a marked deterioration in the expectations index compared to the earlier flash numbers. This suggests that sentiment about the year ahead had darkened further among businesses. This drop in confidence has fueled suspicions that the upcoming October data could show a deteriorating business situation, leading to a fourth quarter contraction and consequent technical recession.
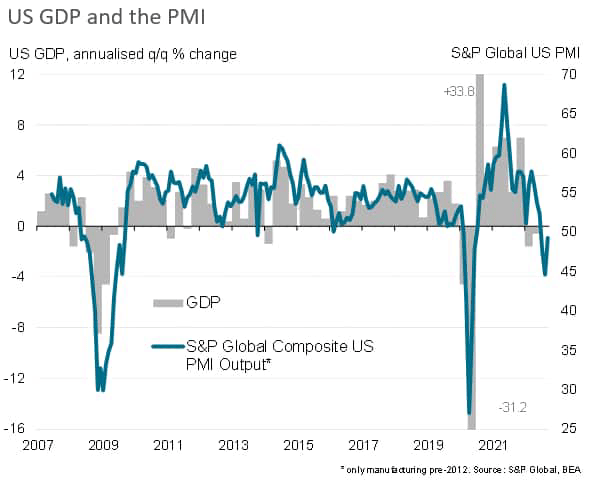
US decline moderates
While the US also continued to contract, with output down for a third month in September to complete the worst quarter since 2009 (barring pandemic shutdown months). The S&P Global PMI survey data therefore point to GDP falling in the third quarter as a whole, adding to recession risks.
However, in contrast to the worsening growth trends seen in the eurozone and UK, the rate of decline moderated in the US during September to the weakest seen over the past three months. Manufacturing returned to modest growth and the service sector downturn moderated, linked in part to easing price pressures and improving supply chains.
As with the eurozone, the US is seeing stronger official data for the third quarter than the PMI, pointing to annualised GDP growth of approximately 2.5%. However, we contend that this in part reflects payback after a weaker first half to the year than signalled by the PMI due to a variety of factors (including inventory changes and volatile trade numbers), and that the PMI better describes the underlying (worsening) trend in the health of the US economy.
Our forecasting team is anticipating that the downturn will become evident in the official data for the fourth quarter, which will see a contraction of GDP and fuel speculation that the US is also falling into a recession.
October’s flash PMI data will therefore add more insight into whether US business conditions have continued to deteriorate at the start of the fourth quarter.
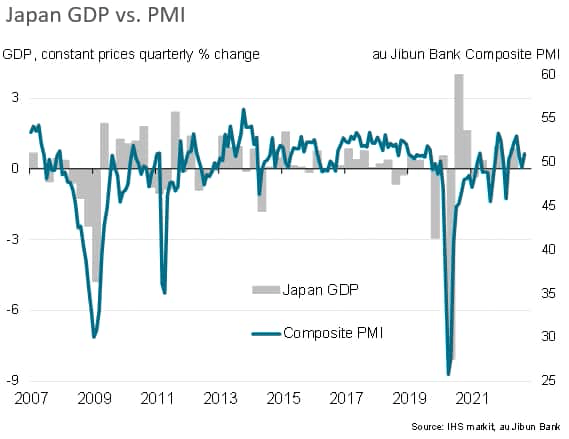
Japan’s outlook challenged by weakened global export demand
In Japan, output returned to growth in September after slipping into decline in August for the first time in six months, according to the au Jibun Bank PMI compiled by S&P Global. However, the rate of expansion remained subdued, thanks in part to a deteriorating manufacturing performance, where exports continued to decline despite the weakened yen. Thus, an Omicron-related rebound in growth in the second quarter of 2022 looks to have given way to a more modest GDP expansion in the third quarter.
Looking ahead to the fourth quarter, our forecasting team anticipates a renewed revival of growth before weakness sets in again at the start of 2023. But the PMI will need to continue to improve in October to match this expected growth trajectory, and we remain concerned about spill-over effects of sluggish growth in mainland China to other parts of Asia at the same time as the cost of living crisis and destocking curb Japan’s exports via weaker global manufacturing growth.
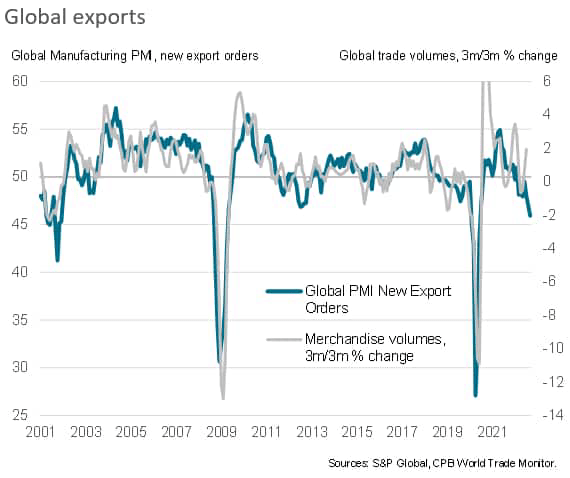
Order books to provide job market guidance
In addition to watching the PMI survey headline output and output expectations indices for clues as to fourth quarter growth trends and recession risks, the surveys’ order book data need to be scrutinised for changing demand signals. In particular, backlogs of work indices will be important in providing insights into capacity utilisation in the months ahead, and will therefore provide leading indicators of output and employment growth.
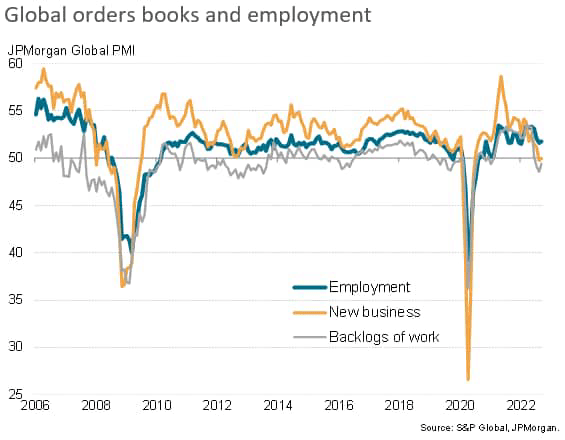
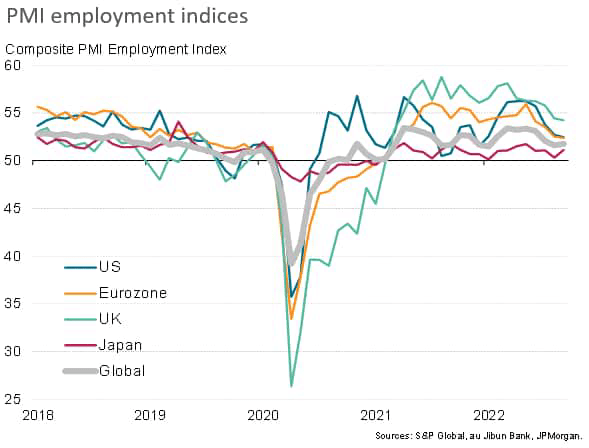
Measured globally, inflows of new orders failed to grow in August and September, led by steepening downturns in Europe. Backlogs of work, which rose sharply during much of 2021 and the first half of 2022, have now started falling, which – if sustained – will eventually put pressure on companies to trim workforce numbers. Jobs growth has already started cooling in the US, eurozone and UK according to the PMIs.
Mixed inflationary trends
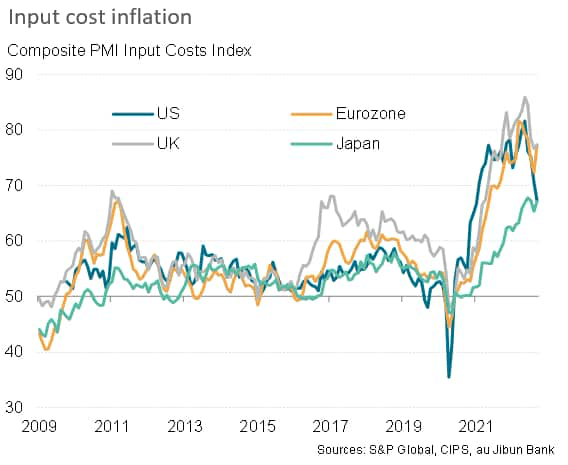
While all four major developed economies are seeing historically elevated inflation rates, the extent of continuing upward pressures have started to vary by country, and these evolving trends will also be important to gauge in the upcoming flash PMI data.
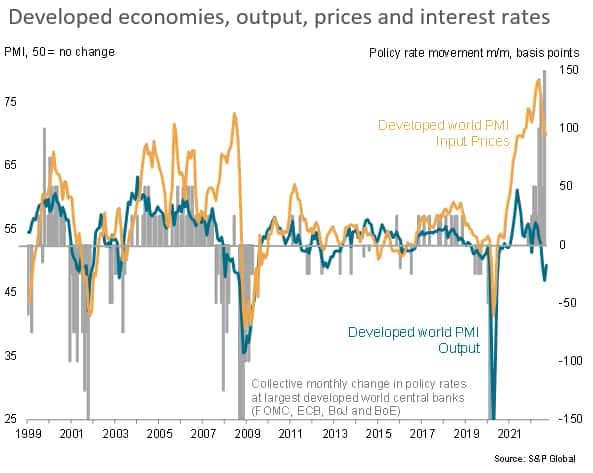
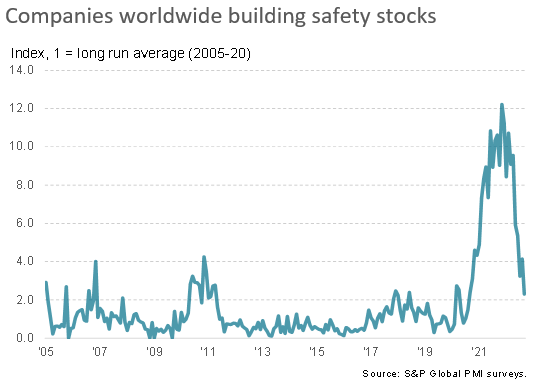
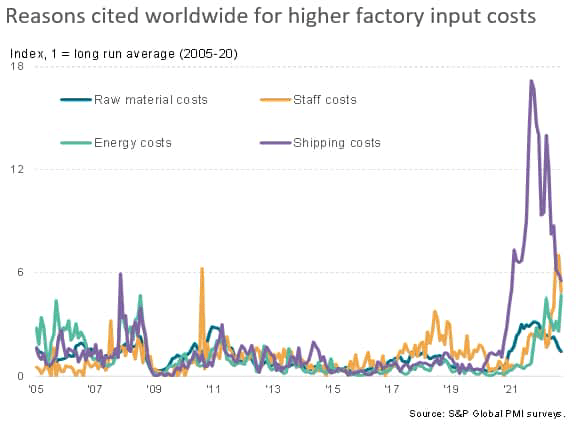
Across the developed world, input cost inflation has cooled as supply chain delays have eased, linked in turn to falling demand for inputs from manufacturers. This deterioration of demand reflects both a drop in final sales to customers but also an increasing shift towards inventory reduction. The number of manufacturers worldwide reporting the need to build safety stocks of items in short supply has fallen sharply, down from a peak of over 12 times the long-run average in mid-2021 to just over two times the long run average in September. This reflects both lower production needs and fewer fears of supply shortages.
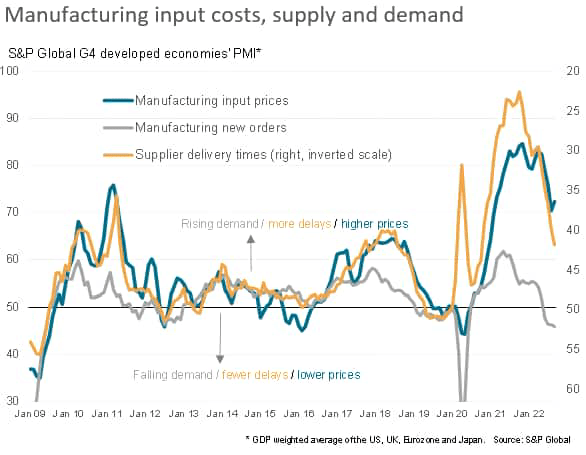
However, the focus is now shifting to the extent to which stubbornly higher energy costs and rising wage pressures might offset the impact of weakened industrial commodity prices (and lower shipping rates), thereby keeping inflation elevated.
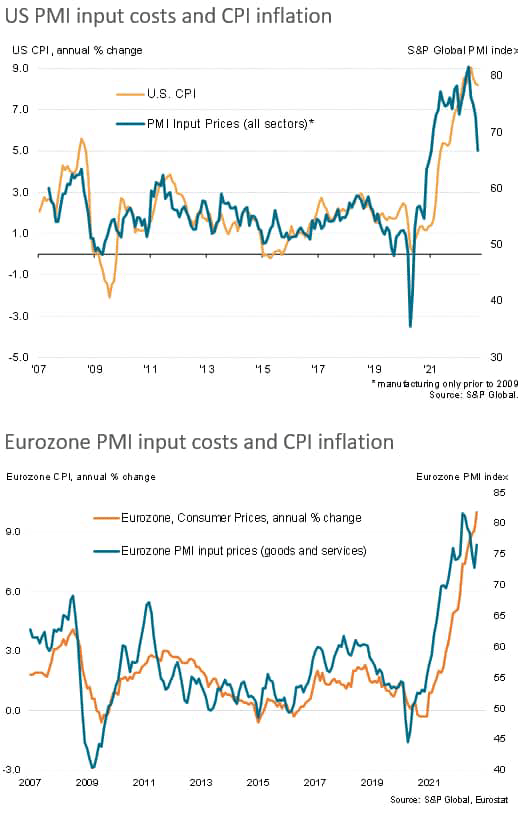
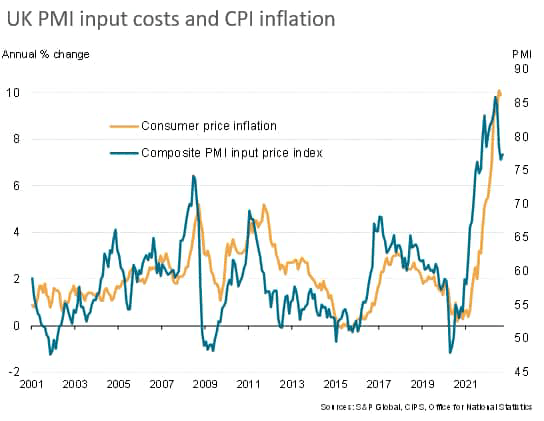
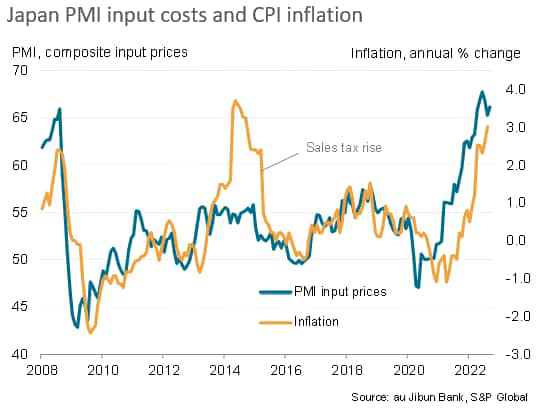
The September data showed cost-driven inflationary pressures to have in fact intensified in the eurozone and UK, driven by surging energy costs as well as upward wage pressures (often linked to industrial action) and weakened currencies, as well as in Japan. However, in the US these cost pressures showed further signs of moderating, driven in part by the strong dollar as well as improved supply conditions.
These varying inflation trends are important to watch for two reasons. First, lower prices facilitate greater demand, for which some signs were already evident in the US. Second, lower cost pressures should take pressure off central banks from aggressive monetary policy tightening, which will likewise spur faster demand growth.
Hence, the PMI price gauges will be as important to watch as the output and order book gauges in the October PMIs, to be published 24th October.
Editor’s Note: The summary bullets for this article were chosen by Seeking Alpha editors.
Be the first to comment