

DNY59/iStock via Getty Images
Executive Summary
Fixed income funds realized a return of negative 4.71% on average during the first quarter of 2022, marking the second negative quarterly performance over the last three quarters and their worst-performing quarter in more than 30 years. Taxable bond funds (-4.37%) outperformed tax-exempt bond funds (-5.67%) in quarterly performance for the sixth quarter in the last eight.
The long-awaited interest rate hiking cycle is upon us. The Federal Reserve announced a 25-basis point (bps) increase in its March meeting while also signaling future rate hikes through 2023-many predictions have the policy rate between 2.0% to 3.0% by the end of the year.
While the tightening was expected, the damage to the broader global economy brought on by Russia’s invasion of Ukraine was not. Unprecedented economic sanctions toward Russia, as a result, were immediately felt in the oil and wheat markets and added to an already stressed global supply chain.
Away from the front lines, prices in the United States continued to elevate along with the cost of living. Personal Consumption Expenditures (PCE) -used to track the price of goods and services purchased by U.S. consumers-inflation expectations increased to 4.3% from December’s 2.6%. The Consumer Price Index (CPI) in February hit an eye-opening 7.9% as the labor market continued to move toward pre-COVID-19 pandemic levels. Non-farm payrolls in March increased by 431,000 helping unemployment fall from 3.8% to 3.6% throughout the month.
The Fed’s hawkish tone in Q1 has pushed up short-term interest rates to the point where there was very little difference between the 10-year Treasury yield and the two-year yield. Soon after quarter-end, we saw the yield curve inverting, which has historically been a signal for an oncoming recession.
The most immediate impact of rising rates has been the real estate market. The 30-year fixed mortgage rose to 4.9% from 3.27% over the last three months, driving down mortgage and refinance applications. The combination of persistent inflation that eats away at fixed rate paying assets, a strong equity bull market, and expectations for an aggressive rate hiking cycle all have hurt fixed income bond funds this quarter.
All 51 Lipper fixed income classifications ended the quarter with sub-zero quarterly performance, which is up from 23 last quarter. Only three Lipper classifications finished the quarter depreciating less than 1.0%.
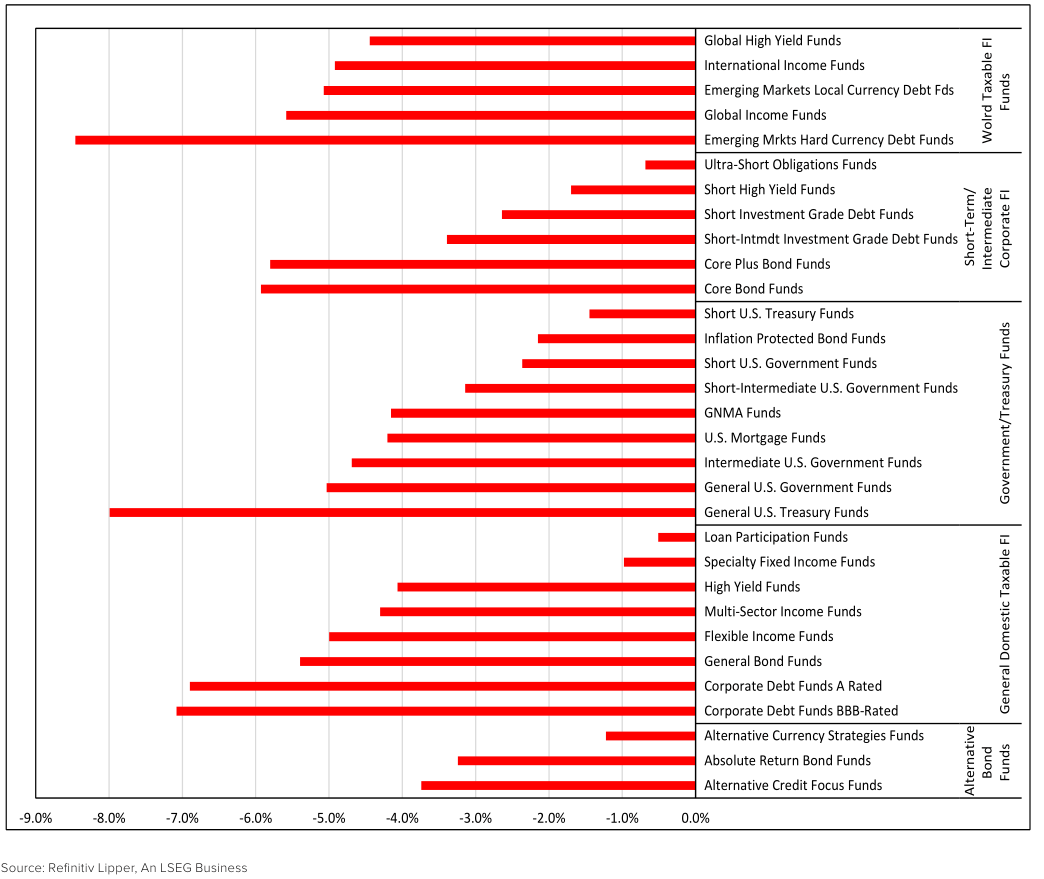
Of the macro-groups, Alternative Bond Funds (-3.22%), Government/Treasury Funds (-3.71%), and Short-Term/Intermediate Corporate Funds (-4.14%) suffered the least.
General Municipal Debt Funds (-6.60%), World Taxable Fixed Income Funds (-6.28%), and Single State Municipal Debt Funds (-5.92%) closed the quarter as the worst-performing macro-groups. General Municipal Debt Funds was the top-performing macro-group last quarter (+0.95%).
Our top three Lipper classifications over the quarter were Loan Participation Funds (-0.51%), Ultra-Short Obligations Funds (-0.69%), and Specialty Fixed Income Funds (-0.98%).
On the flip side, the worst-performing classifications on average were Emerging Markets Hard Currency Debt Funds (-8.46%), General U.S. Treasury Funds (-7.99%), and Corporate Debt Funds BBB-Rated (-7.08%).
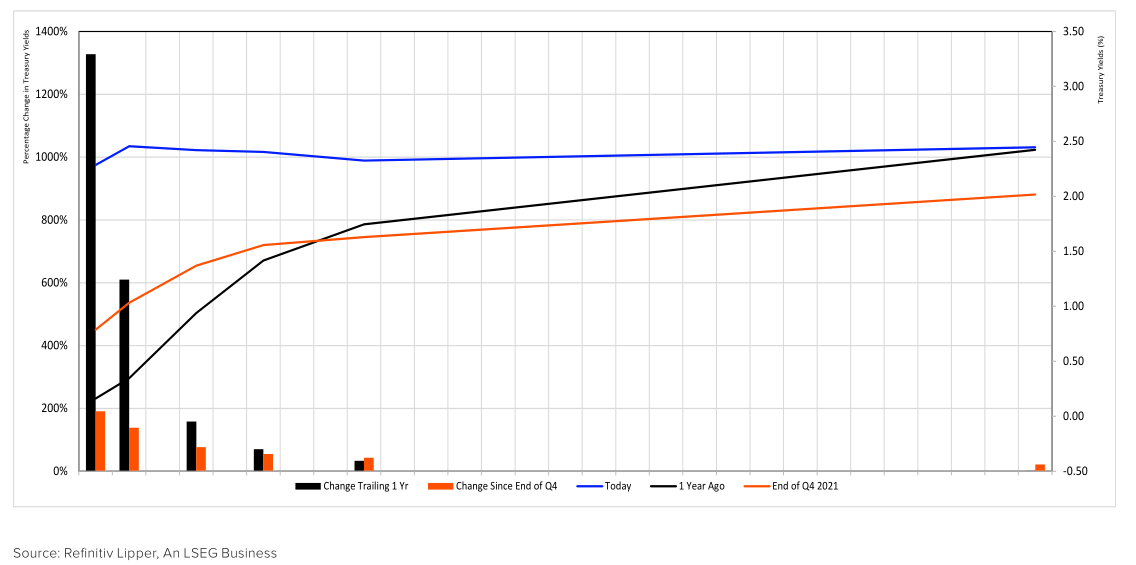
FIGURE 1 – TREASURY YIELD CURVE: MOVEMENT OVER THE PAST YEAR
Government/Treasury Funds Summary
The Treasury yield curve ended the quarter essentially flat with actually an inversion in the middle of the curve. The two- and three-year Treasury yields increased 190.59% and 137.98%, respectively, while the 10- and 30-year yields rose 42.64% and 21.27%. The 10-two Treasury yield spread decreased 95.14% over the quarter to near zero. Over the past year, the two-year Treasury yield increased 1,327.50% while the 30-year only rose 0.95%.
The government/Treasury funds macro-group posted a negative 3.71% return on average over the quarter, marking the second time in the last 14 quarters realizing sub-zero performance and their worst-performing quarter in more than 30 years.
Longer-duration funds across the board performed poorly, but with Treasury yields drastically increasing over the last three months General U.S. Treasury Funds struggled the most. Lipper General U.S. Treasury Funds (-7.99%) were the second-lowest performing fixed income Lipper classification during Q1 2022. The classification recorded its first negative performing quarter over the last year, but it was its second-lowest quarterly return over the past 30 years. Their worst quarter came in Q1 2021 when the classification logged a negative 8.27%. Following Lipper General U.S. Treasury Funds were General U.S. Government Funds (-5.03%), Intermediate U.S. Government Funds (-4.69%), and U.S. Mortgage Funds (-4.20%).
The top-performing Lipper Classifications in this macro-group still realized negative quarterly performance: Short U.S. Treasury Funds (-1.45%), Inflation Protected Bond Funds (-2.15%), and Short U.S. Government Funds (-2.36%). While Inflation Protected Bond Funds speak for themselves, the Short U.S. Treasury and Government Funds are comprised of funds that invest primarily in bonds with a weighted average maturity of fewer than three years. Investors looking to reinvest in higher yields post-rate hiking cycles will find shorter duration issues more attractive.
World Fixed Income Funds Summary
World fixed income funds struggled yet again in Q1 2022. Their negative 6.28% performance was the second-lowest among all macro-groups and second straight negative quarterly performance. A negative 6.28% marks the second-lowest quarterly return in the past 30 years, falling behind Q1 2020 (-10.77%).
The bottom three performers in this macro-group were Lipper Emerging Markets Hard Currency Debt Funds (-8.46%), Global Income Funds (-5.80%), and Emerging Markets Local Currency Debt Funds (-5.07%). Emerging Markets Hard Currency Debt Funds finished in dead last among all fixed income Lipper classifications while logging their third straight quarter in the red. Lipper Emerging Markets Local Currency Debt Funds was the lowest-performing classification in Q4 2021 and also has realized three straight quarters of sub-zero performance.
Lipper Global High Yield Funds (-4.44%) and International Income Funds (-4.92%) finished atop this macro-group. It has been a tough two years for all World Fixed Income Funds, even though these two classifications have reported four negative performing quarters over the last five.
FIGURE 2 – Q1 2022 TAXABLE FIXED INCOME PERFORMANCE (%)
Municipal Debt Funds Summary
Municipal debt funds recorded an average loss of 5.67% in the first quarter of 2022-marking their third quarterly loss in the last five quarters and also their largest quarterly depreciation in more than 30 years.
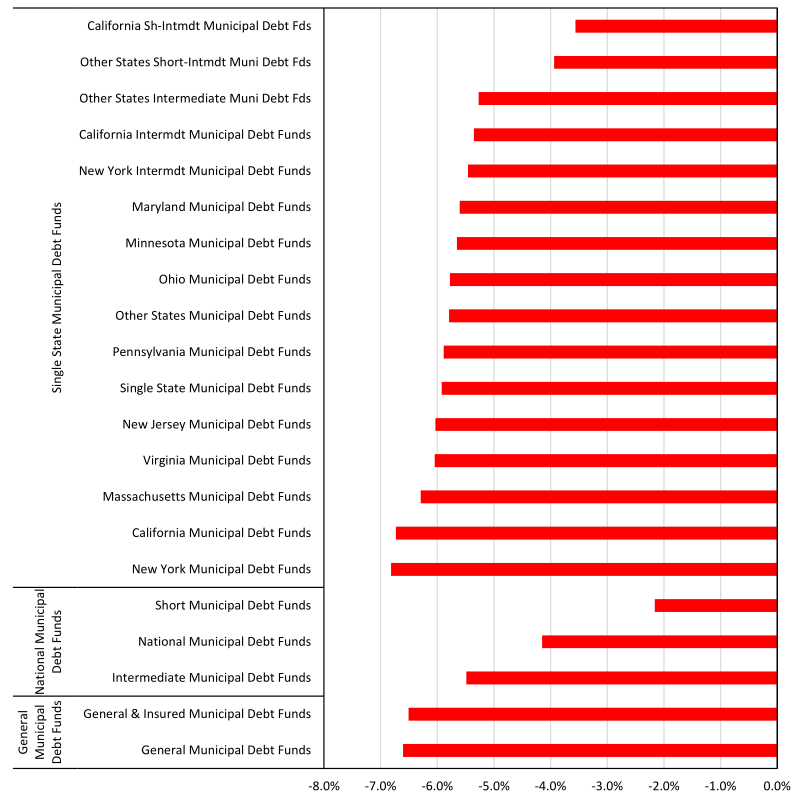
General municipal debt funds recorded the lowest macro-group quarterly performance with a negative 6.60%-marking only their third negative quarter over the past 14. The first quarter was their worst-performing quarter since Q4 2008 when they observed a negative 8.02%.
Single state municipal debt funds (-5.92%) and national municipal debt funds (-4.15%) both also suffered significantly throughout the last quarter. Both single state municipal debt funds and national municipal debt funds have recorded three sub-zero quarters over the last five.
All 21 municipal debt funds Lipper classifications reported negative quarterly performance. The top-performing non-single state tax-exempt Lipper classification was Short Municipal Debt Funds (-2.16%). This classification invests in municipal debt securities with a dollar-weighted average maturity of fewer than three years. Short Municipal Debt Funds have produced three-straight negative quarters.
The three lowest-performing municipal single-state Lipper classifications over Q1 were New York Municipal Debt Funds (-6.81%), California Municipal Debt Funds (-6.73%), and Massachusetts Municipal Debt Funds (-6.29%). These three were the top single-state Lipper classifications during Q4 2021.
FIGURE 3 – Q1 2022 TAX-EXEMPT FIXED INCOME PERFORMANCE (%)
General Domestic Taxable Bond Funds Summary
As a macro-group, general domestic taxable fixed income bond funds finished the quarter returning a negative 4.51%, which ends a three-quarter stretch of plus-side performance. Q1 2022 marks the fourth-lowest quarterly performance in the last three decades: Q4 2008 (-11.41%), Q1 2020 (-9.51%), and Q3 2008 (-6.68).
Lipper Loan Participation Funds (-0.51%) was the leader in the clubhouse at the end of the quarter for not only General Domestic Taxable Bond Funds but all fixed income Lipper classifications. This classification invests primarily in participation interests in collateralized senior corporate loans that have floating or variable rates and has been a popular investment for a while now. Loan Participation Funds have produced 22 positive returning quarters over the last 25.
Lipper Specialty Fixed Income Funds (-0.98%), which are funds that typically have distinctly different performance and strategies, including the use of short positions and leverage, ended as the second top-performing Lipper classification under this macro-group. Specialty Fixed Income Funds finished dead last in this macro group in each of the last two quarters. This is the third consecutive quarter of negative performance for the classification.
The bottom three Lipper classifications under this macro-group in Q1 2022 were Corporate Debt Funds BBB-Rated (-7.08%), Corporate Debt Funds A-Rated (-6.90%), and General Bond Funds (-5.40%). While Lipper Corporate Debt Funds BBB- Rated has only realized two negative performing quarters in the last two years, they finished with the third-lowest quarterly performance among all fixed income classifications.
Short-Term Intermediate Corporate Bond Funds Summary
Short-term intermediate corporate bond funds finished the fourth quarter with negative quarterly performance (-4.14%), their second straight quarter with sub-zero performance. The macro-group realized its worst quarterly performance in more than 30 years.
Lipper Ultra-Short Obligation Funds were the highest performing under the macro-group, returning a negative 0.69% in the first quarter. Ultra-Short Obligation Funds maintain a heavy allocation to investment-grade issues while maintaining an average maturity of less than one year. This is the second straight quarter ending in the red for the classification; prior to that, the Ultra-Short Obligation Funds logged six consecutive positive quarters.
Lipper Short High Yield Funds (-1.70%), which aim at relatively high income from domestic securities that tend to maintain lower debt ratings and weighted average maturities of less than three years, were the second-highest performing classification under this macro-group over the quarter. Short High Yield Funds were the highest performer last quarter and have only realized one sub-zero quarterly performance over the past two years.
The lowest returning Lipper classifications under Short-Term Intermediate Corporate Bond Funds were Core Bond Funds (-5.93%), Core Plus Bond Funds (-5.80%), and Short-Intermediate Investment Grade Debt Funds (-3.39%). Both Core Bond and Core Plus Bond Funds are made up of funds with weighted average maturities of five to 10 years, while Short-Intermediate Investment Grade Debt Funds largely invest in debt issues with maturities of one to five years. Longer duration assets have taken a beating to start 2022.
Be the first to comment