

Michail_Petrov-96/iStock via Getty Images
Economic growth in the United States has not been very active since before the Great Recession that ended in June 2009.
The economic recovery that followed the Great Recession saw economic growth at a post-World War II expansionary low.
In the period between July 2009 and February 2020, economic growth in the United State only achieved a 2.3 percent compound rate. This was the slowest economic recovery since the wartime period.
Economic thought argues that one of the most important components of economic growth is the growth rate of labor productivity.
One of the slowest periods of growth in labor productivity occurred in the period following the Great Recession. Here is the chart on that performance.
Non-farm Labor Productivity (Federal Reserve)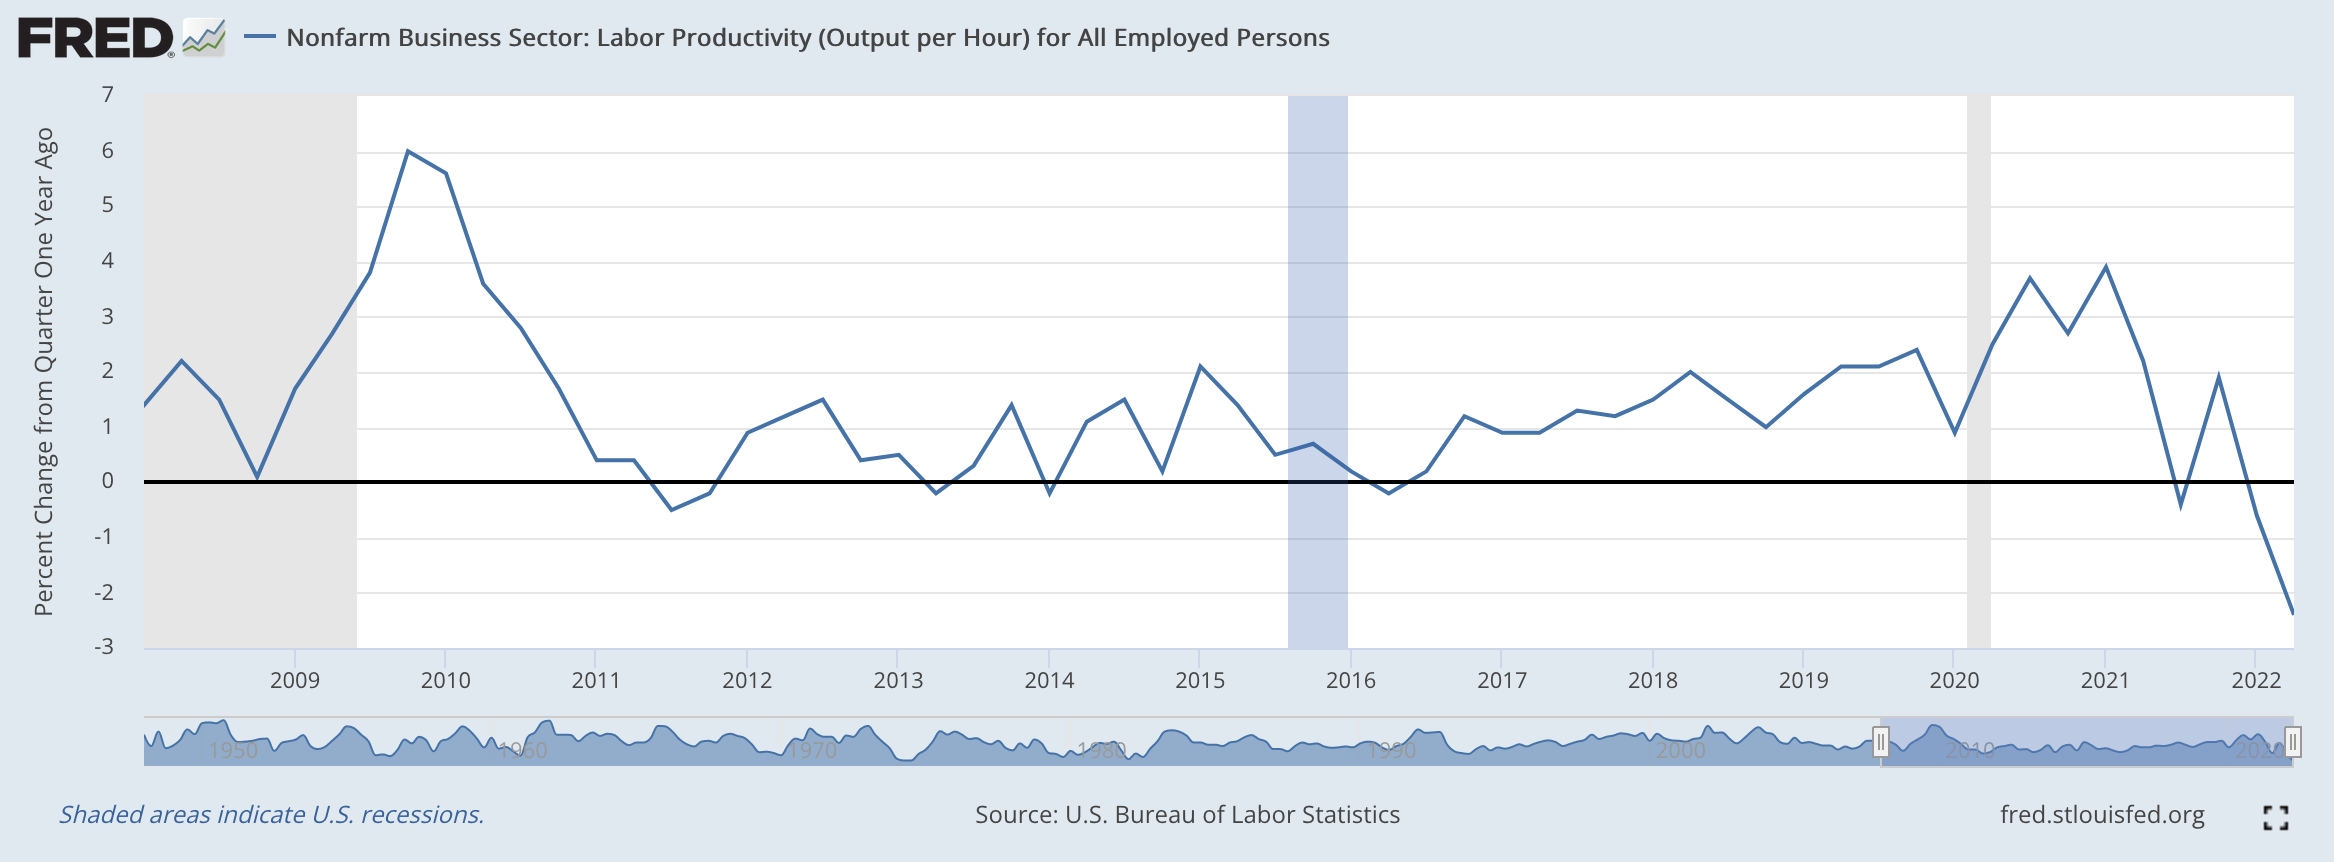
Notice that there is always a “bump” upwards in the growth of labor productivity following a downswing in the economy. This is true of every economic cycle since the end of the Second World War.
The important parts of the chart, for our purposes, are the periods following this “bump” when the economy settles back down to more regular activity.
One can see these “bumps” following both of the periods after the end to the recessions occurring in this time frame.
Labor Force Participation
One needs to notice one more thing when looking at the growth of labor productivity.
The productivity that was achieved was with a shrinking Labor Force Participation rate.
That is the actual growth in labor productivity is augmented because workers have been leaving the workforce.
Labor Force Participation Rate (Federal Reserve)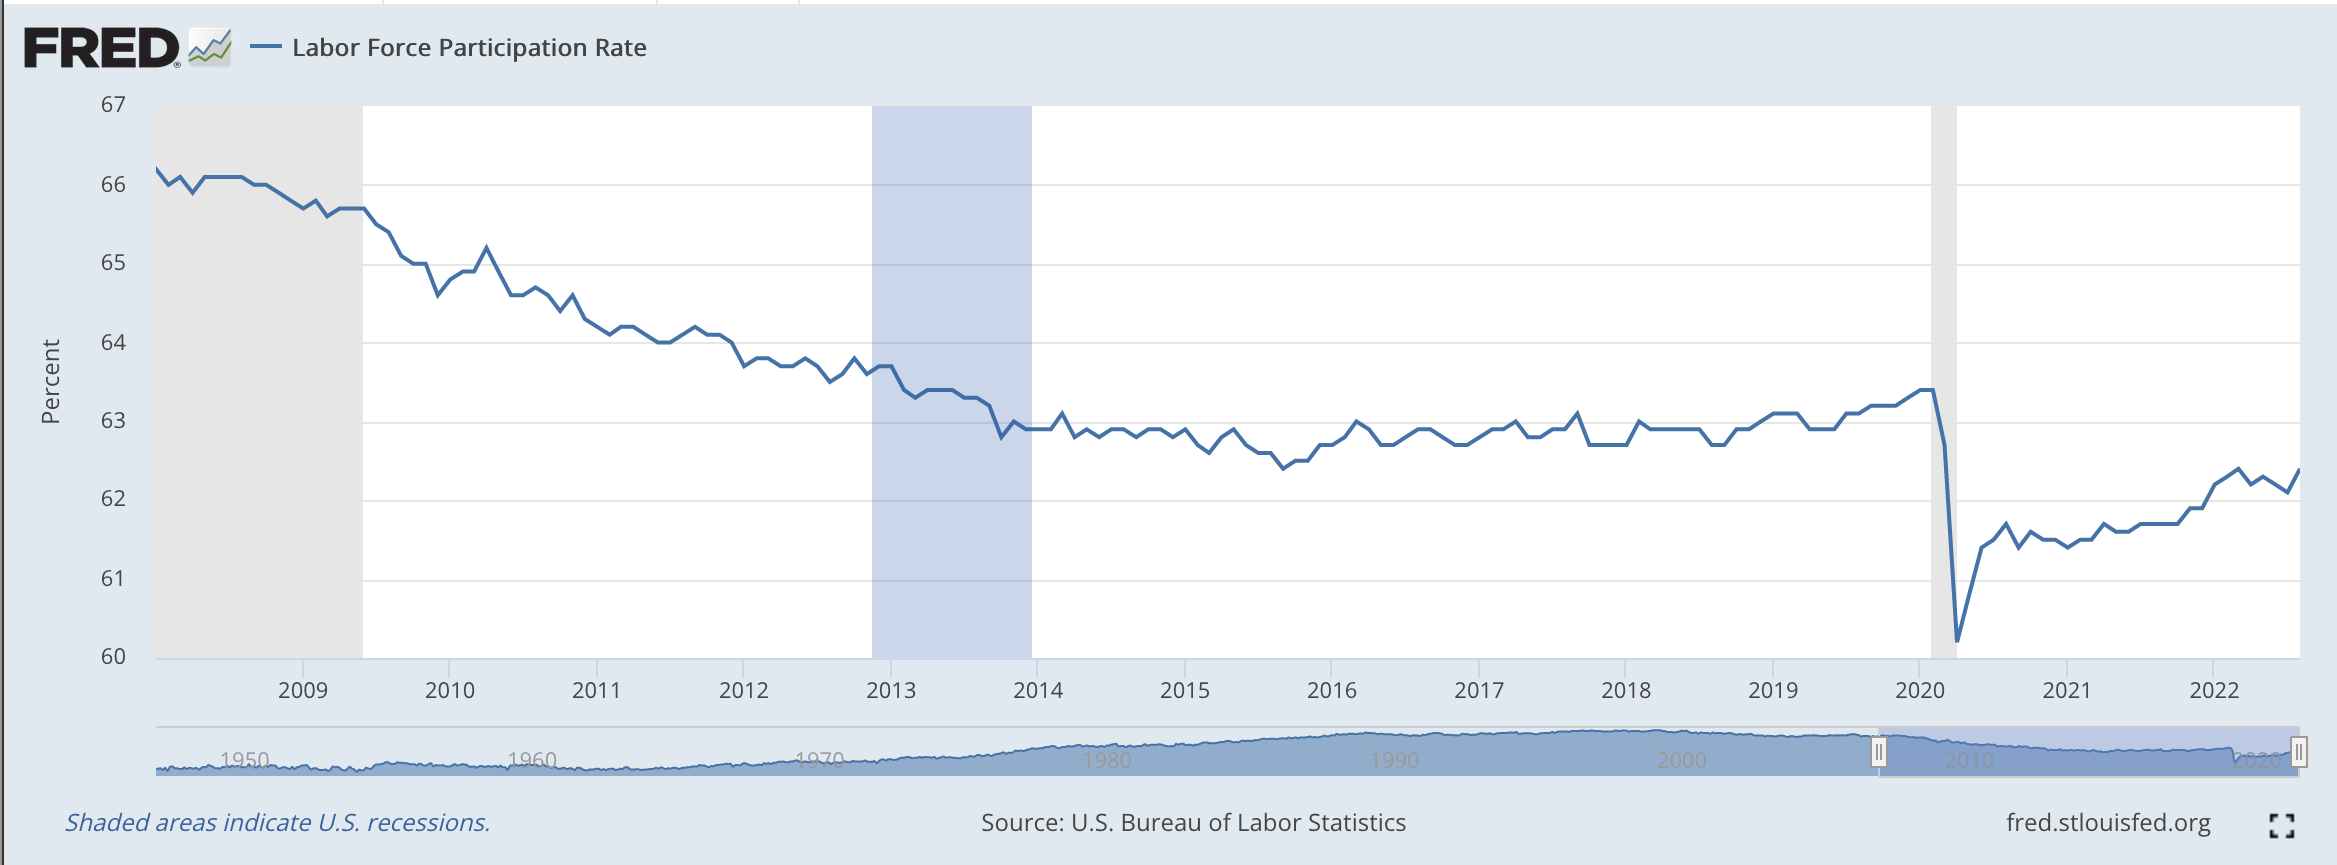
During the time period under review, the actual productivity that was being achieved was increased by the fact that the work was being done by fewer and fewer people.
This is particularly notable around the time of the Covid-19 Recession in 2020.
The point: the growth of labor productivity during this time period was abysmal. The supply side of the economy was doing next to nothing in the period after the great recession.
In the period from 2010 through 2018, the “average” yearly rate of increase in labor productivity was 0.7 percent…not even one percent a year!
In the period from 2000 through 2007, the rate of labor productivity in the United States was 2.6 percent. And, in the period from 1990 through 2000, the rate of growth was 2.2 percent.
Something changed. I have written about this several times before and, I believe, that the more we learn, the more this slowdown in U.S. economic growth came about due to a change in the economic policy of the government.
Economic Policy Changed
Economic policy changed after the Great Recession. I believe that this resulted in a vast slowdown in the economic growth of the United States.
The primary focus of monetary policy that grew out of the Great Recession was that created by Fed Chairman Ben Bernanke, and it came to dominate the economic policy of the U.S. government in the 2010s.
Mr. Bernanke redirected the focus of monetary policy to financial assets rather than physical assets.
Mr. Bernanke wanted the Fed to, especially, get stock prices moving so as to create a “wealth effect” that would stimulate consumers to spend. But, the stimulation of stock prices also lit a fire under the price of many other assets like real estate and gold. The 2010s had lots and lots of asset price bubbles.
And, consumer spending was stimulated and the economy grew.
But, the economy’s growth was modest at best.
The stimulus came from the rise in asset prices. Sophisticated investors saw this and moved into asset markets rather than into things that resulted in the growth of labor productivity.
As I have written over and over again during the past ten years, this result was basically the culmination of the trends that had started in the 1960s. I referred to this approach to economic policy as “credit inflation.”
But, things really changed when Bernanke started to shift of monetary policy in this direction. And, Mr. Bernanke led the Federal Reserve through three rounds of quantitative easing before he left his post at the Fed.
Basically, when Mr. Bernanke left office, the commercial banking system was loaded with liquidity.
Fiscal Policy Follows
The federal government’s fiscal policy did not stand still…expenditures took off.
Federal Government Expenditures (Federal Reserve)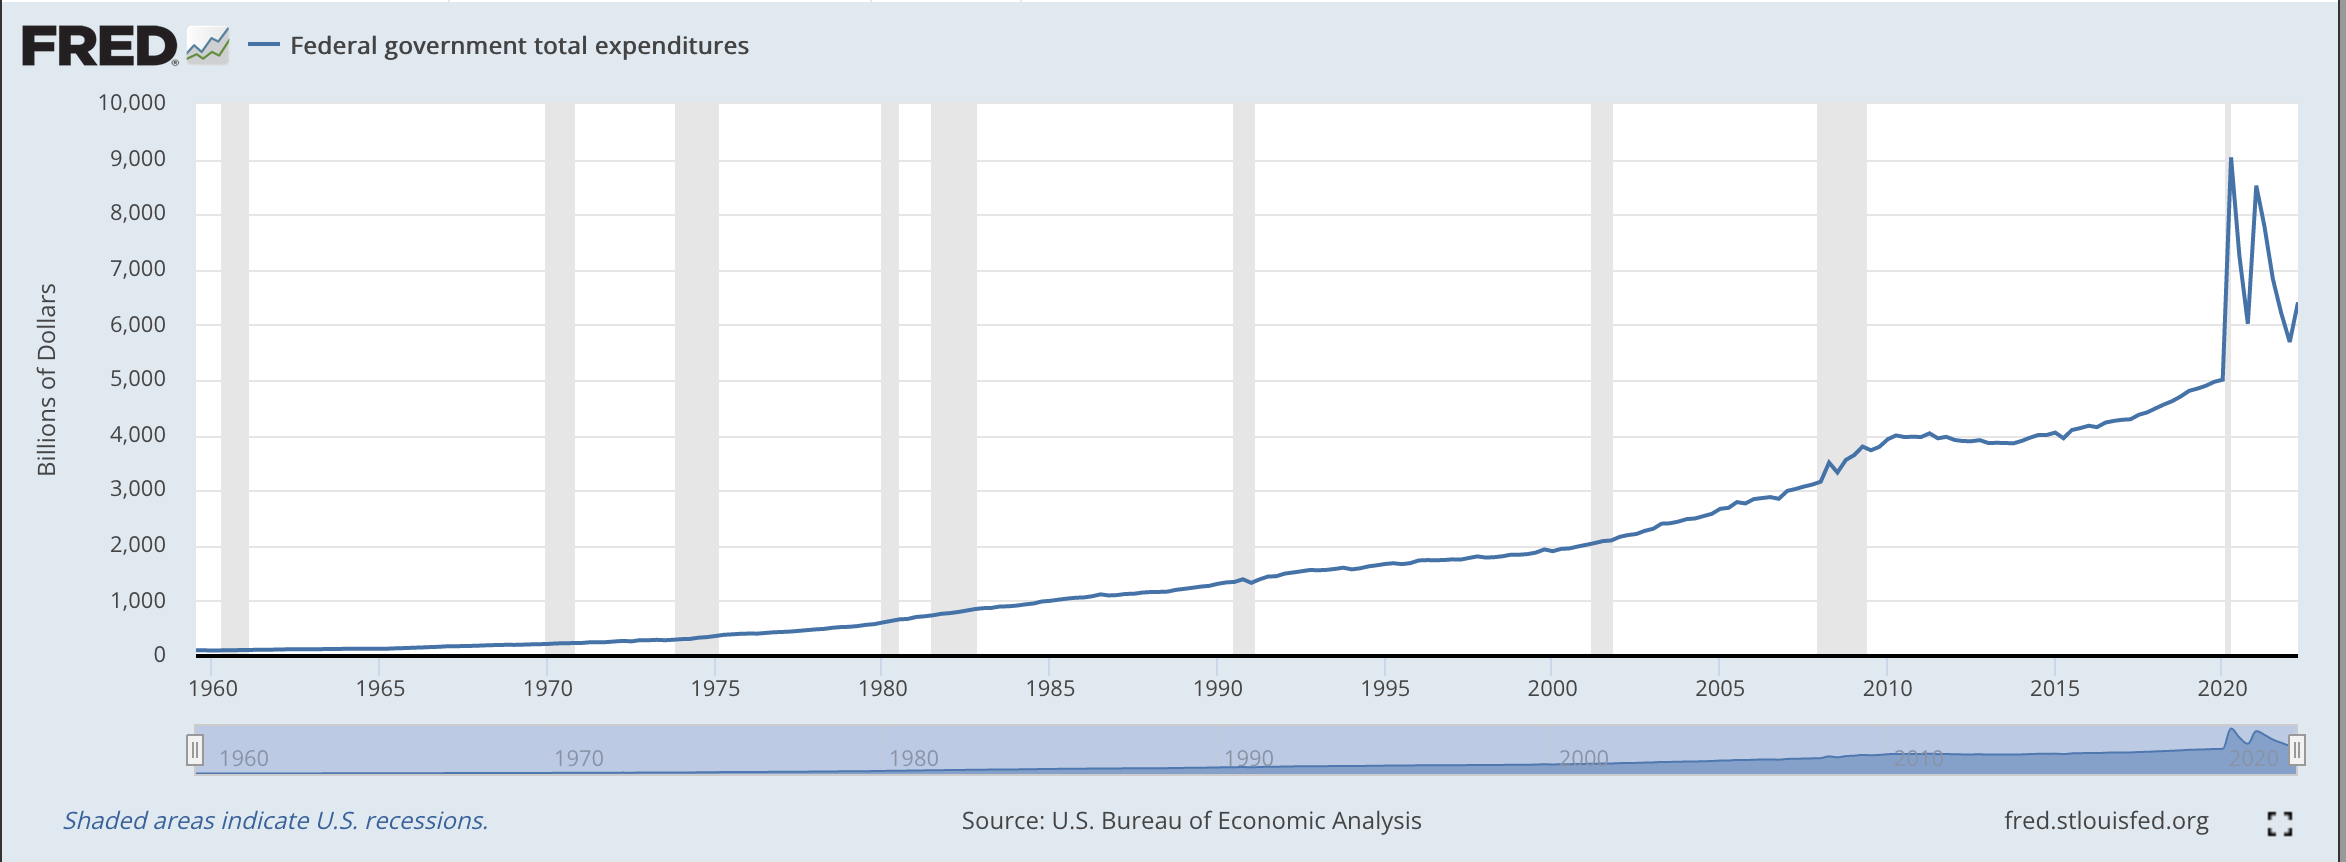
As one can see from this extended chart, federal government expenditures really took off during the period of the Great Recession, just as Mr. Bernanke was providing three rounds of quantitative easing.
The response of the federal government to the Covid-19 threat was enormous.
And, budget deficits grew. The debt load rose.
Total Federal Debt as Percent of GDP (Federal Reserve)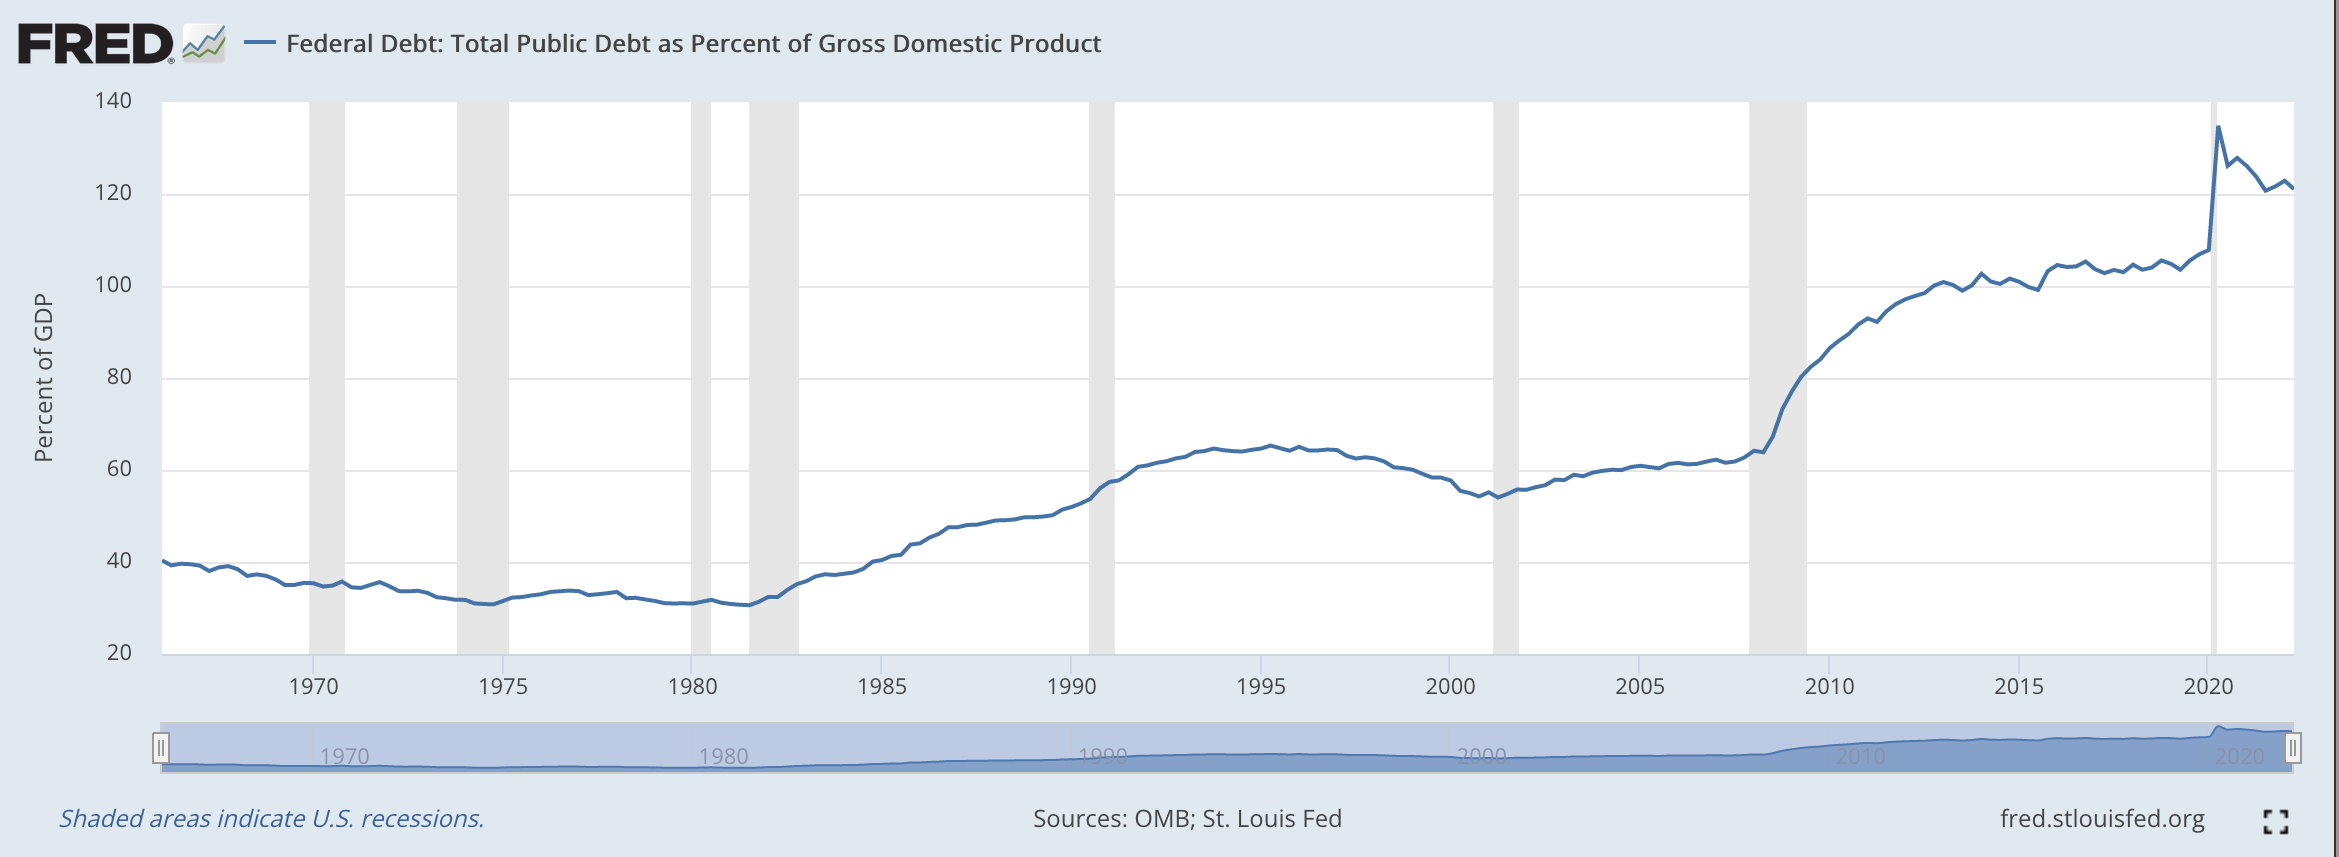
Note that the Total Federal Debt as a Percentage of Gross Domestic Product exploded during the Great Recession and then continued to increase throughout the following recovery.
In the 2020s, the percentage grew even more.
It seems as if the success in this growth in the debt resulted from the fact that, as explained above, more and more government stimulus money went into assets like stocks and bonds, and not into productive uses like real investment in physical capital for corporations.
In effect, sophisticated investors were after capital gains and not real returns on productive assets.
Backing this up, we see that income/wealth inequality grew tremendously during this fifteen-year period beginning with the Great Recession.
The Federal Reserve and the federal government were creating “capital gains” from the investment in assets, but they were not creating expanding participation to the rest of the economy through growing labor productivity, which contributes to rising real wages, and other overall returns within the economy that spread to all.
The primary beneficiaries were investors that benefitted from rising asset prices, but not from economic growth.
Have Times Changed?
Many analysts believe that the times have not changed. They keep expecting inflation to drop back to more reasonable levels. They expect the stock market to continue climbing. They expect that continued government spending will drive the economy forward rather than raise prices.
The test that these analysts give is that if the expected real growth of the economy is greater than the real cost of borrowing, then the deficit spending should continue.
The real cost of borrowing is defined as the nominal rate of interest less the actual rate of inflation.
Right now, the yield on the two-year U.S. Treasury note is 4.25 percent.
The latest inflation figures, as represented by the PCE price index, in August was 6.2 percent, year-over-year.
Thus, the real growth rate of the economy would have to be at least 4.25 percent to equal the “real” cost of borrowing.
To these analysts, then, the cost of borrowing is quite a bit less than the real return gained by real economic growth. Thus, the government spending MUST be worth going ahead with.
And, so the advice is to go ahead and continue to spend and create federal deficits.
What Happens?
Well, the debt burden grows and grows and grows.
Economic growth remains modest, at best, because investment is going into asset prices rather than productive capital.
And, the incumbent politicians continue to get reelected because of all the spending programs they are supporting that will, they argue, spur on the economy to greater growth.
This is a far way from what really works…balanced budgets and supply-side economic programs. Spend, spend, spend will not get you there.
But, more on this later.
Be the first to comment