

Caner CIFTCI/iStock via Getty Images
FTHI strategy and portfolio
The First Trust BuyWrite Income ETF (NASDAQ:FTHI) started operations on 1/6/2014. It has a portfolio of 152 stocks, a 12-month distribution rate of 8.6% and a total expense ratio of 0.85%. It pays monthly distributions.
As described by First Trust, “The Fund’s primary investment objective is to provide current income. The Fund’s secondary investment objective is to provide capital appreciation.” The fund invests in stocks listed on U.S. exchanges and sells call options on the S&P 500 Index to collect premiums that may be distributed to shareholders. The market value of the option strategy may be up to 20% of the Fund’s overall net asset value.
FTHI invests mostly in U.S.-based companies (92% of asset value). The heaviest sectors are technology (24.8%), healthcare (14.1%) and energy (12.2%). Other sectors are below 10%. Compared with the S&P 500 (SPY), FTHI significantly overweights energy and consumer staples. It underweights mostly industrials and financials. Other sectors are close to their weights in the broad index.
Sector breakdown ( Chart: author; data: Fidelity)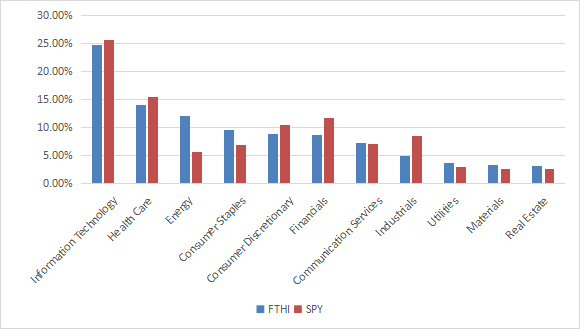
FTHI is cheaper than SPY regarding the usual valuation ratios, reported in the next table.
|
FTHI |
SPY |
|
|
Price/earnings TTM |
16.24 |
19.48 |
|
Price/book |
3.29 |
3.61 |
|
Price/sales |
1.9 |
2.31 |
|
Price/cash flow |
11.33 |
14.31 |
The top 10 companies, listed below with some growth and valuation metrics, represent 27.8% of asset value. For convenience, the 2 stock series of Alphabet are grouped together. The top 2 holdings (Apple and Microsoft) weigh 12% in aggregate. Exposure to risks related to any other individual company is quite low.
|
Ticker |
Name |
Weight |
EPS growth %TTM |
P/E TTM |
P/E fwd |
Yield% |
|
Apple, Inc. |
6.81% |
8.83 |
22.77 |
22.25 |
0.66 |
|
|
Microsoft Corp. |
5.37% |
3.73 |
24.56 |
23.95 |
1.19 |
|
|
Alphabet, Inc. |
3.44% |
-4.28 |
17.81 |
18.66 |
0 |
|
|
Amazon.com, Inc. |
2.57% |
-57.41 |
83.13 |
N/A |
0 |
|
|
Berkshire Hathaway, Inc. |
1.78% |
-88.96 |
57.88 |
20.32 |
0 |
|
|
Johnson & Johnson |
1.69% |
7.38 |
24.08 |
17.22 |
2.61 |
|
|
Tesla, Inc. |
1.63% |
214.34 |
60.89 |
48.16 |
0 |
|
|
Coca-Cola Europacific Partners PLC |
1.60% |
115.37 |
14.23 |
14.64 |
2.39 |
|
|
UnitedHealth Group, Inc. |
1.52% |
26.65 |
26.69 |
24.77 |
1.21 |
|
|
Cal-Maine Foods, Inc. |
1.40% |
7662.72 |
10.49 |
7.60 |
5.76 |
Historical performance
The next table compares FTHI since inception in January 2014 with 3 other ETFs implementing buy-write strategies (buying stocks and selling call options): the Global X NASDAQ 100 Covered Call ETF (QYLD), the Global X S&P 500 Covered Call ETF (XYLD) and the Invesco S&P 500 BuyWrite ETF (PBP). FTHI is neither the best nor the worst of this group. The 4 buy-write ETFs have lagged the equity benchmark SPY by a wide margin (distributions are included and reinvested).
|
Total Return |
Annual Return |
Drawdown |
Sharpe ratio |
Volatility |
|
|
FTHI |
48.40% |
4.58% |
-32.81% |
0.39 |
12.64% |
|
QYLD |
58.53% |
5.36% |
-26.48% |
0.43 |
12.39% |
|
XYLD |
56.25% |
5.19% |
-34.01% |
0.43 |
12.48% |
|
PBP |
35.84% |
3.53% |
-31.85% |
0.32 |
11.11% |
|
SPY |
142.98% |
10.59% |
-32.05% |
0.74 |
14.95% |
In 2022, FTHI has beaten SPY and its competitors (next chart).
FTHI vs. 3 competitors and SPY in 2022 (Portfolio123 )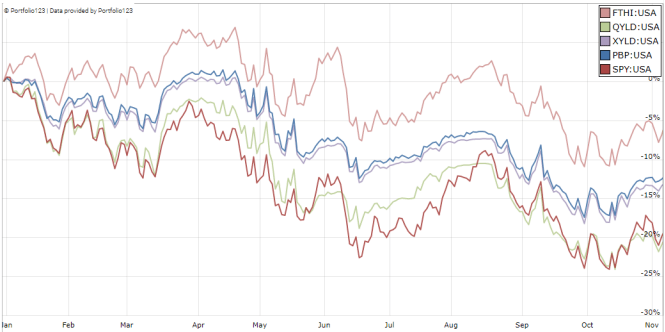
The chart below plots FTHI share price (without dividend): it is close to break-even since inception (-2.4%). There was no sizable capital decay, at least before accounting for inflation. However, the fund has failed to meet its secondary objective of capital appreciation.
FTHI share price without dividends (Portfolio123)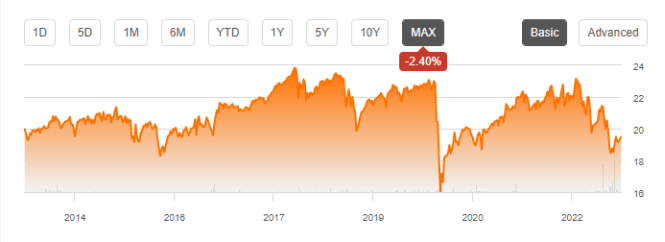
FTHI distributions may vary depending on option premium collection, therefore on market conditions. It seems the management tries to keep them as constant as possible: they were stable at $0.08 per month between 2015 and 2021. They jumped to an average of $0.15 in 2022. It may be good news for investors who had the fund in their portfolios, or a bad one for those who expect a distribution rate of 8% or more in the future. It is likely to revert to the mean in some measure.
Takeaway
FTHI has a portfolio of 152 stocks with a sector composition quite close to the S&P 500. It seeks to generate income by selling call options on the large cap index. It has done very well relative to its peers in 2022. It also beats the S&P 500 in total return year-to-date, but lags it by a wide margin since inception. Distribution history shows that the current yield is exceptional, and probably unsustainable. Distributions in 2022 have probably been boosted by unusual gains from the option strategy. Excluding this year’s distributions, income stream has been stable and share price is almost at break-even since inception. It is much better than many high-yield funds, which have lost on both sides. However, it is a decay in inflation-adjusted capital and income.
Bonus: How to avoid decay and deal with inflation with high-yield securities
Capital and income decay is a structural issue in many high-yield instruments, including closed-end funds. However, it is not inexorable if one knows how to trade CEFs instead of using them as buy-and-hold instruments. I designed a 5-factor ranking system statistically related to forward returns across the full CEF universe, and started publishing the 8 best-ranked liquid CEFs in Quantitative Risk & Value (QRV) after the March 2020 market meltdown. The list is updated every week. Its average dividend yield varies around 7-8%. It is not a model portfolio: trading the list every week is too costly in spreads and slippage. Its purpose is helping income investors find funds with a good entry point. In the table and chart below, I give the hypothetical example of starting a portfolio on 3/25/2020 with my initial “Best 8 Ranked CEFs” list and updating it every 3 months since then, ignoring intermediate updates to limit transaction costs. Returns are calculated with holdings initially in equal weights without rebalancing until the next 3-month update. Dividends are reinvested at the beginning of every 3-month period.
|
since 3/25/2020 |
Total Return |
Annual Return |
Drawdown |
Sharpe ratio |
Volatility |
|
Best 8 CEFs quarterly |
127.90% |
36.94% |
-20.60% |
1.52 |
20.50% |
|
FPE |
21.90% |
7.85% |
-17.10% |
0.41 |
9.28% |
|
SPY |
59.55% |
19.52% |
-26.29% |
0.96 |
18.79% |
|
LQD |
-7.98% |
-3.13% |
-25.44% |
-0.55 |
9.59% |
This simulation is not a real portfolio and not a guarantee of future return (Data calculated with Portfolio123)
The usual disclaimer says that past performance (real or simulated) is not representative of future return. To be honest, the “Best 8” list is unlikely to perform as well in the near future as since March 2020. The 2020 meltdown and recovery resulted in price dislocation and exceptional opportunities in the CEF universe. The 2022 downturn was also a source of opportunities in energy and infrastructure funds. This is unlikely to be reproducible in the near future. However, I think a discount-driven rotational strategy in CEFs has a much better chance to protect both capital and income stream against erosion and inflation than any high-yield passive investment like FTHI. Dates and lists can be checked in QRV post history.
Be the first to comment