

peshkov
The FinVolution Group (NYSE:FINV) is a Chinese online lending platform and a competitor of our portfolio holding 360 DigiTech, Inc. (QFIN). We see three main reasons for these shares to be attractive here:
- The regulatory onslaught on internet companies in China seems to have run its course, at least for now;
- China is in a very different monetary regime, policy is loosening rather than tightening; and
- Chinese ADR valuations in general, and those of the likes of FINV and QFIN in particular, have sunk to very deep depths, we think there is scope for valuation multiple expansion.
There are some additional reasons to be bullish:
- The company touts operating margins of 25%.
- The company has a very solid balance sheet.
- The company is buying back shares and touts a dividend yield of 4.5%.
It’s not all good news. There are some bumps in the form of the Chinese lockdowns (concentrated in Q2) and a tough macro environment, but so far FINV has been able to deal with these pretty well.
FinViz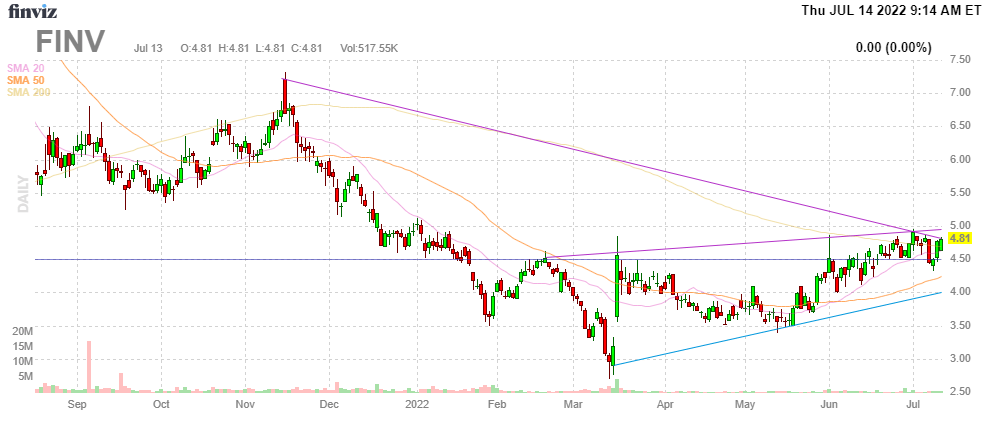
Regulatory impact
The regulatory wave seems to have blown over, at least for now, as the Covid-19 lockdowns endanger growth targets forcing authorities to abandon any further regulatory initiatives, which have taken valuation of internet companies to extreme depths.
The main regulation impacting the company is the internal rate of return (“IRR”) 24% ceiling, and the company has made great progress towards that with loans with IRR below 24% at 84% in Q1, up from 78% in Q4/21 and 14% Q1/21.
Borrowing cost was at 24.3% versus 26.7% in Q1/21. On its own, this would decrease the company’s take rate but there are three offsets:
- A shift towards better quality customers
- A reduction in funding cost
- Technological improvements
Indeed, customers in the A&B category rose to 68% in Q1 from 50% in Q1/21. While funding cost was stable at 7.8% in Q1, management expects this to decline by 30-50bp in H2 as a result of new financial partners.
The company prides itself on the strength of its machine learning capabilities of the platform (Q1CC):
Platform [indiscernible] is an algorithm learning system, which combines automatic model design, deployment and management into a one step platform that requires just 100 seconds to acquire relevant resources and implement a new model for our credit risk assessment. Increasing our efficiency tremendously, [indiscernible] enables us to swiftly make efficient and appropriate adjustments on complex and iterative operating rules saving us over 50% in both maintenance cost and time.
As a result, approval rates from funding partners have “improved greatly” leading to greatly improved operating efficiency (Q1CC)
These metrics actually improved from 60% to 76% on a year-on-year basis.
We have to admit that it’s not entirely clear (at least to us) what metrics they are referring to here.
FVIN earnings deck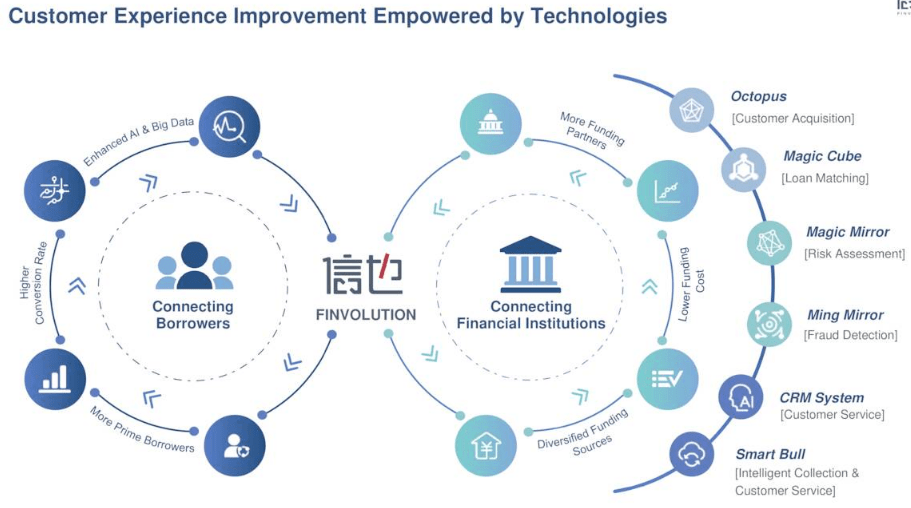
In any case, the upshot is that their take rate was stable at 3.9%, which is a good performance as we saw a decline in the take rate at 360 DigiTech as a result of the same forces (mainly the IRR 24% ceiling).
It does have a much smaller fraction of capital-light (providing multiple types of risk assessment, rather than assuming credit risk) at just 21% of revenue, while QFIN boasts capital-light at over half of transaction volume.
FVIN earnings deck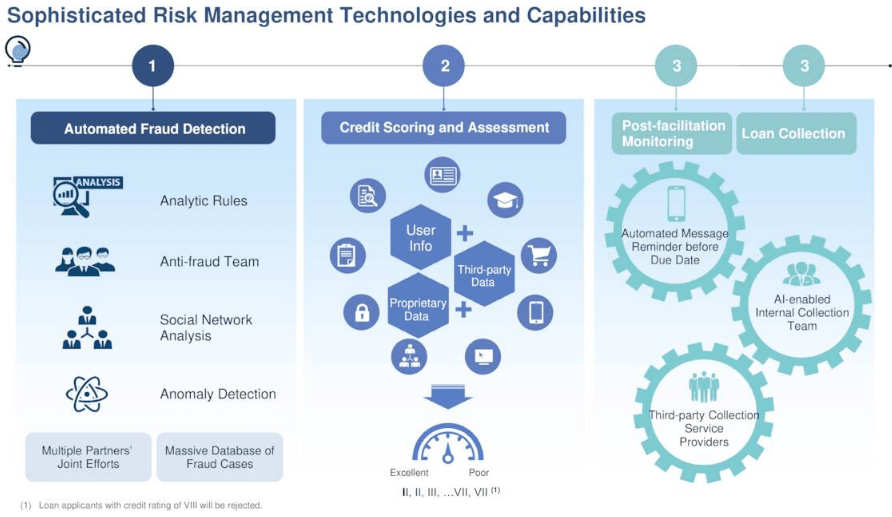
Funding
The company has two loan funding channels:
- Direct lending by financial partner institutions like commercial banks and consumer credit institutions.
- Trust arrangement model in which investors combine with trust management companies to offer finance. The company can participate, but the investors are guaranteed a fixed return (the senior tranches) while the company gets the residue (junior tranches) and a service fee.
The company deals with credit risk through various means. They have a 600+ people collection team that handles collections of delinquencies up to 90 days, after which it is usually transferred to a third-party payment collection service. In case loans can’t be fully recovered, there are various backup means through engaging with:
- Third-party financing guarantee companies
- Third-party insurance companies
- Investor reserve fund.
With respect to these (10-K):
After the guarantee company repays the full overdue amount, we will be obligated to purchase creditor’s right from the third-party guarantee companies at a price equal to the repayment it made to the institutional funding partner. Under certain circumstances, we also provide security deposits to third-party financing guarantee companies for loans funded by certain institutional funding partners as an additional quality assurance commitment… In some cases, if the overdue amount exceeds insurance coverage, the remaining overdue amount will be repaid by a third-party guarantee companies engaged by us.
They also have a QAF or quality assurance fund, partnering with Sino Guarantee. Borrowers have to contribute to the fund. Repayments for delinquencies are made from the fund.
Then there is an investor reserve fund which works similarly.
Customer acquisition channels
The company has multiple customer acquisition channels which occur mostly through marketing on social media:
FVIN earnings deck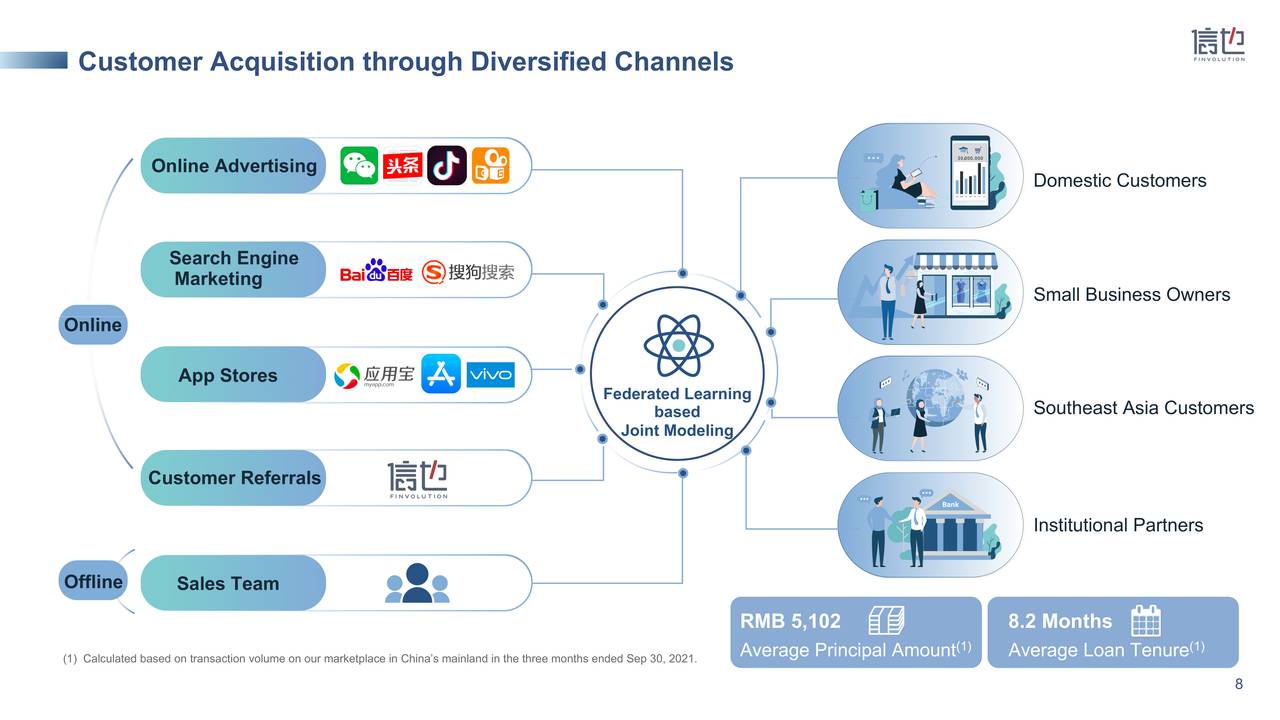
They have an offline customer acquisition team of 700+ employees and this is expected to reach 1000 by the end of the year (2021). Marketing can be expanded, curtailed and targeted at will, providing flexibility to deal with different circumstances, increasing loan quality (which it is doing at present) or decreasing loan volumes to prevent delinquencies from ratcheting up during lean times.
Income sources
- Loan facilitation service fees
- Post-loan facilitation service fees
- Guarantee income
- Interest income
- Other revenue
The guarantee income fee (10-K):
Liabilities of quality assurance commitment are released as guarantee income systematically over the term of the loans subject to quality assurance commitment due to our adoption of ASC 326, Measurement of Credit Losses on Financial Instruments, on January 1, 2020.
On other revenue (10-K):
Other revenue mainly includes collection fees charged to borrowers, management fees charged to investors who subscribe to investment programs that invest in loans protected by the quality assurance fund, customer referral fees and services fees charged to investors for selling loans over our secondary loan market.
Lockdowns
Q2 will be the quarter of lockdowns, and this was stressed by the fact that management had to call in from home at the Q1CC. Q2 will bear the brunt of the lockdowns.
Something of that was visible in a slight uptick in day one delinquency rate to 5.5% in May, from 5.3% in Q1. But it is still lower than Q4/21 at 5.6%, so no cause for alarm. Management took measures (Q1CC):
The impact of the pandemic is manageable for us as we have been implementing preemptive measures such as strategically reducing loan transactions in riskier regions and [pricing] (PH) the approval rate for sectors such as food and beverage, which have been badly affected by the prolonged lockdown.
Their shift towards higher-quality customers is also helping to mitigate risks and their customer service team is providing assistance to borrowers who lost their short-term payment capabilities, tying them over.
But since most of the lockdowns are already over, this seems a temporary issue, although the risk is of course for lockdowns to make a comeback.
Finances
The days of hyper growth are over as the market matures and regulations have taken a bite:
FINV earnings deck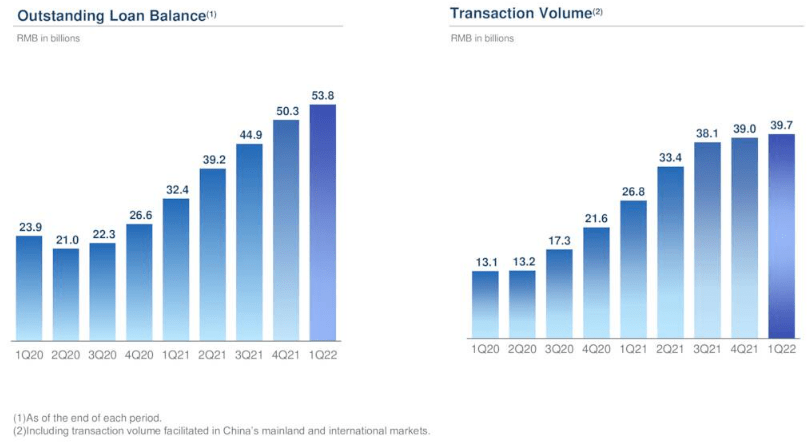
Some other metrics:
- Revenue +16% y/y to RMB2.4B
- Non-GAAP operating profit RMB602M (25% operating margin)
- SME loan growth 507K SME’s served in Q1 (+66% y/y) with transaction volume +123% y/y to RMB9.8B (25% of total transaction volume)
- International expansion: RMB0.86B (+13% y/y), outstanding loan balance RMB 0.36B +44% y/y and +9% q/q
- Unrestricted cash RMB6.3B up from RMB5.6B at the end of Q4/21
The company is very profitable still:
FINV earnings deck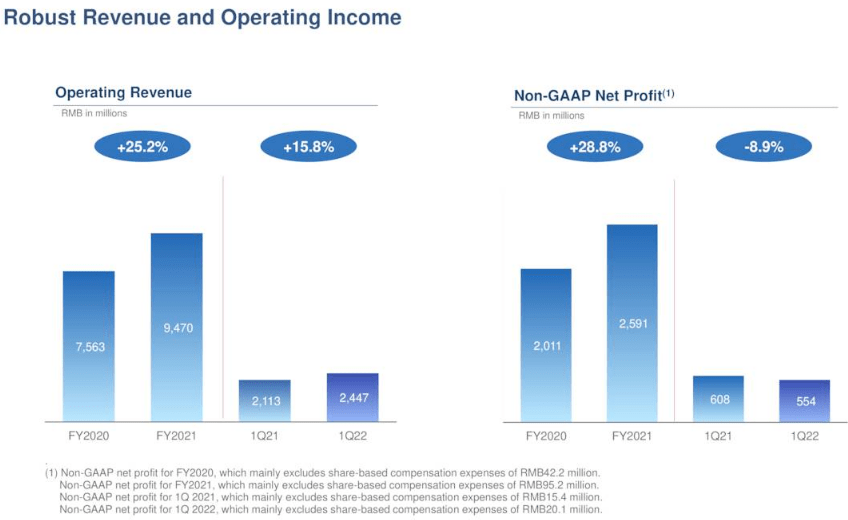
The company also produced a very useful slide with unit economics:
FINV earnings deck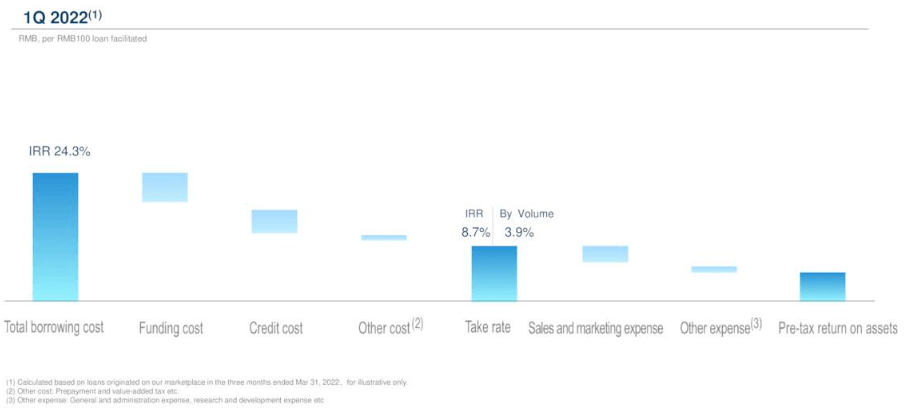
And the company touts a strong balance sheet:
FINV earnings deck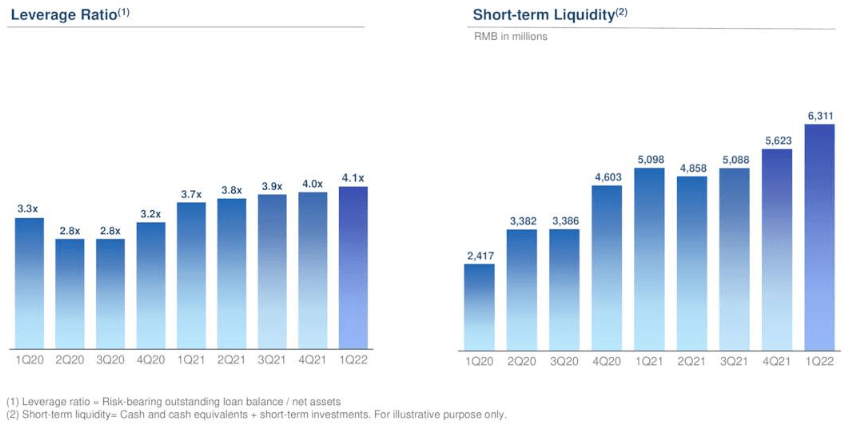
Although we have to say that footnote 2 slightly unnerves us with its “for illustrative purposes only.”
The company does return quite a bit of value to shareholders:
FINV earnings deck
International expansion
FINV earnings deck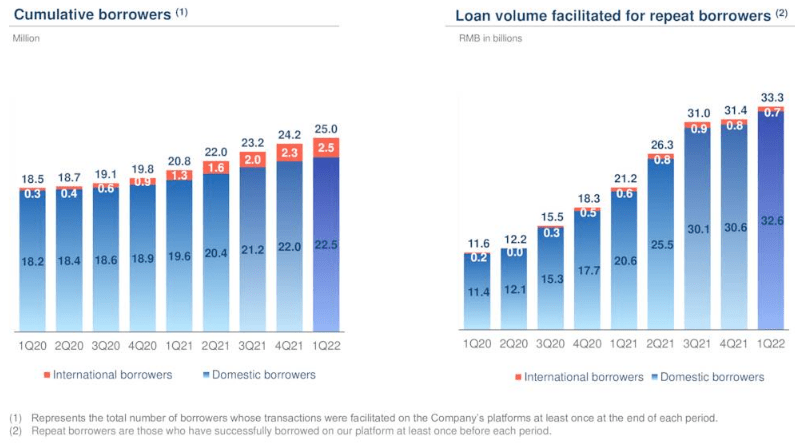
The interesting part here is the orange bits, which stand for international revenue as the company has been fostering abroad into Southeast Asia countries like in the Philippines, Indonesia, Vietnam, and Singapore.
Overseas growth here was just 13% y/y with transaction volume reaching RMB860M, still pretty insignificant in the bigger picture. Overseas loan balance grew 44%, although also still very small at RMB360M.
The company typically enters the market through an easier product to shift towards higher quality products and borrowers when they have established a firm beachhead and partner infrastructure, replicating its Chinese strategy. These markets are of considerable size, especially when taken together (Q3CC):
Indonesia, Philippines and Vietnam has a combined population of around 500 million. It is higher than the U.S. population, and it is not small compared to China. And its loan to GDP ratio is about 8.3% with a low credit card penetration rate of between 3% to 4%. And when compared with China, these countries have huge opportunities.
In addition to our facilitation business, we teamed up with local e-commerce and e-wallet partners, such as JD Indonesia, and DANA to launch operations in the Buy-Now-Pay-Later sector.
Valuation
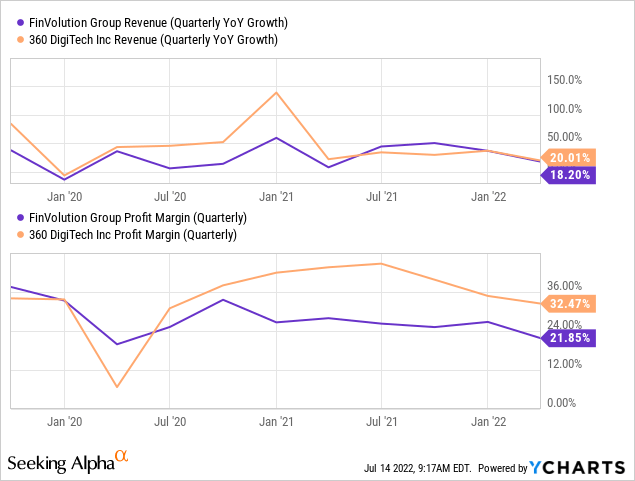
It isn’t a surprise that the valuation metrics are deep into silly territory with analysts expecting an EPS of $1.22 this year rising to $1.39 in 2023 giving the shares an earnings multiple of less than 4x.
Comparing FINV with QFIN shows that revenue growth is comparable but QFIN is considerably more profitable. We think this is related to the much larger capital-light business of QFIN, which has the additional benefit of limiting its credit exposure. QFIN shares sell for the same silly earnings multiples well under 4x.
Both also have an iron-clad balance sheet and generate plenty of cash to be able to pay a considerable dividend, with FINV yielding 5.5% and QFIN slightly less at 5%.
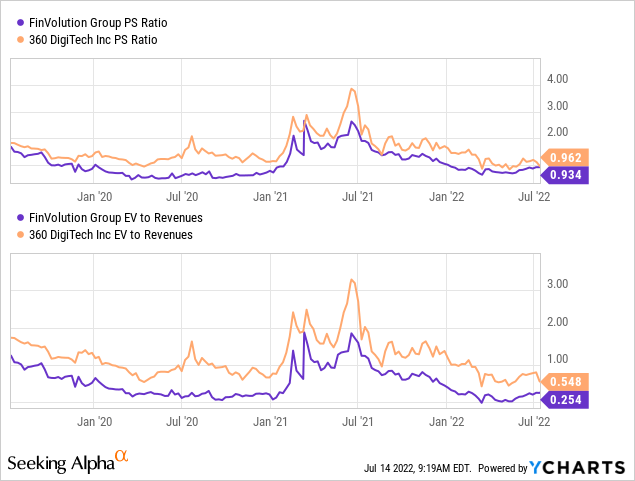
On the other hand, on an EV/S basis FINV is quite a bit cheaper, basically because it has more cash and equivalents ($1.89 per share versus QFIN $6.57 per share). But it needs more reserves as it has more credit exposure.
Conclusion
While growth has come down considerably as the company is bigger and the market more mature, there is still a good 15-20% growth possible even considering the macro headwinds.
Profitability isn’t going to rise much as the interest rate ceiling took a bit of a bite, but with a 25% operating margin, the company produces plenty of profits and cash to pay a lush dividend.
We have a slight preference for QFIN due to its much larger capital-light business which makes it more profitable and less exposed to credit risk, but both shares sell at ridiculous multiples.
With the Chinese regulatory zeal over for the time being as growth concerns have taken over, with valuations on the floor or below, and with China being in a very different monetary cycle compared to the rest of the world, we think there is room for a valuation multiple expansion here, even if it isn’t likely to happen overnight.
Be the first to comment