

The sector was due for some rescuing. emmepiphoto/iStock via Getty Images
Get ready for charts, images, and tables because they are better than words. The ratings and outlooks we highlight here come after Scott Kennedy’s weekly updates in the REIT Forum. Your continued feedback is greatly appreciated, so please leave a comment with suggestions.
It’s been a terrible year for mortgage REITs. They went from being loved in 2021 to being thrown in the dumpster in 2022. Some of the decline for this sector is warranted as book values were thoroughly smashed. Some of the decline is not warranted, as share prices fell dramatically further than the value of the underlying portfolio. However, there has been some good news. Mortgage REITs recognized it investors were concerned about their viability and responded by providing some early updates on book value. That’s been a great choice. For many, the reported values were very close to our expectations. However, a report from MFA Financial (MFA) and another report from AG Mortgage Investment Trust (MITT) provided some positive surprises.
The positive news is that while book values are certainly down, they were not hammered as much as expected.
MFA announced GAAP BV between $15.25 and $15.40 per share (down 6.7% at the midpoint) along with economic BV between $15.75 and $15.90 per share (down 8.3% at the midpoint). As someone who owns shares of MFA, that’s great to hear. Given the difficulty of Q3 2022, those losses are not that large. To put this in perspective, MFA’s share price ended Q2 2022 at $10.75 and ended Q3 2022 at $7.78. That’s down 27.6% in the quarter.
MITT announced book value in the range of $10.97 to $11.07 (down 4% at the midpoint). Adjusted book value, which I find more useful, was in the range of $10.63 to $10.73 (down 4.2% at the midpoint). The difference here is that adjusted book value forces the preferred shares to be valued at $25.00, rather than valued using the net proceeds from offering the shares. In some cases that might be a rounding error, but it is material in this case. While MITT only lost about 4.2% of their adjusted book value, shares plunged from $6.75 to $4.11 from the end of Q2 2022 to the end of Q3 2022. That was down 39.1%.
With those announcements last night, it’s no surprise that MITT and MFA are the best two performing mortgage REITs today:
Seeking Alpha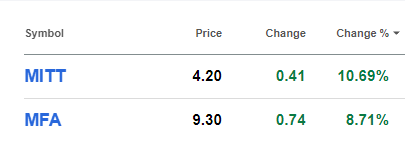
Note: Those prices dipped a bit while writing this article.
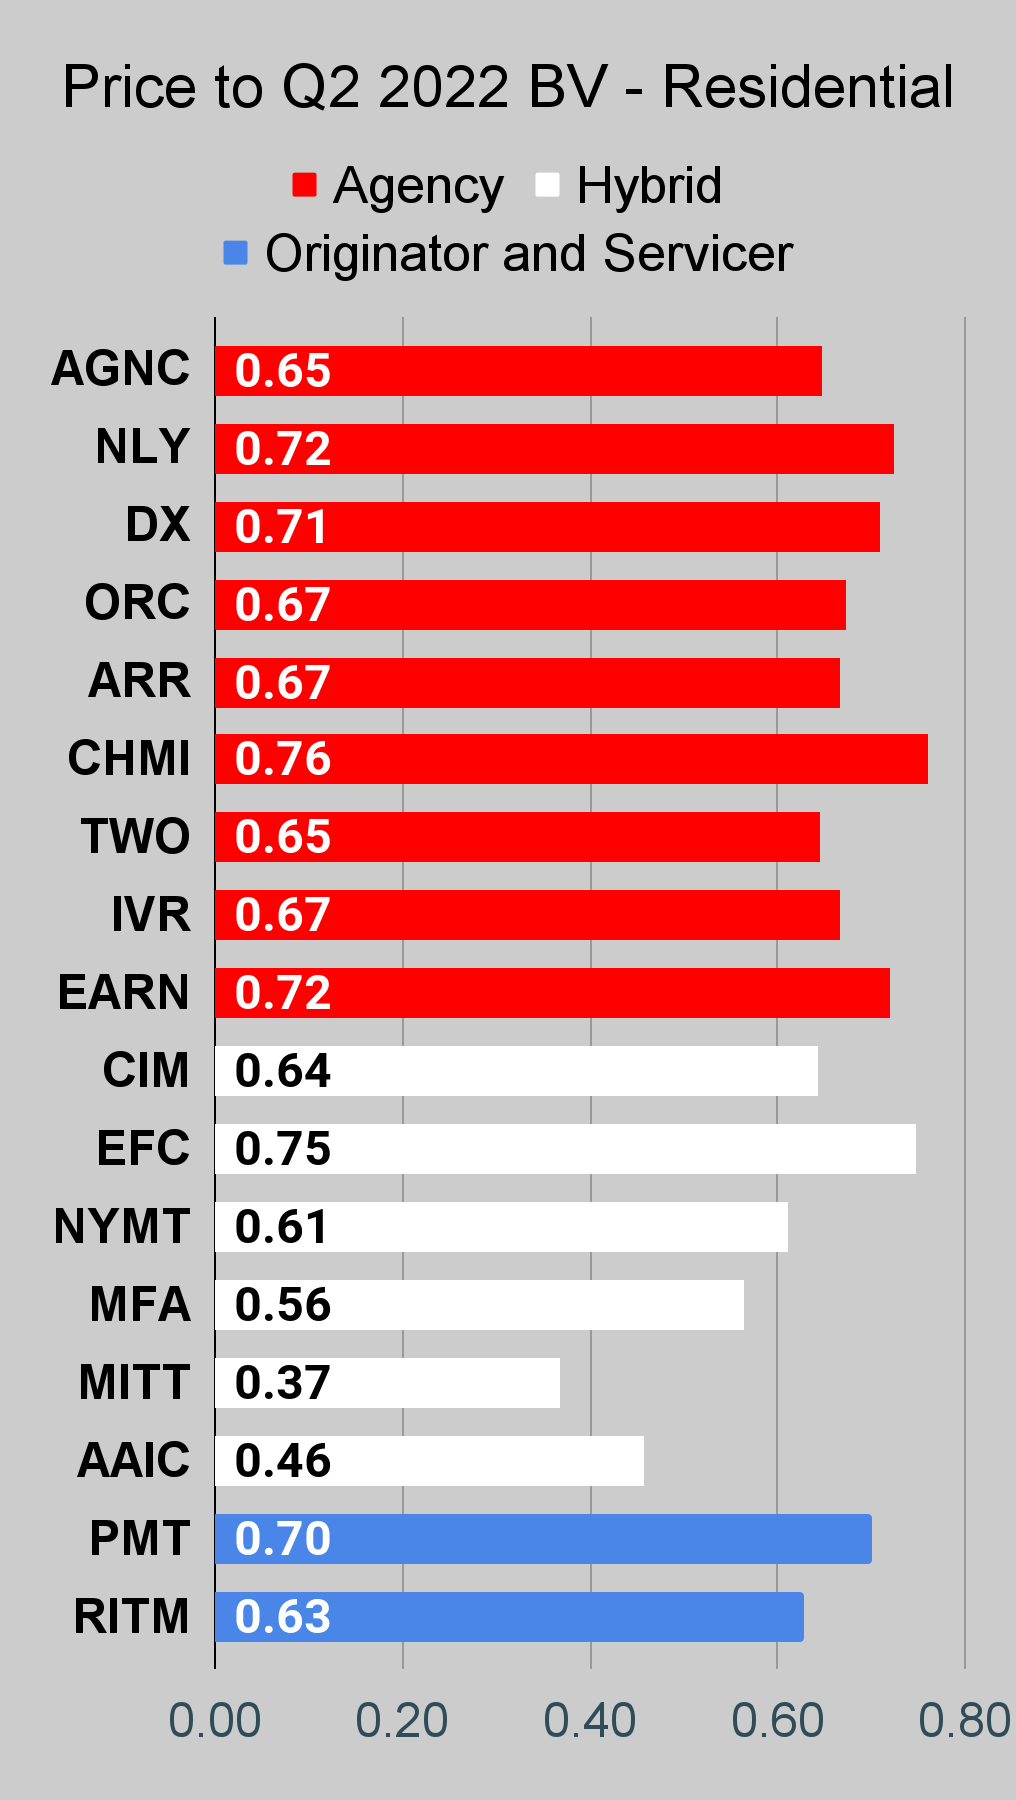
The charts we use in this article will still be showing discount to Q2 2022 book value for a bit. However, as more reports come out I’ll introduce an extra set of charts so investors can also see discounts to Q3 2022 book values for those that have reported. It would be unwise to compare discounts to Q2 2022 book value for one REIT against a discount to Q3 2022 book value for another REIT. Therefore, they must be on separate charts. As always, our ratings and subscriber pages will utilize discounts to estimated current book value.
Due to these stronger than expected results, we’ve already updated our estimates for this week and adjusted targets accordingly.
Scott Kennedy provided more detailed analysis for subscribers on The REIT Forum. Members can find it in a special chat room called “The REIT Forum: Earnings”.
For instance, I’m including a portion of Scott’s note on MFA:
Unfortunately, MFA did not provide any leverage ratio updates. I anticipate MFA’s leverage slightly-modestly increased during the third quarter of 2022. That said, MFA did provide some funding metrics. As of 9/30/2022, 99% of MFA’s $7.3 billion of asset-based financing was either fixed-rate debt or variable-rate debt that was directly hedged with interest rate payer swaps (hence combating the variable-rate nature of that portion of debt). As of 9/30/2022, 71% of MFA’s asset-based financing was “non-mark-to-market”. This simply means financing counterparties do not have a daily/weekly margin call provision based on the underlying fair market value (“FMV”) of the assets held as collateral. However, that would also calculate to 29% of MFA’s asset-based financing having said FMV margin call provisions in place at quarter-end. Technically, this could lead to counterparty margin calls if certain asset price declines/thresholds were triggered (exact percentages/debt covenants would vary from agreement to agreement).
Case-in-point, MFA is the 1st mREIT peer this quarterly cycle to acknowledge there was some margin call activity during the third quarter of 2022. This was anticipated on my/our end with some of the hybrid mREIT peers (and a few of the underperforming agency mREITs). However, MFA points out this margin call activity, from both mortgage-related assets and hedges, actually resulted in a net increase in cash. This simply means, when factoring in “haircuts”, MFA was able to sell the attached collateral at a price greater than the underlying debt originally assumed. This actually likely led to some of MFA’s BV outperformance, when compared to my projection, since the value of the company’s recently sold mortgage-related investments would have been valued at a lower price/multiple if management “held onto” said investments through quarter-end (as price decrease became more severe towards the end of the quarter). So, a bit of a “give-and-take” with this event.
MFA maintained a proportionately large amount of cash, cash equivalents, and unencumbered assets as of 9/30/2022. More specifically, $435 million of unrestricted cash and ~$550 million of unencumbered mortgage-related investments. Simply put, similar to various other sector peers, a nice “cushion”.
Scott writes notes like that for most of the stocks he covers. That also includes recent notes on MITT, NYMT, TWO, ORC, ARR, NLY, AGNC, and DX as each has provided some early data for investors. There will be several more updates to follow.
We continue to find several attractive opportunities within the sector. While the third quarter was yet another particularly rough quarter for mortgage REITs, many have been positioning themselves to reduce losses. As bad as it may sound to lose 4.2% or 8.3% in value, those declines are still partially offset by the dividends. That doesn’t make it easy to deal with declining values, but it does soften the blow. Factoring in the dividend, MFA’s economic BV would only be down 5.71% and MITT’s adjusted BV would be down 2.33%.
For comparison, including dividends an investor in the iShares 20+ Year Treasury Bond ETF (TLT) would be down 10.28% and an investor in the SPDR S&P 500 ETF (SPY) would be down 4.93%.
So while the share prices for MFA and MITT were thoroughly smashed during the quarter, the actual performance of the underlying portfolio wasn’t nearly so bad.
Contrary to popular opinion, management’s primary job is to maximize the performance of the underlying portfolio. It is the underlying portfolio that generates cash for dividends and justifies the value of the stock. While investors want to see higher share prices, that is not the job of management on a day-to-day basis. Management should seek to maximize returns for shareholders and if the share price remains depressed for years, then they should look at alternative ways to unlock value.
The primary incentive to push price-to-book ratios higher today is simply to reduce volatility and demonstrate a higher average price-to-book ratio.
It’s a good choice by management in each REIT to provide these metrics early as it reassures investors. That reassurance can also increase price-to-book ratios. Given the magnitude of the discounts to book, that’s a wise goal and it could push some prices quite a bit higher. Doing this doesn’t hurt future returns, unless you assume future returns would be fueled by buybacks. That’s a topic for another article. A good article though, and one I plan on writing.
Outlooks
Despite MITT and MFA putting together huge rallies today, we’re still bullish on both of them. The positive surprise in their earnings release justified a substantial rally in the share price.
Two more REITs we need to mention are Rithm Capital Corp. (RITM) and Ready Capital (RC). Neither RITM nor RC has previewed their Q3 2022 earnings yet. They might do that at any point, but I’m writing this before the market closes on 10/18/2022. We see both of those REITs as being severely undervalued.
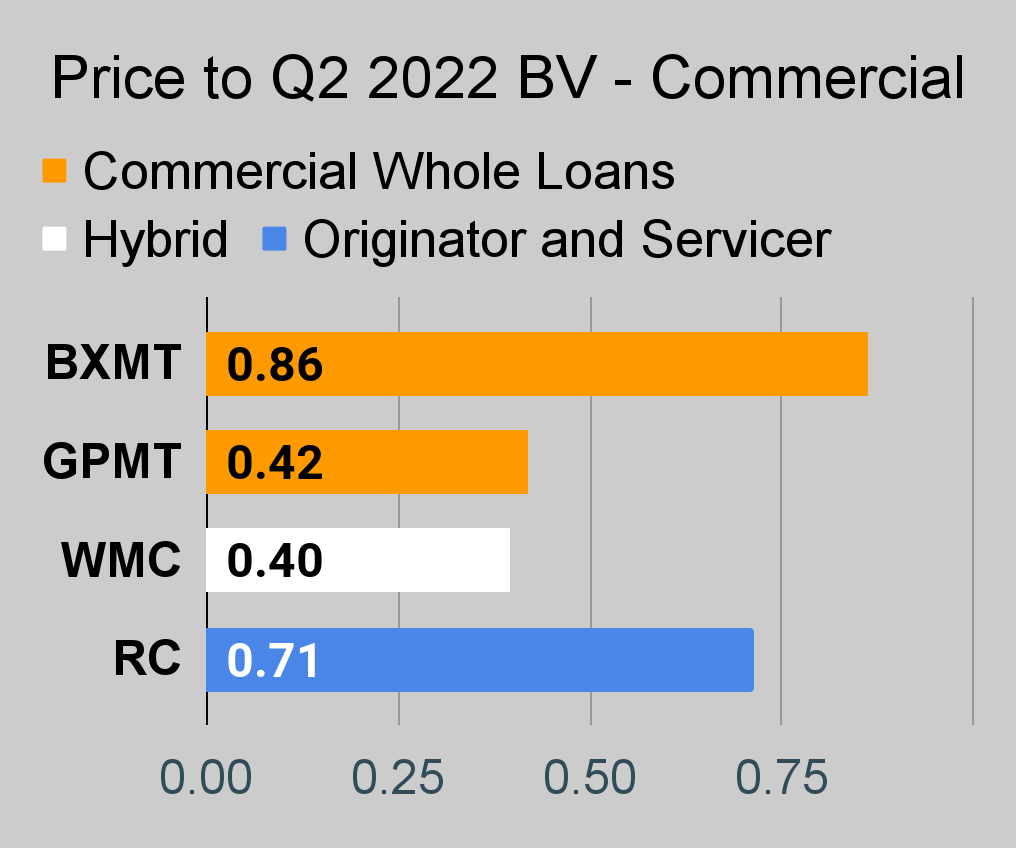
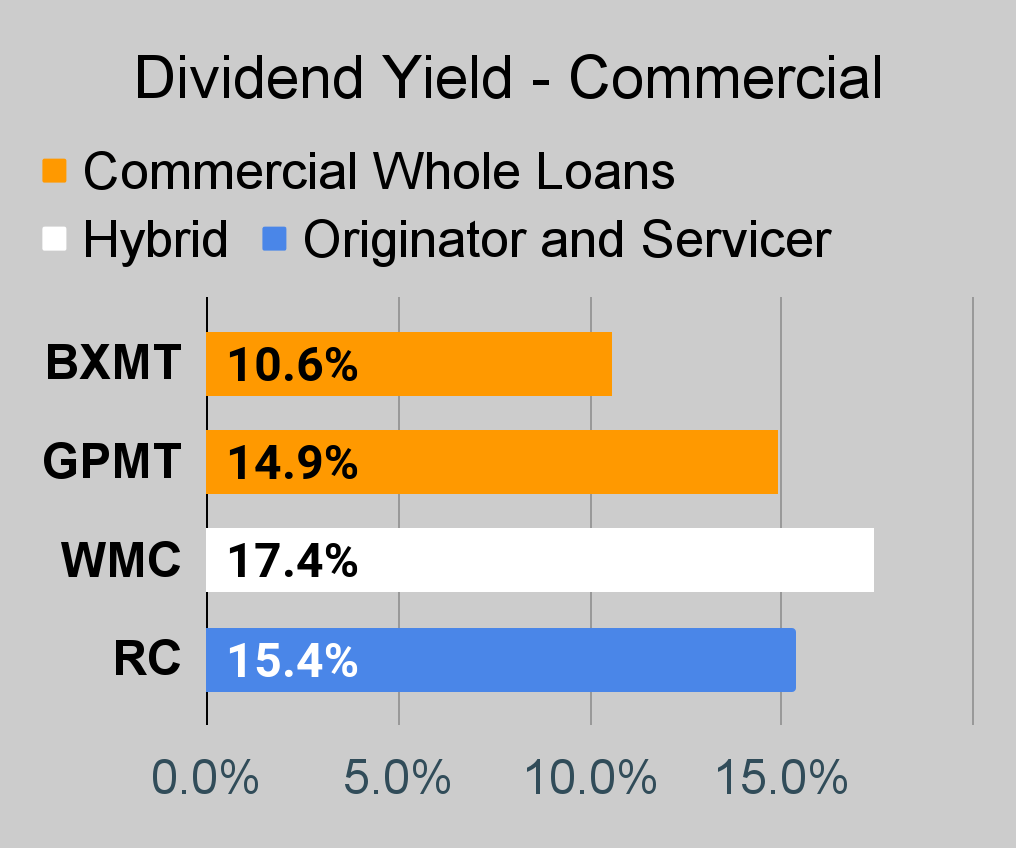
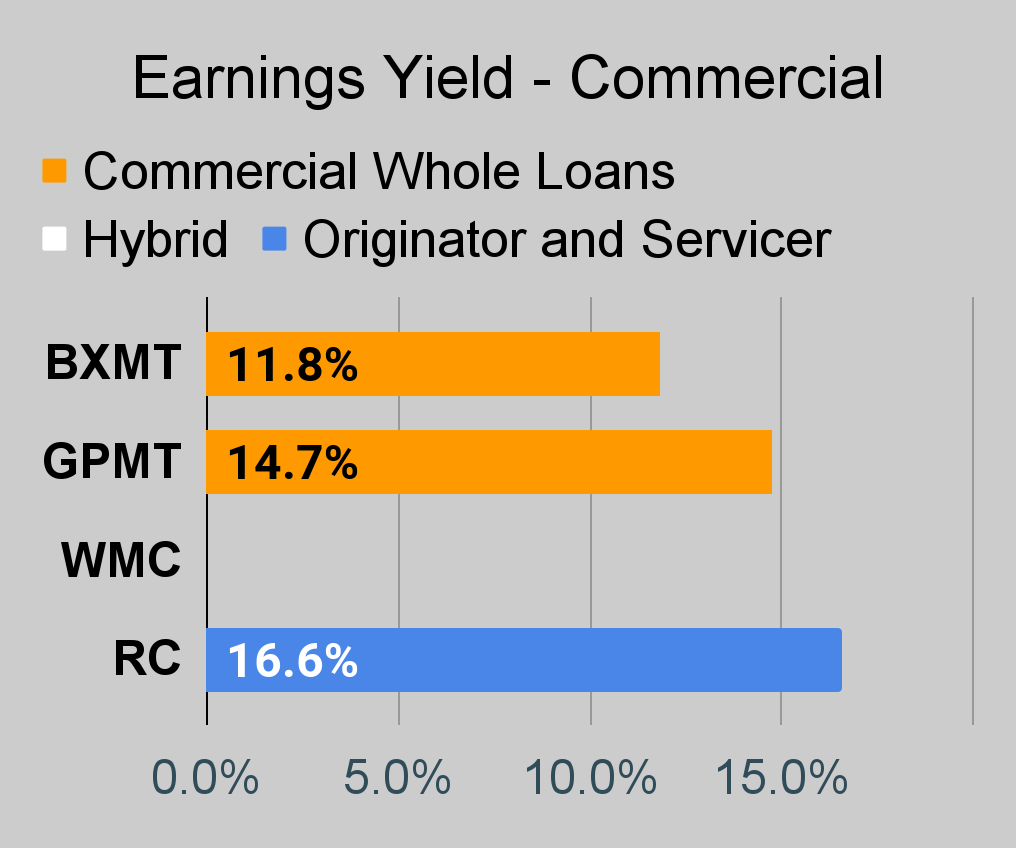
However, I’m going to add two more REITs to the list. This time it is commercial REITs. Blackstone Mortgage Trust (BXMT) and Granite Point Mortgage Trust (GPMT) are both within our bullish ranges as well. BXMT has one of the higher price-to-book ratios for the sector (using our estimates), but they also have a great history of performance. On the opposite end of the spectrum, Granite Point Mortgage Trust tends to deliver less impressive results but trades at a staggering discount to book value (creating far more upside).
Out of those 6 common shares, we are long MFA, RITM, RC, and GPMT. However, I should note that the size of the allocations is materially different.
The rest of the charts in this article may be self-explanatory to some investors. However, if you’d like to know more about them, you’re encouraged to see our notes for the series. The part below is reproduced in each article to provide investors with easy access to the updated charts. It is my gift to readers.
Stock Table
We will close out the rest of the article with the tables and charts we provide for readers to help them track the sector for both common shares and preferred shares.
We’re including a quick table for the common shares that will be shown in our tables:
Let the images begin!
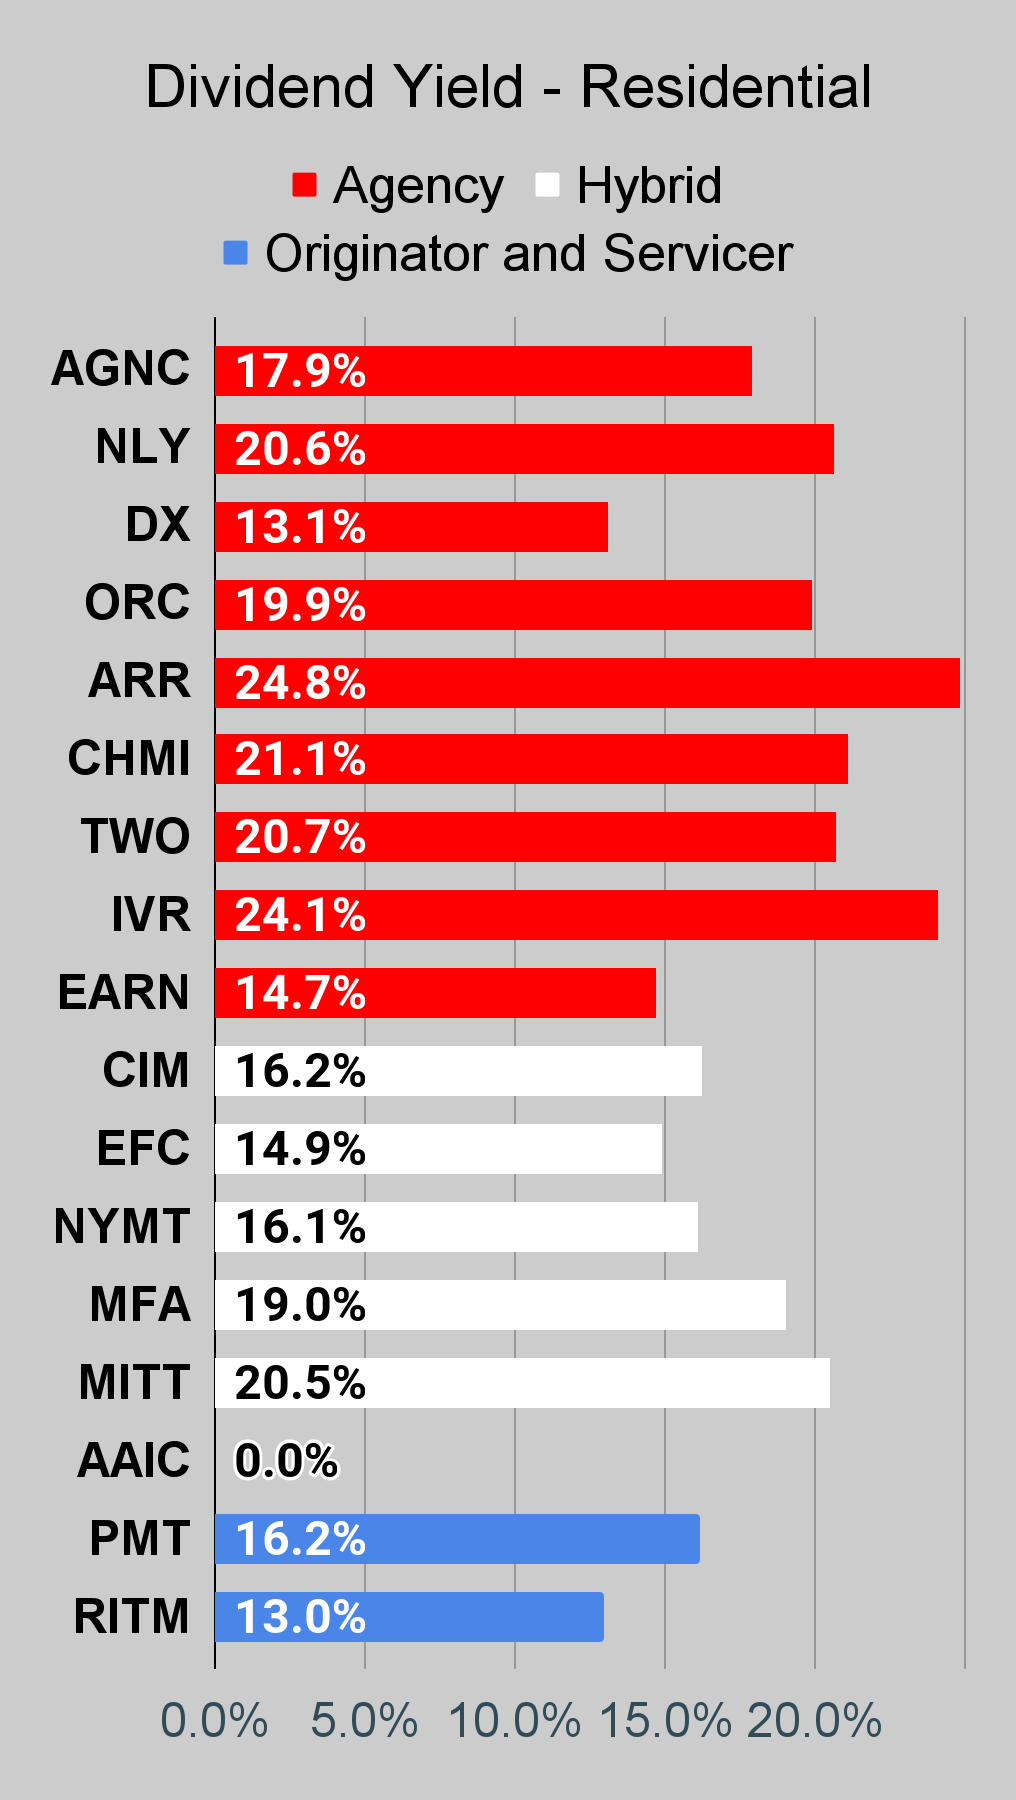
Residential Mortgage REIT Charts
Note: The chart for our public articles uses the book value per share from the latest earnings release. Current estimated book value per share is used in reaching our targets and trading decisions. It is available in our service, but those estimates are not included in the charts below. PMT and NYMT are not showing an earnings yield metric as neither REIT provides a quarterly “Core EPS” metric.
 The REIT Forum |
 The REIT Forum |
 The REIT Forum |
Commercial Mortgage REIT Charts
 The REIT Forum |
 The REIT Forum |
 The REIT Forum |
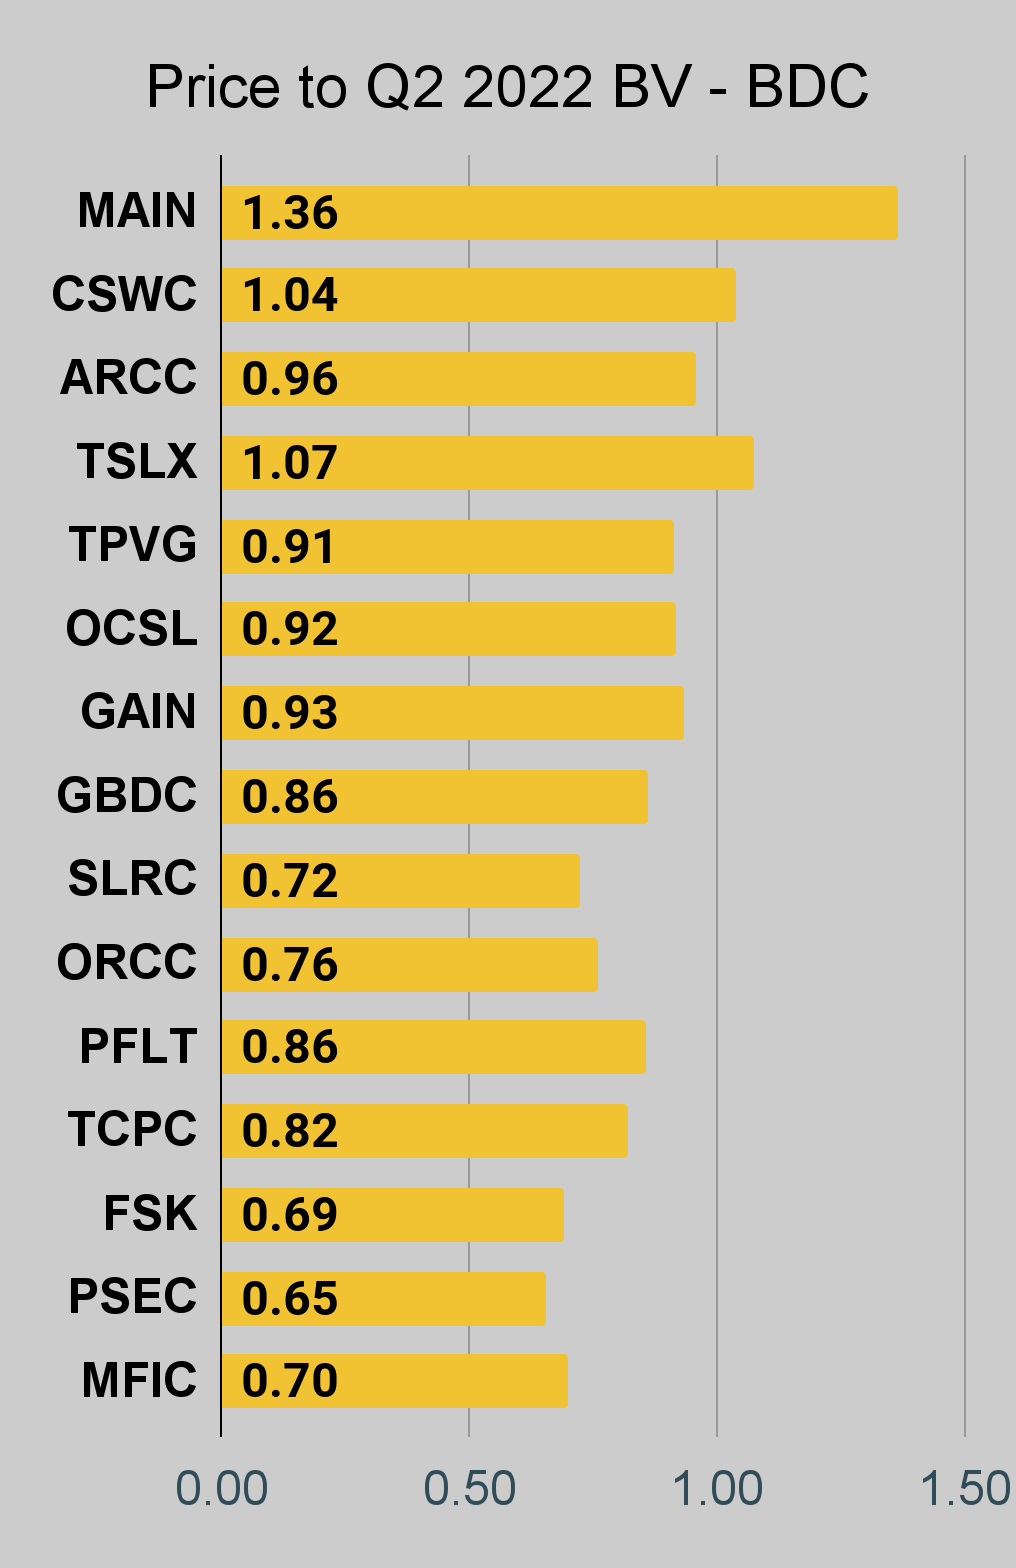
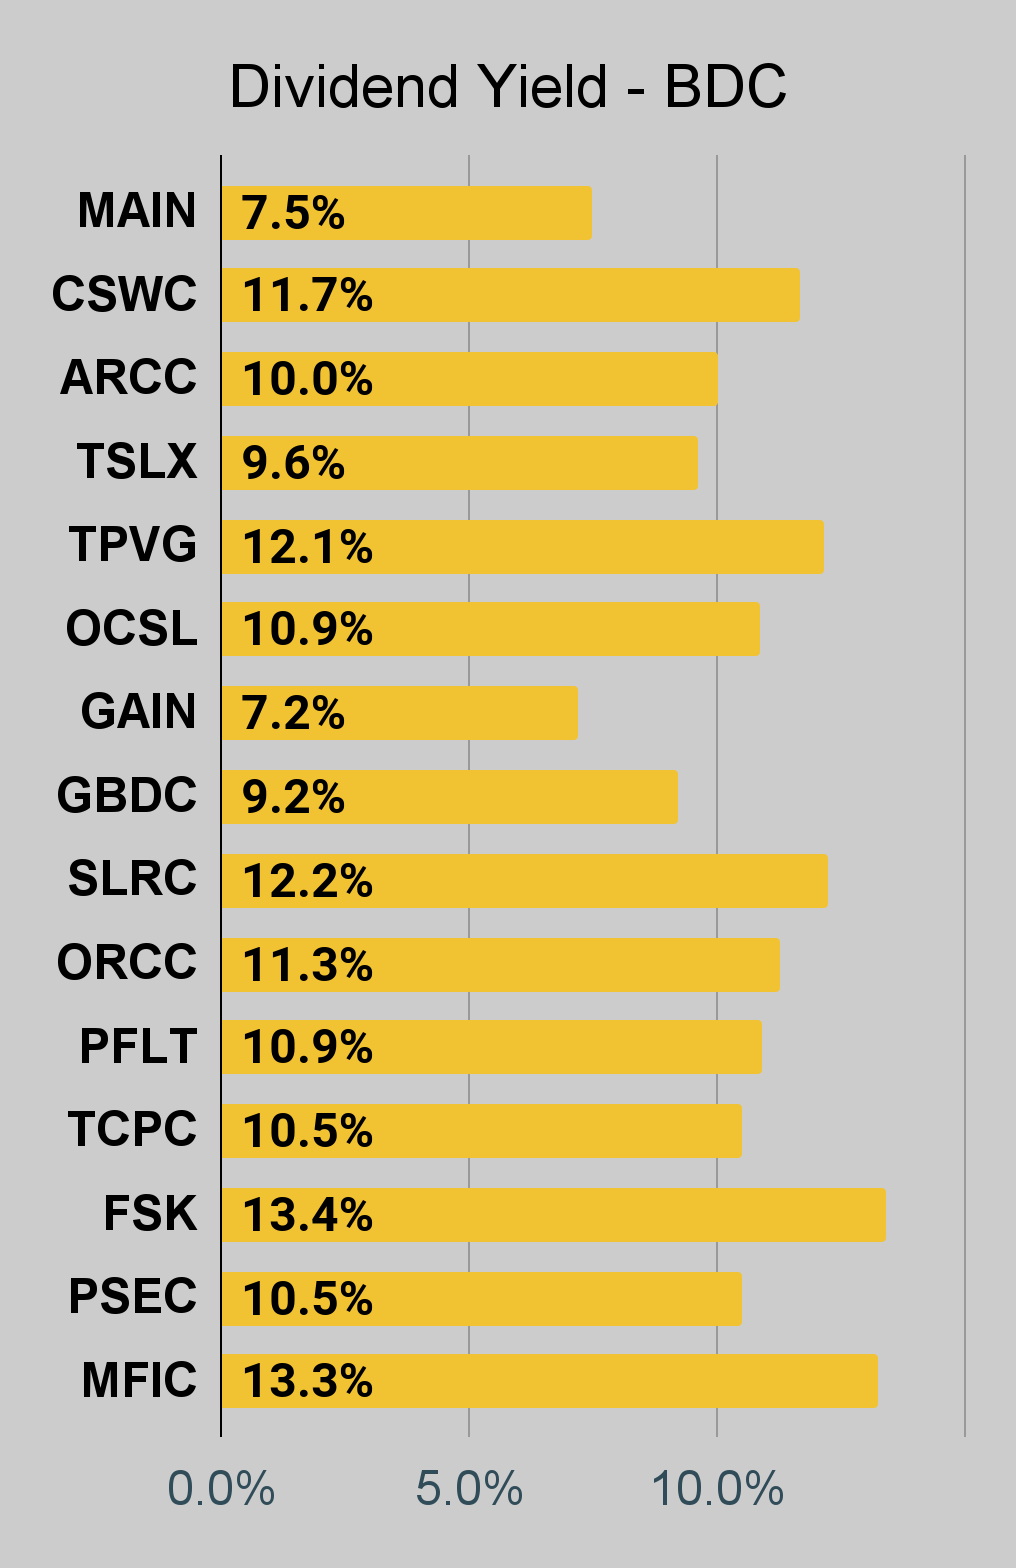
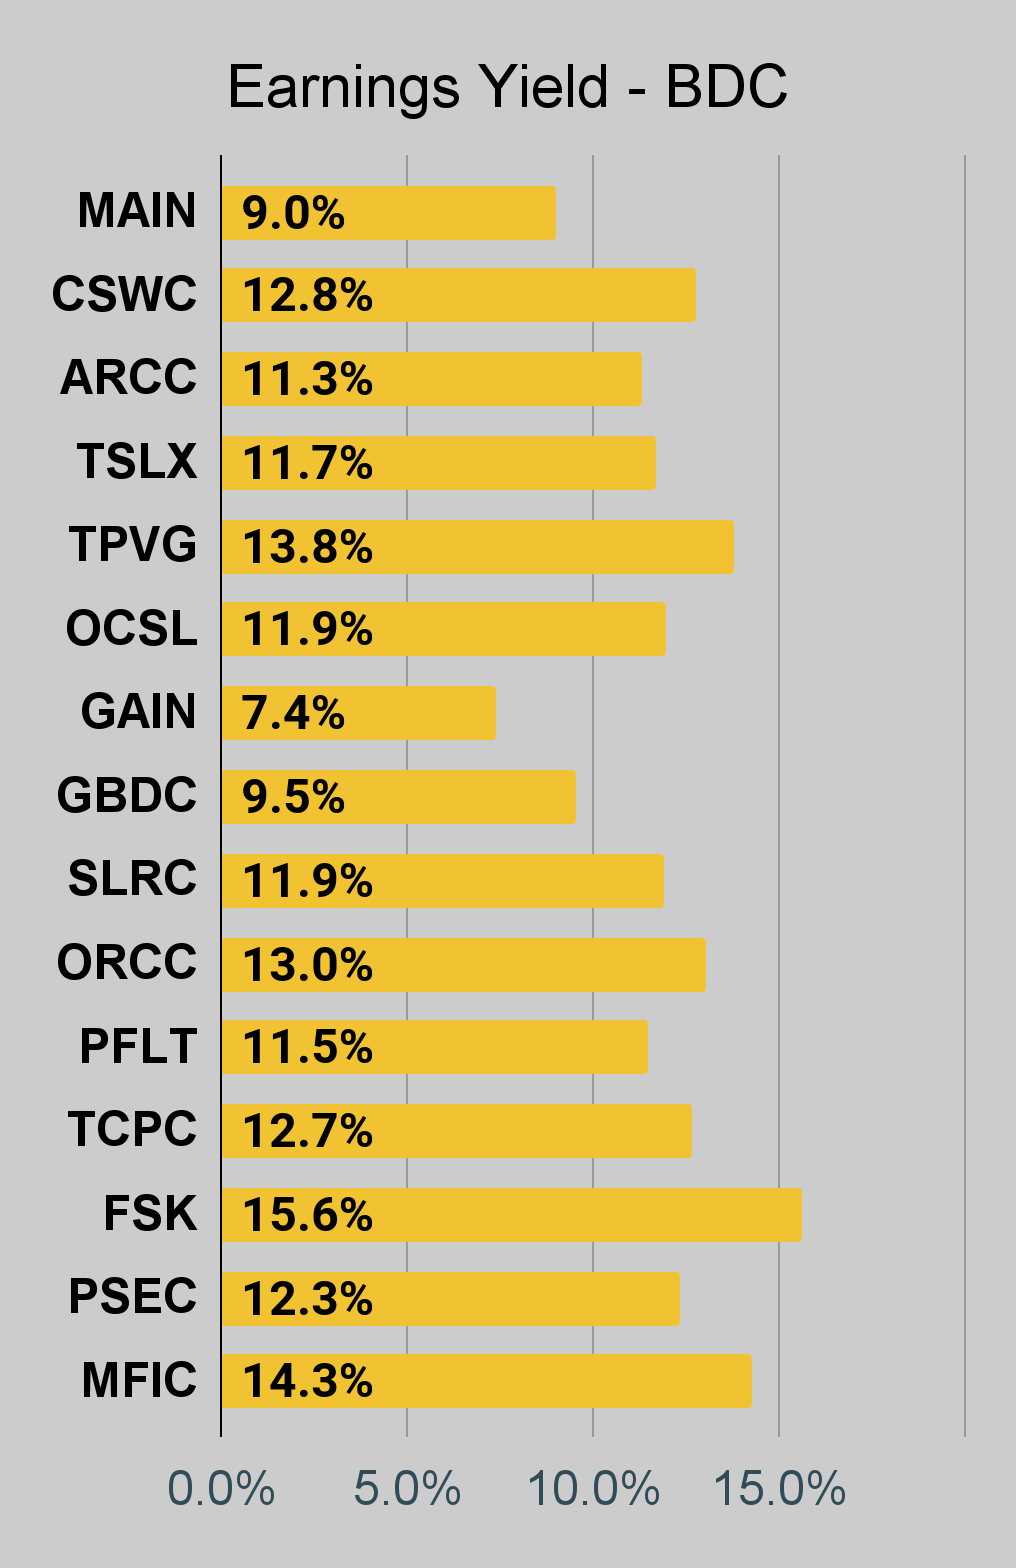
BDC Charts
 The REIT Forum |
 The REIT Forum |
 The REIT Forum |
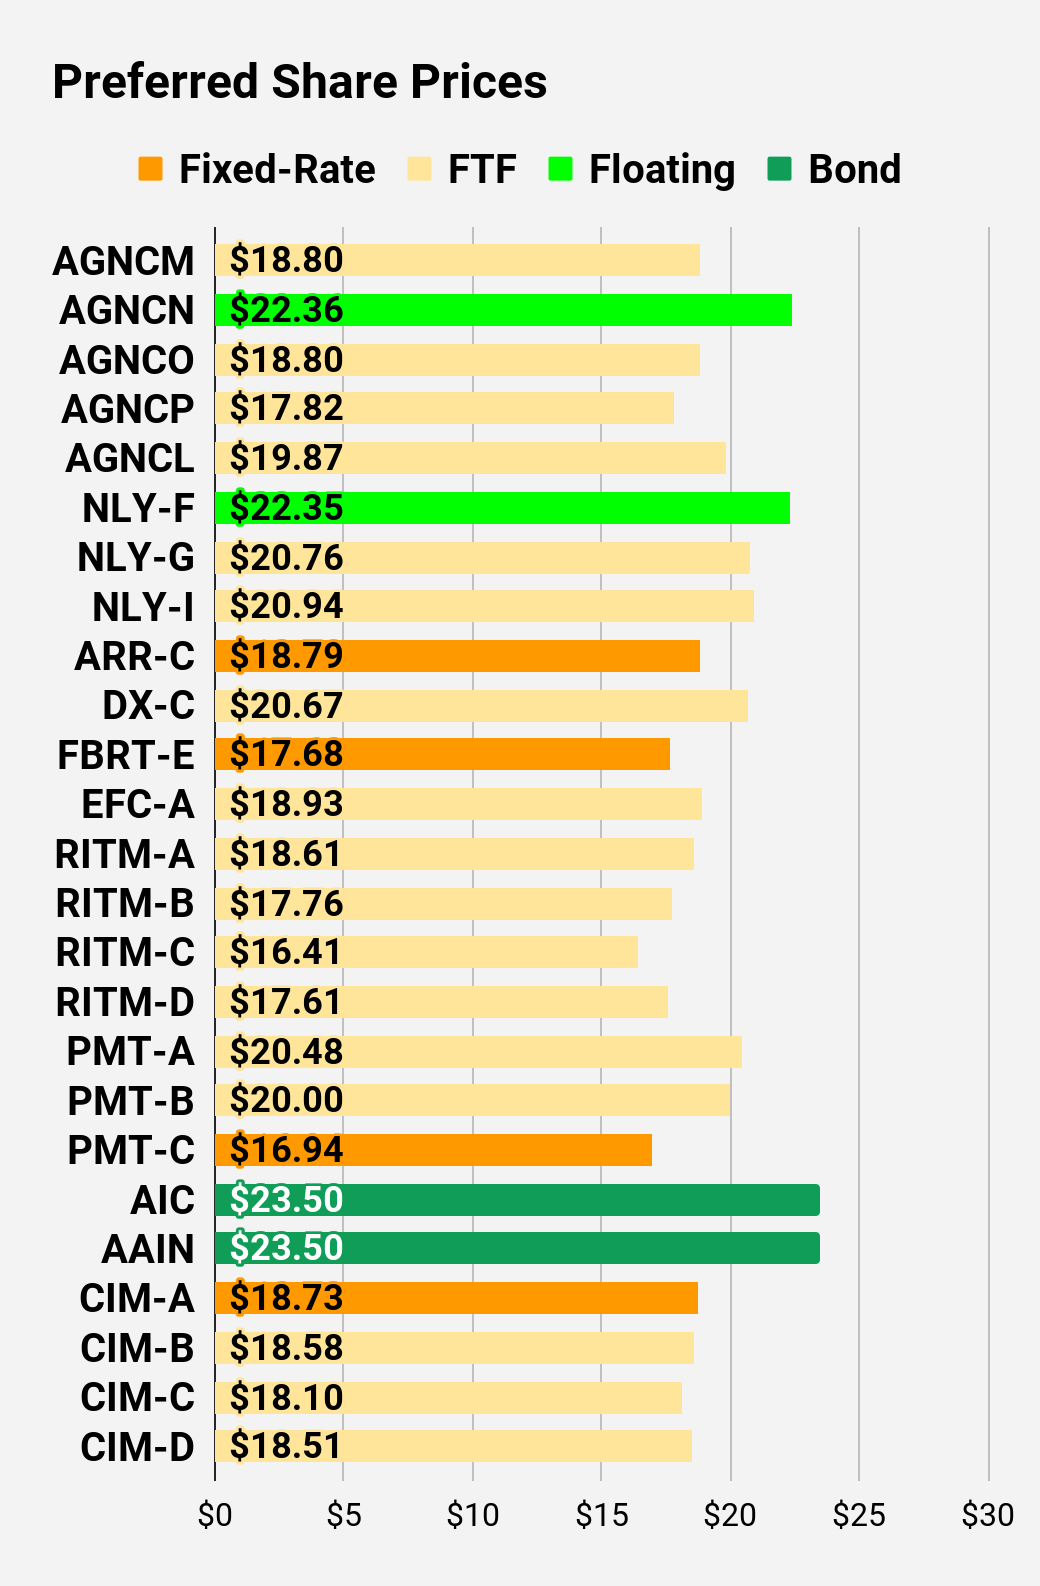
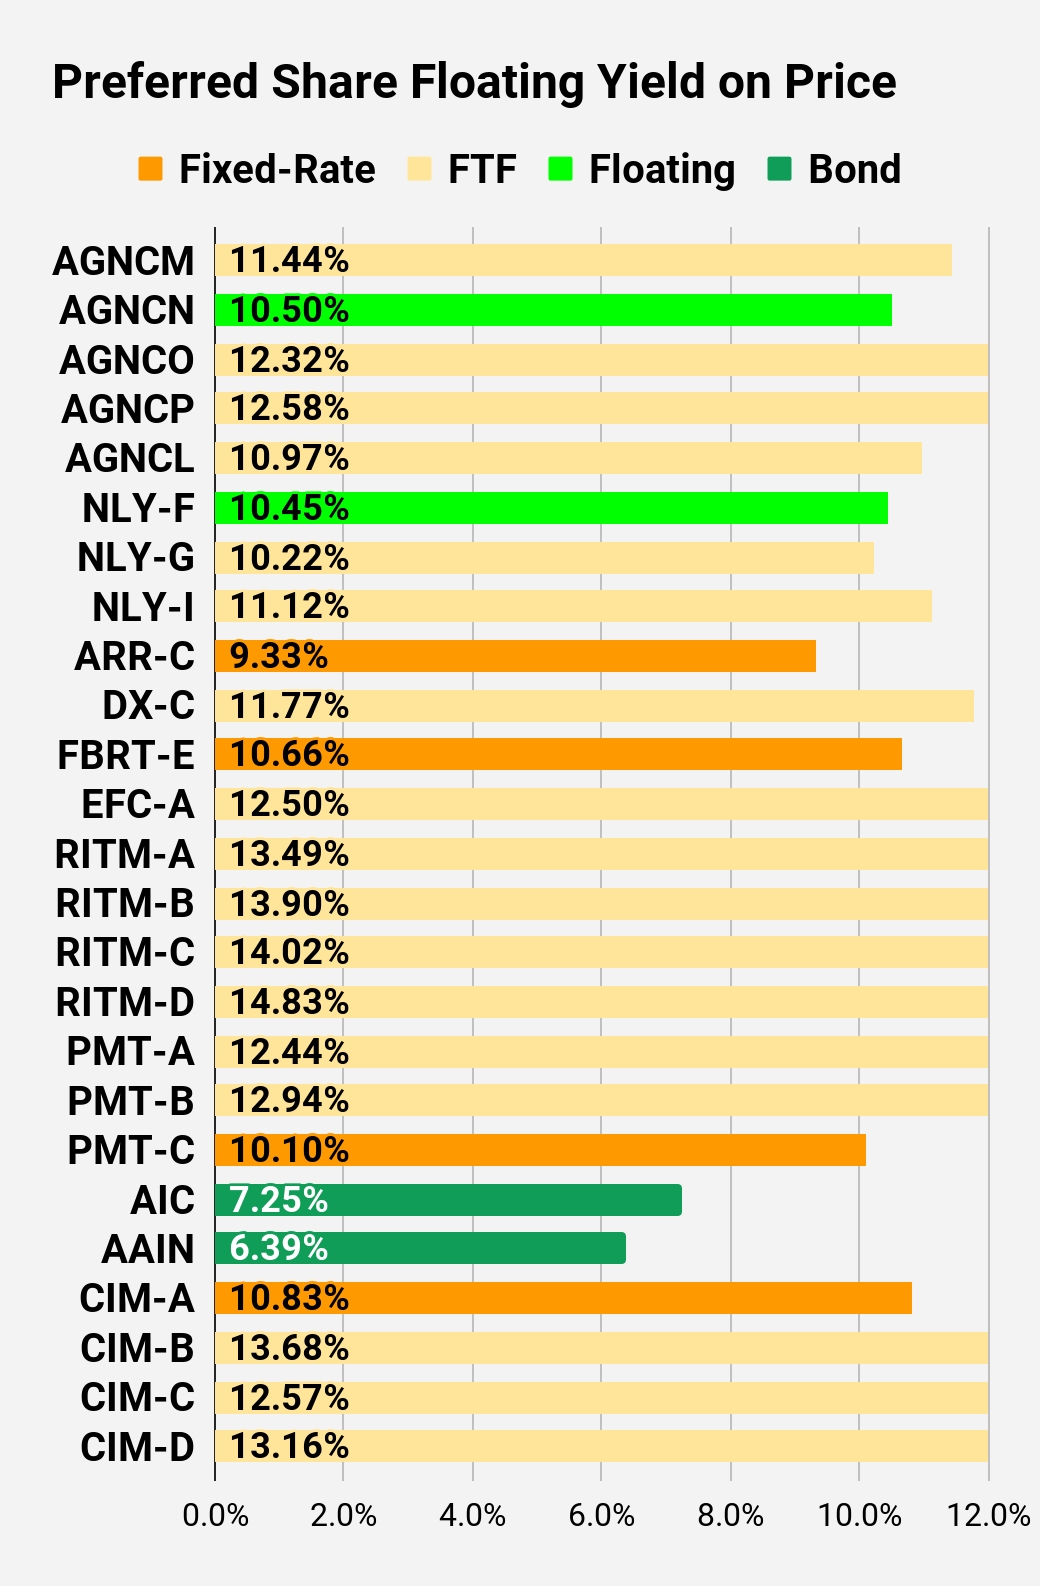
Preferred Share Charts
I changed the coloring a bit. We needed to adjust to include that the first fixed-to-floating shares have transitioned over to floating rates. When a share is already floating, the stripped yield may be different than the “Floating Yield on Price” due to changes in interest rates. For instance, NLY-F already has a floating rate. However, the rate is only reset once per 3 months. The stripped yield is calculated using the upcoming projected dividend payment and the “Floating Yield on Price” is based on where the dividend would be if the rate reset today. In my opinion, for these shares the “Floating Yield on Price” is clearly the more important metric.
 The REIT Forum |
 The REIT Forum |
 The REIT Forum |
 The REIT Forum |
 The REIT Forum |
 The REIT Forum |
Preferred Share Data
Beyond the charts, we’re also providing our readers with access to several other metrics for the preferred shares.
After testing out a series on preferred shares, we decided to try merging it into the series on common shares. After all, we are still talking about positions in mortgage REITs. We don’t have any desire to cover preferred shares without cumulative dividends, so any preferred shares you see in our column will have cumulative dividends. You can verify that by using Quantum Online. We’ve included the links in the table below.
To better organize the table, we needed to abbreviate column names as follows:
- Price = Recent Share Price – Shown in Charts
- BoF = Bond or FTF (Fixed-to-Floating)
- S-Yield = Stripped Yield – Shown in Charts
- Coupon = Initial Fixed-Rate Coupon
- FYoP = Floating Yield on Price – Shown in Charts
- NCD = Next Call Date (the soonest shares could be called)
- Note: For all FTF issues, the floating rate would start on NCD.
- WCC = Worst Cash to Call (lowest net cash return possible from a call)
- QO Link = Link to Quantum Online Page
Second Batch:
Strategy
Our goal is to maximize total returns. We achieve those most effectively by including “trading” strategies. We regularly trade positions in the mortgage REIT common shares and BDCs because:
- Prices are inefficient.
- Long-term, share prices generally revolve around book value.
- Short-term, price-to-book ratios can deviate materially.
- Book value isn’t the only step in analysis, but it is the cornerstone.
We also allocate to preferred shares and equity REITs. We encourage buy-and-hold investors to consider using more preferred shares and equity REITs.
Performance
We compare our performance against 4 ETFs that investors might use for exposure to our sectors:
The REIT Forum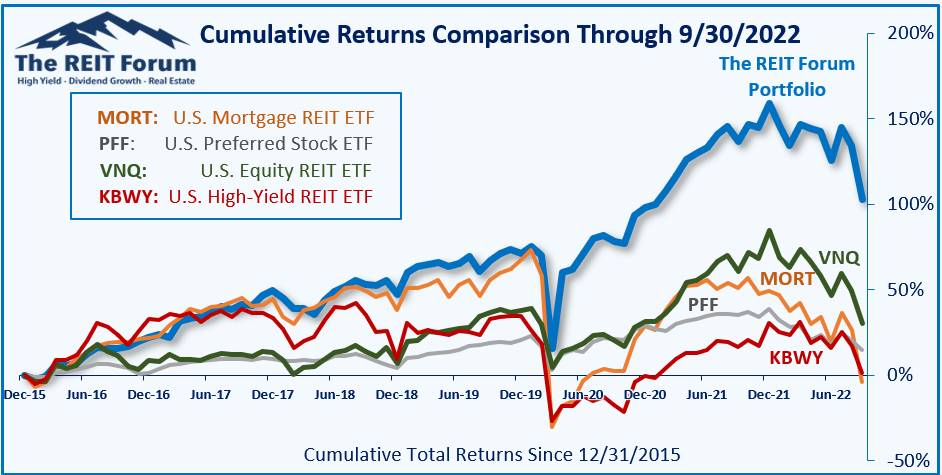
The 4 ETFs we use for comparison are:
|
Ticker |
Exposure |
|
One of the largest mortgage REIT ETFs |
|
|
One of the largest preferred share ETFs |
|
|
Largest equity REIT ETF |
|
|
The high-yield equity REIT ETF. Yes, it has been dreadful. |
When investors think it isn’t possible to earn solid returns in preferred shares or mortgage REITs, we politely disagree. The sector has plenty of opportunities, but investors still need to be wary of the risks. We can’t simply reach for yield and hope for the best. When it comes to common shares, we need to be even more vigilant to protect our principal by regularly watching prices and updating estimates for book value and price targets.
Ratings:
- Bullish on MFA, MITT, RITM, RC, BXMT, GPMT
Be the first to comment