

VIX INDEX SPIRALS LOWER AS CRUDE OIL PRICE RECOVERS; VOLATILITY STILL ELEVATED DESPITE UNDERAPPRECIATED CORONAVIRUS RECESSION RISK
- VIX Index is set to notch its lowest close in over a month amid a broad pullback in cross-asset volatility benchmarks
- Risk appetite improves as crude oil price action recovers after the May 2020 crude oil futures contract imploded into negative territory
- The 30% spike in the S&P 500 since its March 23 swing low has suppressed market volatility but also fueled investor complacency
The VIX Index, a popular gauge of expected market volatility, has taken a nosedive since its March 18 peak. Declining VIX Index price action seems to follow a shared retracement lower in cross-asset volatility benchmarks, such as currency volatility or crude oil volatility, after recently exploding to their strongest readings on record.

Recommended by Rich Dvorak
Traits of Successful Traders
VIX INDEX, CROSS-ASSET VOLATILITY BENCHMARKS SINKAS CENTRAL BANK LIQUIDITY & GOVERNMENT STIMULUS WOO COMPLACENT INVESTORS
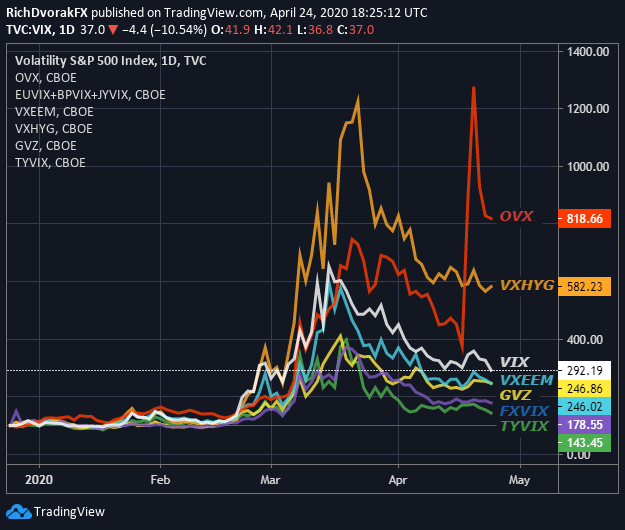
Chart created by @RichDvorakFX with TradingView
Amid the influx of coronavirus optimism, largely in response to unprecedented amounts of stimulus from governments and liquidity from central banks, declines in the VIX Index over the last several trading sessions also appears accompanied by a recovery in risk appetite. This is indicated by the S&P 500 Index surging 30% since its March 23 low, and the VIX Index, which reflects S&P 500 volatility expected over the next 30-days, falling by more than 45-points over the same time.
| Change in | Longs | Shorts | OI |
| Daily | 9% | 2% | 4% |
| Weekly | -16% | 10% | 2% |
VIX INDEX PRICE CHART: MONTHLY TIME FRAME (APRIL 1990 TO APRIL 2020)
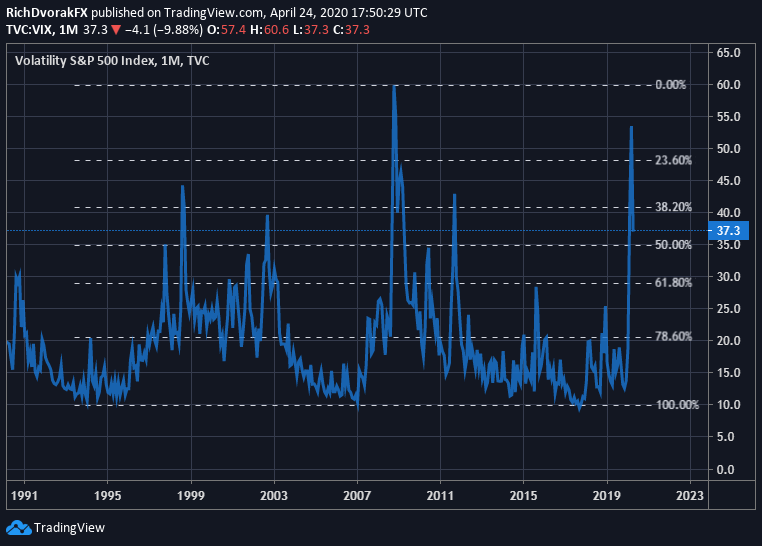
Chart created by @RichDvorakFX with TradingView
Yet, the VIX Index and other cross-asset volatility benchmarks still hang around extreme levels typically observed in the midst of major financial crises. As such, the VIX Index could build a base of technical support around the 35.00 price – an area of confluence highlighted by the mid-point of the historical range recorded by the ‘fear-gauge.’
Recommended by Rich Dvorak
Trading Forex News: The Strategy
Also, considering recession risk is likely unavoidable, there is a notable possibility that complacent investors may soon wake up to a harsh economic reality underpinned by double-digit unemployment. If materialized, this might spark a resurgence of risk aversion that, in turn, sends the VIX Index ripping back higher.
VIX, S&P 500 INDEX UNFAZED BY CRUDE OIL PRICE VOLATILITY SHOCKWAVE – FOR NOW

Chart created by @RichDvorakFX with TradingView
Similarly, crude oil price volatility (OVX) already seems to have recommenced its ascent. The OVX Index exploded higher last week after the price of crude oil inked a historic plunge to negative -$37 per barrel. Considering cross-asset volatility benchmarks tend to move in tandem with one another, particularly when driven by a destabilizing systemic shockwave, the VIX Index might gravitate back higher with crude oil volatility still trading around alarmingly elevated levels.

Recommended by Rich Dvorak
Get Your Free Top Trading Opportunities Forecast
Crude oil price action turning negative, primarily due to crippling demand woes, speaks to the unprecedented collapse in business activity just experienced by the global economy. It also sends an ominous message ahead of high-impact event risk and data releases scheduled on the economic calendar next week. That said, an abrupt return of market volatility, perhaps led by the latest jump in the OVX Index, remains a major threat to risk assets and complacent investors.
Keep Reading – US Dollar & VIX Supported; Stock Market Rally at Wits End?
— Written by Rich Dvorak, Analyst for DailyFX.com
Connect with @RichDvorakFX on Twitter for real-time market insight
Be the first to comment