

Torsten Asmus/iStock via Getty Images
(This article was co-produced with Hoya Capital Real Estate)
Introduction
While there have been numerous articles recently eulogizing the death of the traditional 60/40 Equity/Bond allocation, few, if any, have suggested that bonds have no place in an investor’s portfolio allocation. Another Seeking Alpha contributor, Salman Ebrahim, recently penned an article on that topic, believing such death notices are premature.
This article will review a multi-sector bond ETF, the Fidelity Total Bond ETF (NYSEARCA:FBND). Also included is a comparison against three well-known bond ETFs, one with a similar strategy, two using more focused strategies. Not discussed is whether there are better ETF bond strategies to use. Links to such articles are provided at the end of this article.
Fidelity Total Bond ETF review
Seeking Alpha describes this ETF as:
The investment seeks a high level of current income. Normally, the fund invests at least 80% of assets in debt securities of all types and repurchase agreements for those securities. The manager uses the Bloomberg U.S. Universal Bond Index as a guide in allocating assets across the investment-grade, high yield, and emerging market asset classes. The fund primarily invests in investment-grade and high yield securities of varying maturities. The fund invests up to 20% of assets in lower-quality debt securities. It is managed to have similar overall interest rate risk to the index. FBND started in 2014.
Source: seekingalpha.com FBND
FBND has $2.2b in assets and provides a current yield of 2.2%. The managers charge 36bps in fees; on the high side for an index-based ETF, but lower than one of the comparison ETFs.
Index review
While two indices are listed, the ETF’s description indicates the Bloomberg U.S. Universal Bond Index to be the primary one used to set its allocation. The Index comes with this description:
The Bloomberg US Universal Index represents the union of the US Aggregate Index, US Corporate High Yield Index, Investment Grade 144A Index, Eurodollar Index, US Emerging Markets Index, and the non-ERISA eligible portion of the CMBS Index. The index covers USD-denominated, taxable bonds that are rated either investment grade or high-yield. Some US Universal Index constituents may be eligible for one or more of its contributing subcomponents that are not mutually exclusive. These securities are not double- counted in the index. The U.S. Universal index was created on January 1, 1999, with index history backfilled to January 1, 1990.
Source: assets.bbhub.io Index.pdf
The document includes the following Index rules:
- The Index includes both investment grade (Baa3/BBB-/BBB- or above) and high yield (Ba1/BB+/BB+ or below) using the middle rating of Moody’s, S&P, and Fitch.
- Minimum size limits:
- Treasury, government-related and corporate securities: $300mn
- MBS pass-throughs, pool aggregates: $1bn
- ABS: 500mn deal size and $25mn minimum tranche size
- CMBS: $500mn deal size with a $300mn amount outstanding remaining in the deal and $25mn minimum tranche size
- US High Yield securities: $150mn
- Eurodollar issues: $300mn
- US emerging markets issues: $500mn minimum at the security level; corporate issuers must have at least $1bn in outstanding debt trading in the market
- Maturity rules:
- At least one year until final maturity, regardless of optionality.
- MBS must have a weighted average maturity of at least one year. CMBS and ABS must have a remaining average life of at least one year.
- Bonds that convert from fixed to floating rate, including fixed-to-float perpetuals, will exit the index one year prior to conversion to floating-rate. Fixed-rate perpetuals are not included.
- Only fully taxable issues are eligible. Build America Bonds with the tax credit to the issuer are eligible.
- Rebalance rules:
- For each index, Bloomberg maintains two universes of securities: the Returns (Backward) and the Projected (Forward) Universes. The composition of the Returns Universe is rebalanced at each month-end and represents the fixed set of bonds on which index returns are calculated for the next month.
- During the month, indicative changes to securities (credit rating change, sector reclassification, amount outstanding changes, corporate actions, and ticker changes) are reflected daily in the Projected and Returns Universe of the index.
- Qualifying New securities issued, but not necessarily settled on or before the month-end rebalancing date, qualify for inclusion in the following month’s index if the required security reference information and pricing are readily available.
Holdings review
Holdings data is from 5/31/22, at which time FBND held 1947 assets (1934 long; 13 short). Even with that large number of assets, the Top 10 still comprise 28% of the portfolio.
Fidelity.com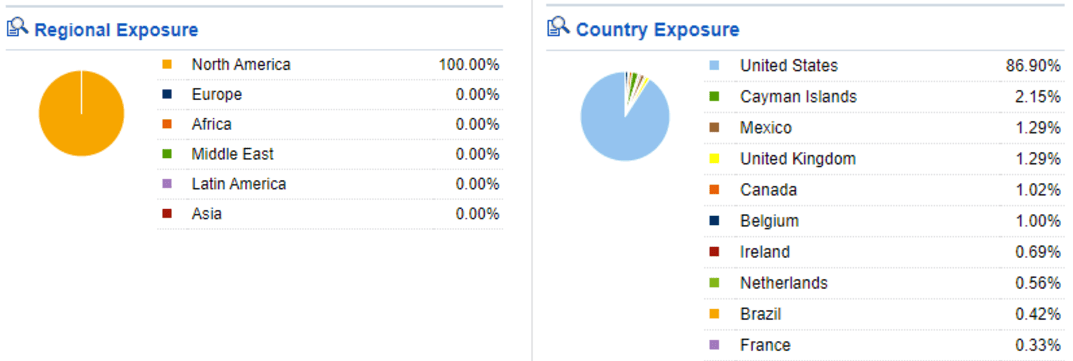
While the Regional chart claims 100% North America exposure, the Top 10 country exposure data shows both Europe and South America assets. Currency exposure is 87% USD; 13% other.
Fidelity.com; compiled by Author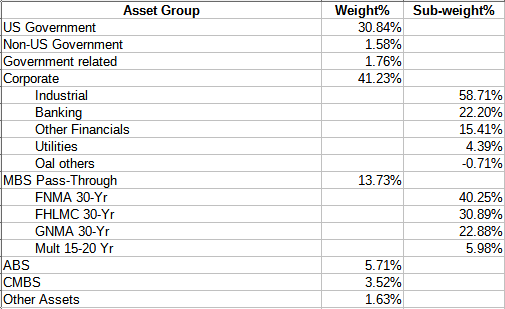
The Government related is evenly divided between Sovereign and Agency debt. This results in the following credit quality percents.
research2.fidelity.com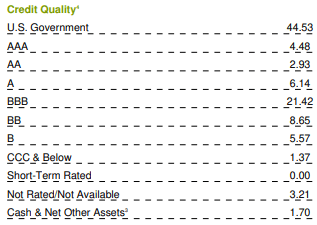
Non-investment-grade debt equates to 15.6% of the debt; offset by 49% being AAA rated. The next table shows data points commonly provided for a bond ETF.
Fidelity.com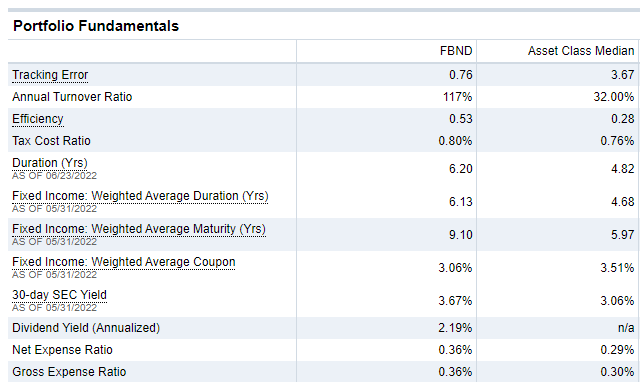
Maturity-wise, Fidelity classifies 26% as short; 34% mid; and 38% as long term, with a resulting WAM of 9.1 years. With a duration over 6, FBND is at higher risk to rising interest rates than ETFs focused on the shorter end of the market. That said, the duration distribution shows 25% of the portfolio under 3 years, providing opportunities to add higher coupon bonds over that time frame.
Fidelity.com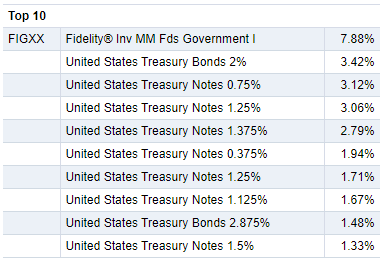
No corporate bond is more than .5% of the portfolio. With a portfolio WAC of 3.06%, the Corporates and Asset-backed must carry much higher rates than that since most UST rates are much less.
Distribution review
seekingalpha.com FBND DVDs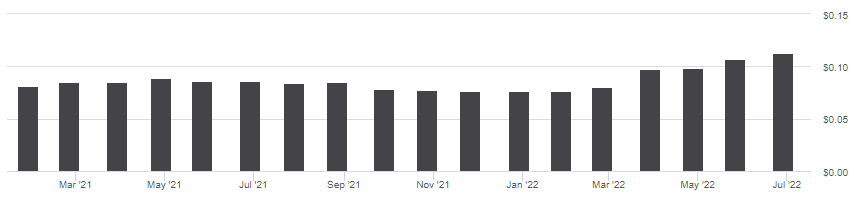
Normally I would show more history but a large 2021 extra payment made all the monthly payments look the same. Each of the last five monthly payments were raised, going from $.076 to the July payout of $.113. Seeking Alpha grades many ETFs on five factors, dividends being one of those. Here, FBND does not compare well against other funds.
seekingalpha.com DVD scorecard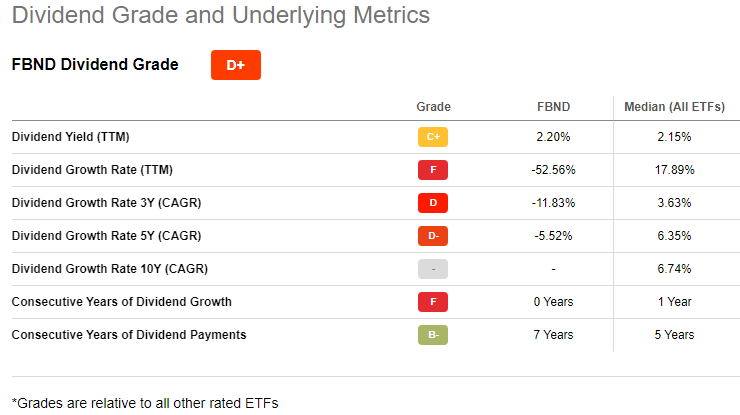
Seeking Alpha also provides overall grades for ETFs, which are listed next.
Overall ratings
seekingalpha.com scorecard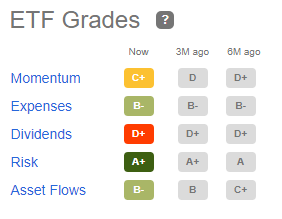
Recent price movements are reflected in the C+ rating for momentum. The “questioned” dividend grade is the only other low score. Most grades have moved little over the past six months. Seeking Alpha also provides Quant rating for FBND. For those new to this feature, here is how Seeking Alpha defines the process:
Seeking Alpha’s Quant Ratings are an objective, unemotional evaluation of each stock based on data, such as the company’s financial statements, the stock’s price performance, and analysts’ estimates of the company’s future revenue and earnings. Over 100 metrics for each stock are compared to the same metrics for the other stocks in its sector. The stock is then assigned a rating (Strong Sell, Sell, Hold, Buy or Strong Buy), and a score (from 1.0 to 5.0, where 1.0 is Strong Sell and 5.0 is Strong Buy).
Seeking Alpha grades each stock by five “factors” — Value, Growth, Profitability, Momentum and EPS Revisions. To do this, we compare the relevant metrics for the factor in question for the stock to the same metrics for the other stocks in its sector. The factor is then assigned a grade, from A+ to F.
Source: seekingalpha.com Quant Ratings
seekingalpha.com FBND Quants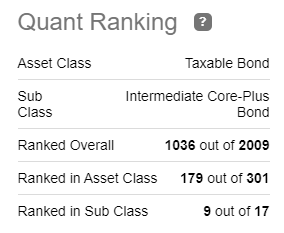
The composite score is 2.93 out of 5, a Hold rating. This is up from 2.12, a Sell rating, from about two weeks ago.
Performance review
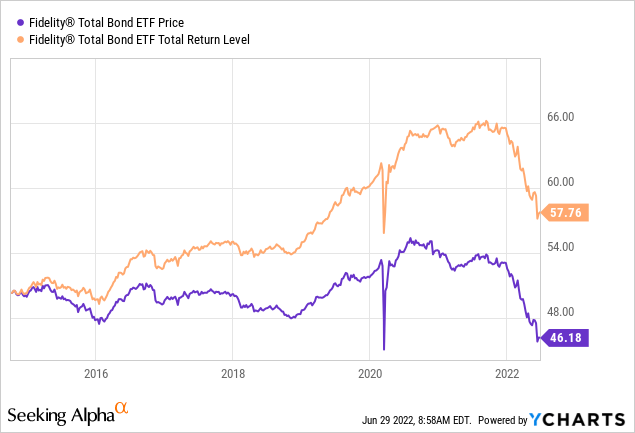
FBND’s price has been dropping as interest rates started climbing last fall. Inflation expectations have Fed followers predicting more jumps in the Fed rate, possibly continuing into 2023. Translation, an ETF with a 6+ year duration might not be the best fixed income choice at this time. Since launching in late 2014, FBND has only provided investors with a 1.57% CAGR. Even before the current swoon, the CAGR was only 3.66% during a period of level to falling rates. Even for long-term investors not overly concerned about the current interest-rate environment, FBND would rate a Hold for those wanting multi-sector exposure to bonds.
Portfolio strategy
While short-duration funds should be doing better when rates are climbing, my recent review of the PIMCO Senior Loan Active ETF (LONZ) did not seem to support that concept. Here I will compare FBND to three other ETFs, one a multi-sector like itself; two that focus on a single segment. All three ETFs have durations between 6.8 and 7.4; slightly longer than FBND’s.
- iShares Core U.S. Aggregate Bond ETF (AGG)
- Vanguard Mortgage-Backed Securities Index ETF (VMBS)
- PIMCO Investment Grade Corporate Bond Index ETF (CORP)
PortfolioVisualizer.com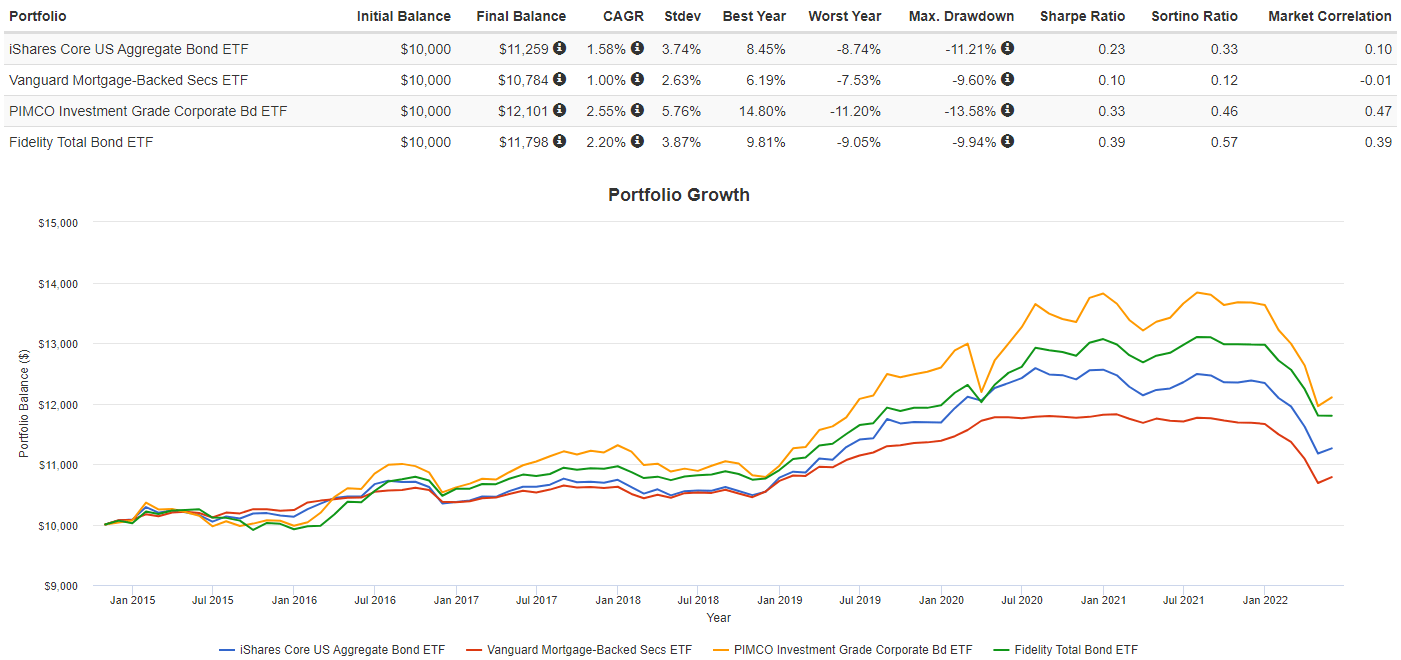
FBND places second in CAGR, but its lower StdDev results in the best Sharpe and Sortino ratios. To gain a lower correlation factor, a reason for owning bonds, an investor would need to own either of the two poorest performers.
For long-term investors not overly concerned about the current interest rate environment, FBND still rates a Hold for those wanting multi-sector exposure to bonds.
Final thoughts
With the whole market in flux with the war in Ukraine, decades high inflation, and tightening Fed policy, I tried reviewing multiple Fixed Income funds to see which are holding up the best. Here are links to a diverse set. My viewpoint was not always correct!
Be the first to comment