

fatido/iStock via Getty Images
This article was coproduced with Dividend Sensei.
The wild bear market of 2022 continues, with stocks recently suffering their worst day since June…2020.
Things got so extreme on September 13th that the Nasdaq plunged 6.5% from its pre-market high to finish -5.5%. The S&P fell “just” 5.3% intra-day, finishing down a still harrowing 4.3%.
The reason was inflation coming in much hotter than expected, with core inflation rising 0.6% month over month, 2X what economists had been expecting.
The bond market is now pricing in a peak Fed funds rate of 4.5%, which the Fed might hold at for an entire year…or two according to some Fed presidents.
In these turbulent stagflationary times, with recession risk of 80% according to the bond market, it’s natural for high-yield dividend investors to be nervous.
But do you know a great way to beat stagflation, recession, and this bear market? Hitch your wagon to a world-beater high-yield blue-chip with a proven track record of beating all three!
I’m talking about Federal Realty Investment Trust (NYSE:FRT), an Ultra SWAN quality dividend king that has been raising its dividend every single year…since 1967.
FRT has been raising its dividend every year since 1967 through
-
eight recessions
-
two economic crises
-
13 bear markets
-
dozens of corrections and pullbacks
-
inflation as high as 14.8%
-
interest rates as high as 20%
-
10-year Treasury yields as high as 16%
This REIT is built to last and will likely outlive us all, no matter how high inflation might climb in the short-term.
Let me show you the four reasons why FRT isn’t just the perfect high-yield dividend king to beat stagflation and this bear market, but could also deliver Buffett-like returns over the next three years.
Reason One: Federal Realty Is The Complete Very Safe High-Yield Package
Here is the bottom line on FRT:
-
FRT is an UPREIT
-
dividends are taxed as ordinary income for Americans
-
the top marginal tax rate
-
some international investors report LP withholding rates (37%) due to FRT’s recent restructuring
-
whether or not you can recoup the withholding with a tax credit will depend on the tax treaty between your country and the US
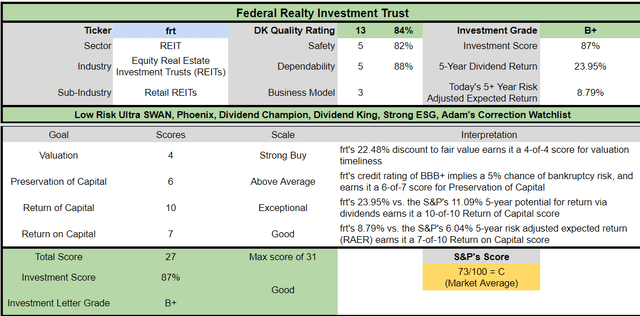
Reasons To Potentially Buy Federal Realty Today
|
Metric |
Federal Realty Investment Trust |
|
Quality |
84% 13/13 Ultra SWAN (Sleep Well At Night) Dividend King |
|
Risk Rating |
Low Risk |
|
DK Master List Quality Ranking (Out Of 500 Companies) |
176 |
|
Quality Percentile |
65% |
|
Dividend Growth Streak (Years) |
55 |
|
Dividend Yield |
4.10% |
|
Dividend Safety Score |
82% very safe |
|
Average Recession Dividend Cut Risk |
0.5% |
|
Severe Recession Dividend Cut Risk |
1.95% |
|
S&P Credit Rating |
BBB+ Stable Outlook |
|
30-Year Bankruptcy Risk |
5.0% |
|
Consensus LT Risk-Management Industry Percentile |
78% Good, Bordering On Very Good |
|
Fair Value |
$135.74 |
|
Current Price |
$105.23 |
|
Discount To Fair Value |
22% |
|
DK Rating |
Potentially Strong Buy |
|
P/FFO |
16.6 |
|
Historical PE Range |
21 to 22 |
|
LT Growth Consensus/Management Guidance |
6.3% |
|
5-year consensus total return potential |
11% to 13% CAGR |
|
Base Case 5-year consensus return potential |
12% CAGR (2X better than the S&P 500) |
|
Consensus 12-month total return forecast |
19% |
|
Fundamentally Justified 12-Month Return Potential |
33% |
|
LT Consensus Total Return Potential |
10.4% Vs. 9.2% CAGR for REIT sector |
|
Inflation-Adjusted Consensus LT Return Potential |
8.2% |
|
Consensus 10-Year Inflation-Adjusted Total Return Potential (Ignoring Valuation) |
2.20 |
|
LT Risk-Adjusted Expected Return |
6.92% |
|
LT Risk-And Inflation-Adjusted Return Potential |
4.70% |
|
Conservative Years To Double |
15.33 |
(Source: DK Zen Research Terminal)
FRT is the only dividend king in REITdom, and analysts expect it to outperform the sector by about 1.2% CAGR over the long-term.
Federal Realty 2024 Consensus Total Return Potential
FAST Graphs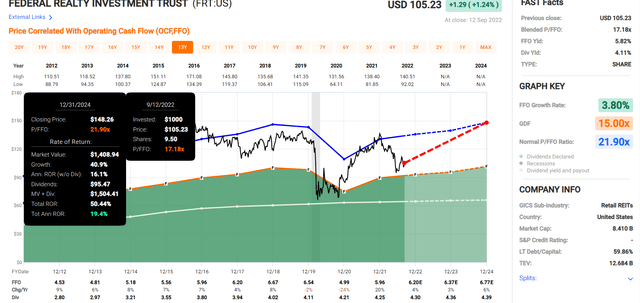
FRT offers Buffett-like return potential through 2024 in a low-risk, high-yield dividend king package.
Federal Realty 2027 Consensus Total Return Potential
FAST Graphs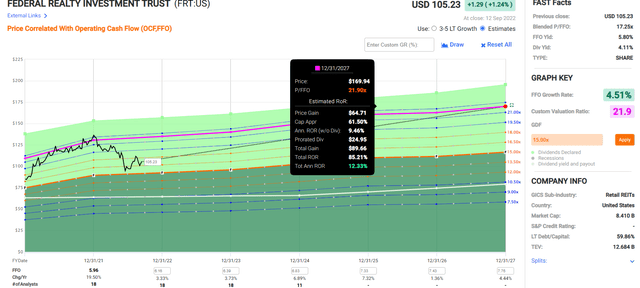
Through 2027 it offers the chance to potentially almost double your money, with 12% CAGR total returns, some of the best in REITdom.
Now compare that to the S&P 500.
S&P 500 2024 Consensus Total Return Potential
Fast Graphs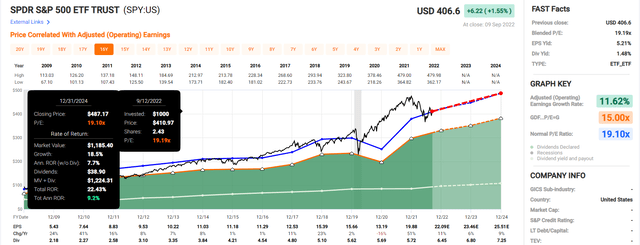
-
over the next 2.5 years, analysts think FRT could 2.5X the market’s returns.
S&P 500 2027 Consensus Total Return Potential
|
Year |
Upside Potential By End of That Year |
Consensus CAGR Return Potential By End of That Year |
Probability-Weighted Return (Annualized) |
Inflation And Risk-Adjusted Expected Returns |
|
2027 |
48.76% |
8.27% |
6.20% |
3.80% |
(Source: DK S&P 500 Valuation & Total Return Tool)
Over the next five years, analysts expect 8% annual returns from the S&P 500, about 2.0X less than they expect from FRT.
FRT Investment Decision Score
Dividend Kings Dividend Kings
FRT is a very reasonable Ultra SWAN high-yield dividend king option for anyone comfortable with its risk profile.
-
23% discount vs. 3% market premium = 26% better valuation
-
4.1% yield vs. 1.6% yield (2.6X the yield and a much safer yield at that)
-
market-level consensus long-term return potential, 13% better return potential than REIT sector
-
50% better risk-adjusted expected return over the next five years
-
2X more income over the next five years
Reason Two: One Of The World’s Safest Dividend Blue-Chips
There are many ways to measure safety and quality, and I factor in pretty much all of them.
The Dividend Kings’ overall quality scores are based on a 269-point model that includes:
-
Dividend safety
-
Balance sheet strength
-
Credit ratings
-
Credit default swap medium-term bankruptcy risk data
-
Short and long-term bankruptcy risk
-
Accounting and corporate fraud risk
-
Profitability and business model
-
Growth consensus estimates
-
Management growth guidance
-
Historical earnings growth rates
-
Historical cash flow growth rates
-
Historical dividend growth rates
-
Historical sales growth rates
-
Cost of capital
-
GF Scores
-
Morningstar business model uncertainty score
-
Long-term risk-management scores from Moody’s, MSCI, Morningstar, FactSet, S&P, Reuters’/Refinitiv, and Just Capital
-
Management quality
-
Dividend-friendly corporate culture/income dependability
-
Long-term total returns (a Ben Graham sign of quality)
-
Analyst consensus long-term return potential
It includes over 1,000 fundamental metrics, including the 12 rating agencies we use to assess fundamental risk.
-
credit and risk management ratings make up 41% of the DK safety, and quality model
-
dividend/balance sheet/risk ratings make up 82% of the DK safety and quality model
How do we know that our safety and quality model works well?
During the two worst recessions in 75 years, our safety model 87% of blue-chip dividend cuts, the ultimate baptism by fire for any dividend safety model.
How does FRT score on our comprehensive safety and quality models?
FRT Dividend Safety
|
Rating |
Dividend Kings Safety Score (192 Point Safety Model) |
Approximate Dividend Cut Risk (Average Recession) |
Approximate Dividend Cut Risk In Pandemic Level Recession |
|
1 – unsafe |
0% to 20% |
over 4% |
16+% |
|
2- below average |
21% to 40% |
over 2% |
8% to 16% |
|
3 – average |
41% to 60% |
2% |
4% to 8% |
|
4 – safe |
61% to 80% |
1% |
2% to 4% |
|
5- very safe |
81% to 100% |
0.5% |
1% to 2% |
|
FRT |
82% |
0.5% |
1.95% |
|
Risk Rating |
Low-Risk (78th industry percentile risk-management consensus) |
BBB+ Stable Outlook rating = 5% 30-year bankruptcy risk |
20% OR LESS Max Risk Cap Recommendation |
Long-Term Dependability
|
Company |
DK Long-Term Dependability Score |
Interpretation |
Points |
|
Non-Dependable Companies |
20% or below |
Poor Dependability |
1 |
|
Low Dependability Companies |
21% to 59% |
Below-Average Dependability |
2 |
|
S&P 500/Industry Average |
60% (60% to 69% range) |
Average Dependability |
3 |
|
Above-Average |
70% to 79% |
Very Dependable |
4 |
|
Very Good |
80% or higher |
Exceptional Dependability |
5 |
|
FRT |
88% |
Exceptional Dependability |
5 |
Overall Quality
|
FRT |
Final Score |
Rating |
|
Safety |
82% |
5/5 Very Safe |
|
Business Model |
80% |
3/3 Excellent, Stable |
|
Dependability |
88% |
5/5 Exceptional |
|
Total |
84% |
13/13 Ultra SWAN Dividend King |
|
Risk Rating |
4/5 Low-Risk |
|
|
15% OR LESS Max Risk Cap Rec |
10% Margin of Safety For A Potentially Good Buy |
FRT is the 176th highest quality company on the DK 500 Masterlist.
How significant is this?
The DK 500 Master List is one of the world’s best watchlists, including
-
every dividend aristocrat (S&P companies with 25+ year dividend growth streaks)
-
every dividend champion (every company, including foreign, with 25+ year dividend growth streaks)
-
every dividend king (every company with 50+ year dividend growth streaks)
-
every foreign aristocrat (every company with 20+ year dividend growth streaks)
-
every Ultra SWAN (wide moat aristocrats, as close to perfect quality companies as exist)
-
40 of the world’s best growth stocks
In other words, even among the world’s best companies, FRT is higher quality than 65% of them, similar in quality to such aristocrats and Ultra SWANs as:
-
Altria (MO): Ultra SWAN Dividend King
-
AbbVie (ABBV): Ultra SWAN dividend king
-
British American Tobacco (BTI): Ultra SWAN global aristocrat
-
Realty Income (O): Ultra SWAN dividend aristocrat
-
Clorox (CLX): Super SWAN dividend aristocrat
FRT Credit Ratings
|
Rating Agency |
Credit Rating |
30-Year Default/Bankruptcy Risk |
Chance of Losing 100% Of Your Investment 1 In |
|
S&P |
BBB+ Stable Outlook |
5.00% |
20.0 |
|
Moody’s |
Baa2 (BBB+ equivalent) Stable Outlook |
5.00% |
20.0 |
|
Consensus |
BBB+ Stable Outlook |
5.00% |
20.0 |
(Source: S&P, Moody’s)
FRT’s leverage became elevated during the Pandemic crisis and rating agencies have recently downgraded its ratings from A- negative outlook.
Federal Realty Investment Trust Rating Lowered To ‘BBB+’ On Prolonged Elevated Leverage; Outlook Stable
We expect Federal Realty’s leverage metrics to improve over the next 12 to 24 months but remain above our tolerance for the prior rating, with S&P Global Ratings-adjusted debt to EBITDA around 6x. March 10, 2022 – S&P Global Ratings today took the above rating actions.
Federal Realty’s S&P Global Ratings-adjusted debt to EBITDA to remain at or above 6x through 2023. As of year-end 2021, Federal Realty’s S&P Global Ratings-adjusted debt to EBITDA was 7.1x, down from 7.4x at year-end 2020, but still significantly above the mid-5x area where the company has operated historically.
We expect credit metrics will continue to improve organically over the next several quarters upon accretion of EBITDA from redevelopments, acquisitions, and stronger operating performance. As a result, we estimate debt to EBITDA will improve to the low-to-mid-6x area by 2022 and around-6x area by 2023.
We believe these leverage bands are commensurate with REITs rated ‘BBB+’ rather than ‘A-‘ rating, where adjusted debt to EBITDA is typically in the mid-5x area or below.
Moreover, we believe that headwinds inherent to retail properties could exacerbate operating disruptions and cash flow volatility as demonstrated over the past couple of years, and require additional cushion relative to other REIT property types.
The stable outlook reflects our view that the company will exhibit solid operating performance and fund acquisitions and development in a largely leverage-neutral fashion. – S&P (emphasis added)
Rating agencies now estimate a 5% fundamental risk of default, or a 1 in 20 chance investors lose all their money buying FRT.
FRT Leverage Consensus Forecast
|
Year |
Debt/EBITDA |
Net Debt/EBITDA (6.0 Or Less Safe According To Credit Rating Agencies) |
Interest Coverage (2+ Safe) |
|
2021 |
6.96 |
6.53 |
2.71 |
|
2022 |
6.55 |
5.75 |
2.45 |
|
2023 |
6.22 |
5.79 |
2.34 |
|
2024 |
5.91 |
5.58 |
2.32 |
|
2025 |
5.00 |
NA |
2.10 |
|
2026 |
NA |
NA |
1.95 |
|
2027 |
NA |
NA |
2.01 |
|
Annualized Change |
-5.27% |
-5.12% |
-4.85% |
(Source: FactSet Research Terminal)
Rating agencies want to see FRT’s net leverage return to 5.5X or less and analysts expect this will take until 2025.
FRT’s fixed charge coverage ratio is 4X, above management’s long-term target levels.
If FRT de-leverages as expected, it should regain its A-credit rating within a few years. Management expects to return to pre-pandemic levels of leverage by the end of 2023.
FRT Balance Sheet Consensus Forecast
|
Year |
Total Debt (Millions) |
Cash |
Net Debt (Millions) |
Interest Cost (Millions) |
EBITDA (Millions) |
Operating Income (Millions) |
|
2021 |
$4,048 |
$162 |
$3,802 |
$128 |
$582 |
$347 |
|
2022 |
$4,259 |
$167 |
$3,739 |
$132 |
$650 |
$323 |
|
2023 |
$4,350 |
$252 |
$4,044 |
$147 |
$699 |
$344 |
|
2024 |
$4,428 |
$282 |
$4,179 |
$166 |
$749 |
$385 |
|
2025 |
$4,132 |
NA |
NA |
$151 |
$826 |
$317 |
|
2026 |
NA |
NA |
NA |
$170 |
NA |
$331 |
|
2027 |
NA |
NA |
NA |
$178 |
NA |
$358 |
|
Annualized Growth |
0.51% |
20.29% |
3.20% |
5.65% |
9.15% |
0.52% |
(Source: FactSet Research Terminal)
FRT’s EBITDA is expected to grow robustly as it brings redevelopment projects online. The interest costs are expected to rise at a 6% rate, possibly due to higher long-term interest rate expectations from analysts.
-
the blue-chip economist consensus is that 10-year yields will average 2.5% to 3.5% for the foreseeable future
FRT has $1.18 billion in liquidity, mostly from an untapped $1 billion revolving credit line.
Its bonds are well staggered, and the REIT should have no trouble refinancing its debt, 93% of which is unsecured, for very good financial flexibility.
Why I Trust Federal Realty And So Can You
Federal Realty Is one of the oldest REITs in the world, having been founded in North Bethesda, Maryland, in 1962.
-
Congress created REITs in 1960
FRT owns 105 of the highest quality open-air shopping centers in the county located in top-tier cities like:
-
DC metro area: 36 properties
-
New York City: 15 properties
-
LA/San Diego: 13 properties
-
Philadelphia: 10 properties
-
Silicon Valley: 8 properties
-
Boston: 7 properties
-
Chicago: 4 properties
-
Miami: 3 properties
-
Phoenix: 3 properties
FRT’s properties are located in high-density and prosperous communities.
-
each one is within 3 miles of 177,000 people on average
-
with $151K average household income
-
with $10+ billion in average spending power
FRT’s properties are located in the best locations, with the highest density, and median household income by far.
-
50% higher average density compared to its industry peers
-
15% higher median household income
In fact, just 10% of the people living around FRT’s shopping centers make less than $75,000 annually.
-
Median US household income is $68,000
This is why FRT’s straight-line lease spreads (how much it’s raising rents on tenants) is 12%, one of the highest levels in all of REITdom.
In the Great Recession, its occupancy never fell below 93.5%, and in the Pandemic, it stayed above 90%; today is 94% for commercial properties and 98.5% for apartments, of which it owns nearly 3,000.
FRT’s income stream is highly diversified, with no single tenant more than 2.9% of the rent.
Its tenants include such thriving retails as:
In fact, its 2nd largest tenant is the tech company NetApp (NTAP). Its only distressed tenants are LA Fitness, Bed, Bath & Beyond (BBBY), and AMC (AMC), representing 2.88% of its rent.
FRT’s single largest source of rents is:
-
residential (apartments): 13%
-
restaurants: 15% (7.5% full service and 7.5% quick service)
-
offices: 11%
-
grocery: 9%
-
Apparel: 7%
-
Healthy and beauty: 5%
-
Home furnishings: 5%
-
banks: 4%
-
Fitness: 4%
It’s a mostly recession-resistant group of tenants, which, combined with its 5.7-year average lease duration, creates highly stable cash flows.
FRT is the only dividend king in REITdom with a 55-year growth streak and 7% CAGR growth for over half a century through all manner of economic turbulence:
-
the OPEC oil embargo of 1973
-
1980’s peak inflation of 14.8%
-
the Asian financial crisis of 1997
-
the Russian debt default of 1998
-
the tech crash and 9/11
-
the Great Recession (when just 13 REITs avoided cutting their dividends)
-
the Pandemic
-
the worst inflation in 41 years
During the Great Recession, FRT managed to preserve its FFO/share, kept growing its dividend, and grown its FFO/share far more impressively than its peers.
-
FRT: +102% FFO/share growth
-
REG: +8%
-
KIM: -22%
-
SITC: -65%
That’s thanks to a brilliant management team second to none in this industry.
FRT’s management averages over 20 years with the REIT and over 26 years in the real estate sector.
Its board is one of the best in the sector, packed with CEOs of other real estate companies with experience in multi-use developments.
Federal’s board includes CEOs of diversified real estate and retail companies with significant development backgrounds. Between the senior leadership and board, we believe management should continue to make smart capital-allocation decisions, make accretive developments, and successfully operate a retail portfolio in a difficult environment. – Morningstar
That industry-leading management team is why FRT has delivered 12.5% CAGR total returns since 2003 compared to 7.9% CAGR for shipping center REITs, 11.5% CAGR for the S&P 500, and 11.6% for all REITs.
That management team just completed $725 million in new premium construction projects, which it expects to earn over 6% cash returns on capital.
-
compared to borrowing costs of 3.1%
Those new properties include 500 apartments, and apartments are one of the hottest industries in the sector right now (and likely will remain so for the next decade).
FRT is working on $500 million in mixed-use properties in California and DC, which includes office space for government, healthcare, and biotech labs.
Its office park in Silicon Valley is focused on data centers and cloud computing tech titans.
After that $500 million in new growth projects, FRT has $226 million in additional growth projects planned within the next three years.
Reason Three: Solid Growth Prospects For Decades To Come
FRT has struggled through the pandemic with growth but is back on track to return to management’s historical guidance of 6+% CAGR (7% since 1967).
|
Metric |
2021 Growth |
2022 Growth Consensus |
2023 Growth Consensus |
2024 Growth Consensus |
2025 Growth Consensus |
2026 Growth Consensus |
2027 Growth Consensus |
|
Sales |
11% |
9% |
5% |
5% |
6% |
5% |
6% |
|
Dividend |
1% |
1% |
1%(Official) |
2% |
4% (57-year streak) |
NA |
NA |
|
FFO |
20% |
4% |
3% |
6% |
7% |
1% |
5% |
|
AFFO |
28% |
8% |
7% |
4% |
16% |
-1% |
6% |
|
EBITDA |
13% |
14% |
7% |
7 |
NA |
NA |
NA |
|
EBIT (operating income) |
20% |
8% |
4% |
19% |
NA |
NA |
NA |
(Source: FactSet Research Terminal, FAST Graphs)
In 2023 analysts expect FRT to double the dividend growth rate to 2% and then double it again in 2025.
-
FRT is currently deleveraging and bringing down its payout ratio after the Pandemic induced weakness
FRT Margin Consensus Forecast
|
Year |
AFFO Margin |
EBITDA Margin |
EBIT (Operating) Margin |
Net Margin |
|
2021 |
37.2% |
61.3% |
36.6% |
26.7% |
|
2022 |
36.4% |
62.1% |
30.9% |
20.2% |
|
2023 |
37.1% |
63.3% |
31.2% |
20.3% |
|
2024 |
37.3% |
64.8% |
33.3% |
21.5% |
|
2025 |
39.2% |
64.7% |
24.8% |
23.4% |
|
2026 |
36.8% |
NA |
24.6% |
23.2% |
|
2027 |
37.0% |
NA |
25.2% |
23.9% |
|
Annualized Growth 2022-2027 |
-0.10% |
1.36% |
-6.00% |
-1.81% |
(Source: FactSet Research Terminal)
FRT’s profitability is historically in the top 20% of REITs (wide moat by sector standards), and that profitability is expected to be relatively stable over time.
That includes AFFO margins of 36% to 37%, on par with some of the most free cash flow-rich companies on earth (like Microsoft and Texas Instruments).
FRT Medium-Term Consensus Growth Forecast
|
Year |
Sales |
Free Cash Flow |
EBITDA |
EBIT (Operating Income) |
Net Income |
|
2021 |
$949 |
$353 |
$582 |
$347 |
$253 |
|
2022 |
$1,047 |
$381 |
$650 |
$323 |
$211 |
|
2023 |
$1,104 |
$409 |
$699 |
$344 |
$224 |
|
2024 |
$1,155 |
$431 |
$749 |
$385 |
$248 |
|
2025 |
$1,276 |
$501 |
$826 |
$317 |
$299 |
|
2026 |
$1,348 |
$496 |
NA |
$331 |
$313 |
|
2027 |
$1,419 |
$525 |
NA |
$358 |
$339 |
|
Annualized Growth 2022-2027 |
6.93% |
6.83% |
9.15% |
0.52% |
5.00% |
|
Cumulative 2022-2025 |
$4,582 |
$1,721 |
$2,924 |
$1,369 |
$982 |
(Source: FactSet Research Terminal)
FRT is rising like a Phoenix from the ashes of the Pandemic, with 7% sales growth and AFFO growth.
-
Its historical growth rate over the last 55 years
FRT Dividend Growth Consensus Growth Forecast
|
Year |
Dividend Consensus |
AFFO/Share Consensus |
AFFO Payout Ratio |
Retained (Post-Dividend) Cash Flow |
Buyback Potential |
Debt Repayment Potential |
|
2022 |
$4.31 |
$4.70 |
91.7% |
$32 |
0.37% |
0.8% |
|
2023 |
$4.40 |
$5.05 |
87.1% |
$53 |
0.62% |
1.2% |
|
2024 |
$4.49 |
$5.32 |
84.4% |
$67 |
0.79% |
1.6% |
|
2025 |
$4.66 |
$6.18 |
75.4% |
$123 |
1.45% |
2.8% |
|
Total 2022 Through 2025 |
$17.86 |
$21.25 |
84.0% |
$274.59 |
3.23% |
6.45% |
|
Annualized Rate |
2.6% |
9.6% |
-4.1% |
45.9% |
45.9% |
42.2% |
(Source: FactSet Research Terminal)
Rating agencies consider 90% a safe AFFO payout ratio for this industry, and FRT’s payout ratio is coming down from a peak of 124% in the Pandemic to 97% in 2021 to 92% in 2022.
By 2023 analysts expect FRT’s payout ratio to return to safe levels and then keep falling to 75% by 2025, thanks to AFFO/share growth of 9.6% CAGR over the next three years.
That means FRT is expected to retain $275 million per year in post-dividend cash flow, including $123 million in 2023 alone.
That’s compared to its historical growth spending of approximately $150 million per year.
FRT Long-Term Growth Outlook
-
6.3% median consensus from all 20 analysts
-
6+% CAGR management’s pre-pandemic guidance
-
7% historical growth since 1967
How accurate are analysts at forecasting FRT’s growth?
Smoothing for outliers, analyst margins of error on FRT are 5% to the downside and 5% to the upside.
-
outside of the Pandemic, it almost never misses expectations
-
3% to 7% CAGR margin-of-error adjusted growth consensus range
What does this potentially mean for long-term FRT investors?
|
Investment Strategy |
Yield |
LT Consensus Growth |
LT Consensus Total Return Potential |
Long-Term Risk-Adjusted Expected Return |
Long-Term Inflation And Risk-Adjusted Expected Returns |
Years To Double Your Inflation & Risk-Adjusted Wealth |
10-Year Inflation And Risk-Adjusted Expected Return |
|
Federal Realty Income Trust |
4.1% |
6.3% |
10.4% |
7.3% |
5.0% |
14.4 |
1.63 |
|
Dividend Aristocrats |
2.4% |
8.6% |
11.0% |
7.7% |
5.4% |
13.4 |
1.69 |
|
S&P 500 |
1.7% |
8.5% |
10.2% |
7.1% |
4.9% |
14.8 |
1.61 |
|
REITs |
3.2% |
6.0% |
9.2% |
6.4% |
4.2% |
17.3 |
1.50 |
(Source: DK Research Terminal, Morningstar, FactSet, Ycharts)
Analysts expect about 10.4% long-term returns from FRT, slightly better than REITs as a sector and matching the market’s returns.
-
but with 2.6X the much safer yield
Total Returns Since 1987
FRT has been delivering market-level returns of 10.7% CAGR for the last 35 years, just as analysts expect it will in the coming decades.
What could this mean for your portfolio over time?
Inflation-Adjusted Consensus Total Return Potential: $1,000 Initial Investment
|
Time Frame (Years) |
7.9% CAGR Inflation-Adjusted S&P 500 Consensus |
8.7% Inflation-Adjusted Dividend Aristocrats Consensus |
8.1% CAGR Inflation-Adjusted FRT Consensus |
Difference Between Inflation-Adjusted FRT Consensus Vs. S&P Consensus |
|
5 |
$1,461.18 |
$1,516.17 |
$1,476.83 |
$15.64 |
|
10 |
$2,135.06 |
$2,298.77 |
$2,181.02 |
$45.96 |
|
15 |
$3,119.71 |
$3,485.33 |
$3,220.98 |
$101.27 |
|
20 |
$4,558.47 |
$5,284.36 |
$4,756.83 |
$198.36 |
|
25 |
$6,660.75 |
$8,012.00 |
$7,025.01 |
$364.25 |
|
30 (retirement time frame) |
$9,732.58 |
$12,147.56 |
$10,374.71 |
$642.13 |
|
35 |
$14,221.09 |
$18,417.77 |
$15,321.64 |
$1,100.56 |
|
40 |
$20,779.62 |
$27,924.49 |
$22,627.40 |
$1,847.79 |
|
45 |
$30,362.83 |
$42,338.29 |
$33,416.74 |
$3,053.91 |
|
50 |
$44,365.65 |
$64,192.09 |
$49,350.71 |
$4,985.05 |
|
55 |
$64,826.35 |
$97,326.17 |
$72,882.41 |
$8,056.06 |
|
60 (investing life-time) |
$94,723.18 |
$147,563.10 |
$107,634.63 |
$12,911.46 |
|
100 (institutional time frame) |
$1,968,311.27 |
$4,120,623.88 |
$2,435,492.15 |
$467,180.89 |
(Source: DK Research Terminal, FactSet)
FRT could deliver 10X inflation-adjusted returns over the next 30 years and 108X over an investing lifetime.
Reason Four: A Wonderful Company At A Wonderful Price
Since the Great Recession, outside of bear markets and bubbles, millions of income investors have consistently paid between 21 and 22X FFO for FRT.
-
90% statistical probability that this approximates intrinsic value
|
Metric |
Historical Fair Value Multiples (130-year) |
2021 |
2022 |
2023 |
2024 |
12-Month Forward Fair Value |
|
5-Year Average Yield |
3.44% |
$123.84 |
$125.58 |
$125.58 |
$130.52 |
|
|
13-Year Median Yield |
2.99% |
$142.47 |
$144.48 |
$144.48 |
$150.17 |
|
|
FFO |
21.90 |
$121.98 |
$134.90 |
$139.94 |
$149.58 |
|
|
Average |
$128.80 |
$134.55 |
$136.18 |
$142.81 |
$135.74 |
|
|
Current Price |
$105.23 |
|||||
|
Discount To Fair Value |
18.30% |
21.79% |
22.73% |
26.32% |
22.48% |
|
|
Upside To Fair Value (NOT Including Dividends) |
22.40% |
27.86% |
29.41% |
35.72% |
28.99% (34% including dividend) |
|
|
2022 FFO |
2023 FFO |
2022 Weighted FFO |
2023 Weighted FFO |
12-Month Forward FFO |
12-Month Average Fair Value Forward FFO |
Current Forward FFO |
|
$6.16 |
$6.39 |
$1.66 |
$4.67 |
$6.33 |
21.5 |
16.6 |
I estimate FRT is historically worth about 21.5X FFO, and today it trades at just 16.6X, a 23% historical discount.
-
Including dividends, up to 34% total returns within a year would be justified by fundamentals.
|
Rating |
Margin Of Safety For Low-Risk 13/13 Quality Ultra SWANs |
2022 Fair Value Price |
2023 Fair Value Price |
12-Month Forward Fair Value |
|
Potentially Reasonable Buy |
0% |
$134.55 |
$136.18 |
$135.74 |
|
Potentially Good Buy |
5% |
$127.82 |
$129.37 |
$128.95 |
|
Potentially Strong Buy |
15% |
$114.37 |
$115.75 |
$115.38 |
|
Potentially Very Strong Buy |
25% |
$95.87 |
$102.13 |
$101.80 |
|
Potentially Ultra-Value Buy |
35% |
$87.46 |
$88.52 |
$88.23 |
|
Currently |
$105.23 |
21.79% |
22.73% |
22.48% |
|
Upside To Fair Value (Not Including Dividends) |
27.86% |
29.41% |
28.99% |
For anyone comfortable with its risk profile, FRT is a potentially strong buy and very close to being a very strong buy.
Risk Profile: Why Federal Realty Isn’t Right For Everyone
There are no risk-free companies, and no company is right for everyone. You have to be comfortable with the fundamental risk profile.
Risk Profile Summary
The growth of e-commerce has caused e-tailers to take market share from physical retail sales. Additionally, many traditional retailers are moving more of their business online to compete with the prices and convenience offered by e-commerce. The U.S. is significantly overretailed on a square foot per capita basis, so shrinking market share for physical space will worsen the situation and make store closures more likely over time.
Several of Federal Realty’s major in line tenants have experienced declining sales and expect to close stores. Federal will have to re-lease vacant space to new tenants, which may be at lower rents in a negative sales environment.
The grocery industry is slowly incorporating online shopping. Amazon’s purchase of Whole Foods has heightened the growing connection between grocery stores and e-commerce.
While penetration is still low and most shoppers still drive to the center to pick up groceries, the potential for increased grocery delivery could take away traffic from shopping centers. Federal’s largest development projects are mixed-use projects that feature office, multifamily residential, and/or hotel components, lines of business that are outside the company’s traditional retail focus.
Without the operational expertise in these businesses, Federal’s management team might not be able to maximize the competitive position of these properties. While management does not expect office and residential exposure to exceed 20% of the portfolio, there is a risk that these investments will fail to earn appropriate returns over the long term.
The company may face environmental, social, and governance risks that would negatively affect its portfolio or cash flows. These include properly maintaining the safety of the buildings across the portfolio, paying a competitive wage to employees, and accounting for the future impact of climate change. Given all of the company and industry risks, we currently assign Federal Realty a medium level of uncertainty. – Morningstar
FRT’s Risk Profile Includes
-
modest economic cyclicality risk (relatively recession-resistant)
-
rising interest rate risk (6% annual growth in interest costs according to analysts)
-
retail disruption risk (which FRT is dealing with through mixed-use and omnichannel)
-
labor retention risk (tightest job market in 50 years)
-
redevelopment project execution risk (brilliant execution for decades)
Bond Market 13-Month Recession Risk
|
Date |
3 Month Yield |
10 Year Yield |
10-3 Curve |
13-Month Recession Risk |
|
8/31/22 |
2.957 |
3.133 |
0.176 |
81.57% |
|
9/1/22 |
2.953 |
3.258 |
0.305 |
68.17% |
|
9/2/22 |
2.920 |
3.195 |
0.275 |
71.29% |
|
9/7/22 |
3.037 |
3.267 |
0.230 |
75.96% |
|
9/8/22 |
3.023 |
3.317 |
0.294 |
69.31% |
|
9/9/22 |
3.064 |
3.315 |
0.251 |
73.78% |
|
9/12/22 |
3.191 |
3.35 |
0.159 |
83.34% |
|
9/13/22 |
3.142 |
3.32 |
0.178 |
81.36% |
(Source: DK S&P 500 Valuation & Total Return Tool, CNBC, New York Federal Reserve)
The bond market is pricing in an 81% risk of recession in 2023, which could cause FRT some minor trouble in terms of slightly higher occupancy and temporarily lower lease spreads.
-
it might push back the de-leveraging efforts by one year
How do we quantify, monitor, and track such a complex risk profile? By doing what big institutions do.
Long-Term Risk Analysis: How Large Institutions Measure Total Risk
-
see the risk section of this video to get an in-depth view (and link to two reports) of how DK and big institutions measure long-term risk management by companies
FRT Long-Term Risk-Management Consensus
|
Rating Agency |
Industry Percentile |
Rating Agency Classification |
|
Morningstar/Sustainalytics 20 Metric Model |
85.2% |
12.6/100 Low-Risk |
|
Reuters’/Refinitiv 500+ Metric Model |
89.0% |
Good |
|
S&P 1,000+ Metric Model |
43.0% |
Average, Positive Trend |
|
Morningstar Global Percentile (All 15,000 Rated Companies) |
95.4% |
Good |
|
Consensus |
78.2% |
Low Risk, Good Risk-Management, bordering on very good, Stable Trend |
(Sources: Morningstar, S&P, Reuters)
FRT’s Long-Term Risk Management Is The 87th Best In The Master List (83rd Percentile)
|
Classification |
Average Consensus LT Risk-Management Industry Percentile |
Risk-Management Rating |
|
S&P Global (SPGI) #1 Risk Management In The Master List |
94 |
Exceptional |
|
Federal Realty Investment Trust |
78 |
Good – Bordering On Very Good |
|
Strong ESG Stocks |
78 |
Good – Bordering On Very Good |
|
Foreign Dividend Stocks |
75 |
Good |
|
Ultra SWANs |
71 |
Good |
|
Low Volatility Stocks |
68 |
Above-Average |
|
Dividend Aristocrats |
67 |
Above-Average |
|
Dividend Kings |
63 |
Above-Average |
|
Master List average |
62 |
Above-Average |
|
Hyper-Growth stocks |
61 |
Above-Average |
|
Monthly Dividend Stocks |
60 |
Above-Average |
|
Dividend Champions |
57 |
Average bordering on above-average |
(Source: DK Research Terminal)
FRT’s risk-management consensus is in the top 17% of the world’s highest quality companies and similar to that of such other blue-chips as
-
Target (TGT): Ultra SWAN dividend king
-
Dover (DOV): Ultra SWAN dividend king
-
Air Products and Chemicals (APD): Super SWAN dividend aristocrat
-
Toronto-Dominion Bank (TD): Ultra SWAN
-
Visa (V): Ultra SWAN
The bottom line is that all companies have risks, and FRT is good, bordering on very good, at managing theirs.
How We Monitor FRT’s Risk Profile
-
20 analysts
-
2 credit rating agencies
-
4 total risk rating agencies
-
24 experts who collectively know this business better than anyone other than management
When the facts change, I change my mind. What do you do, sir? – John Maynard Keynes
There are no sacred cows at iREIT or Dividend Kings. Wherever the fundamentals lead, we always follow. That’s the essence of disciplined financial science, the math behind retiring rich and staying rich in retirement.
Bottom Line: Federal Realty Is The Perfect High-Yield Dividend King To Beat Stagflation, And This Bear Market
Don’t get me wrong. I’m NOT calling the bottom in FRT (I’m not a market-timer).
Ultra SWAN doesn’t mean “can’t fall hard in a bear market.”
Fundamentals are all that determine safety and quality, and my recommendations.
-
over 30+ years, 97% of stock returns are a function of pure fundamentals, not luck
-
in the short-term; luck is 33X as powerful as fundamentals
-
in the long-term, fundamentals are 33X as powerful as luck
While I can’t predict the market in the short term, here’s what I can tell you about FRT.
-
One of the highest quality, high-yield dividend kings on earth.
-
4.1% very safe yield with 6.3% long-term growth potential
-
10.4% CAGR long-term total return potential, similar to the last 35 years
-
23% historically undervalued, a potentially strong buy
-
16.6X FFO (vs. 21 to 22 historical)
-
85% consensus return potential over the next five years, 12% CAGR, 2X more than the S&P 500
-
19% CAGR Buffett-like return potential over the next 2.5 years
-
50% better risk-adjusted expected returns of the S&P 500 over the next five years.
-
2X more income potential over the next five years
Might core inflation keep getting worse for a few more months? Morgan Stanley thinks core PCE (the Fed’s official inflation metric) might not peak until February.
Might the Fed end up hiking a lot more? The bond market is already pricing in a 4.5% terminal rate, and some Fed presidents say they are willing to go as high as 6%…for 2 years if that’s what it takes to finish the job.
Could stocks fall a lot more?
Sure.
Or they might just trade flat for several months or even a year.
Smart long-term investors know what happens in the next year, or even two doesn’t matter. What matters is safe and growing dividends from world-beater blue-chips you can trust.
Suppose you want to sleep well at night in this stagflationary bear market. In that case, I can’t think of many better choices than a deeply undervalued Ultra SWAN dividend king that’s been raising its dividends through no less than eight recessions and inflation as high as 15%.
Be the first to comment