

Orla/iStock via Getty Images
In a recent article, I explained how, these days:
“I have a greater understanding of investing: how monetary success is gained by playing good offense (earning money) and defense (spending as little as possible).”
But that wasn’t always the case. I explained that in another piece, this one published at the beginning of the month:
“I’ll admit, in my early days as an investor, I never really understood the concept of money. But over the last three decades, I have developed a serious concern for it… and a desire to work hard to achieve success.
“It’s not just my experience that differentiates me from other Wall Street writers, but my extreme conservatism that provides me with a gigantic edge.”
And I added:
“… there’s a point in which everyone on this earth experiences a mishap… but what matters is how they handle it, what they do next, and how they let it shape them in the end.”
One of the most fearful times in my life was in 2008, when the full weight of the housing crash and the subsequent Great Recession came down on me.
That’s when stocks crashed by around 40%.
And my net worth cratered even further.
The Ultimate Stress Test
Before the crash, I was a real estate developer and investor, and a very successful one at that. I never imagined that a financial crisis would be so painful to me and millions of other property owners and investors.
During this period, most real estate investment trusts (REITs) cut their dividend. Lehman Bros and Bear Sterns fell apart. And Citigroup (C) and American International Group (AIG) almost did.
The financial markets were in utter turmoil and there was no certainty that any REIT would have access to the capital – even the so-called blue chips.
Yahoo Finance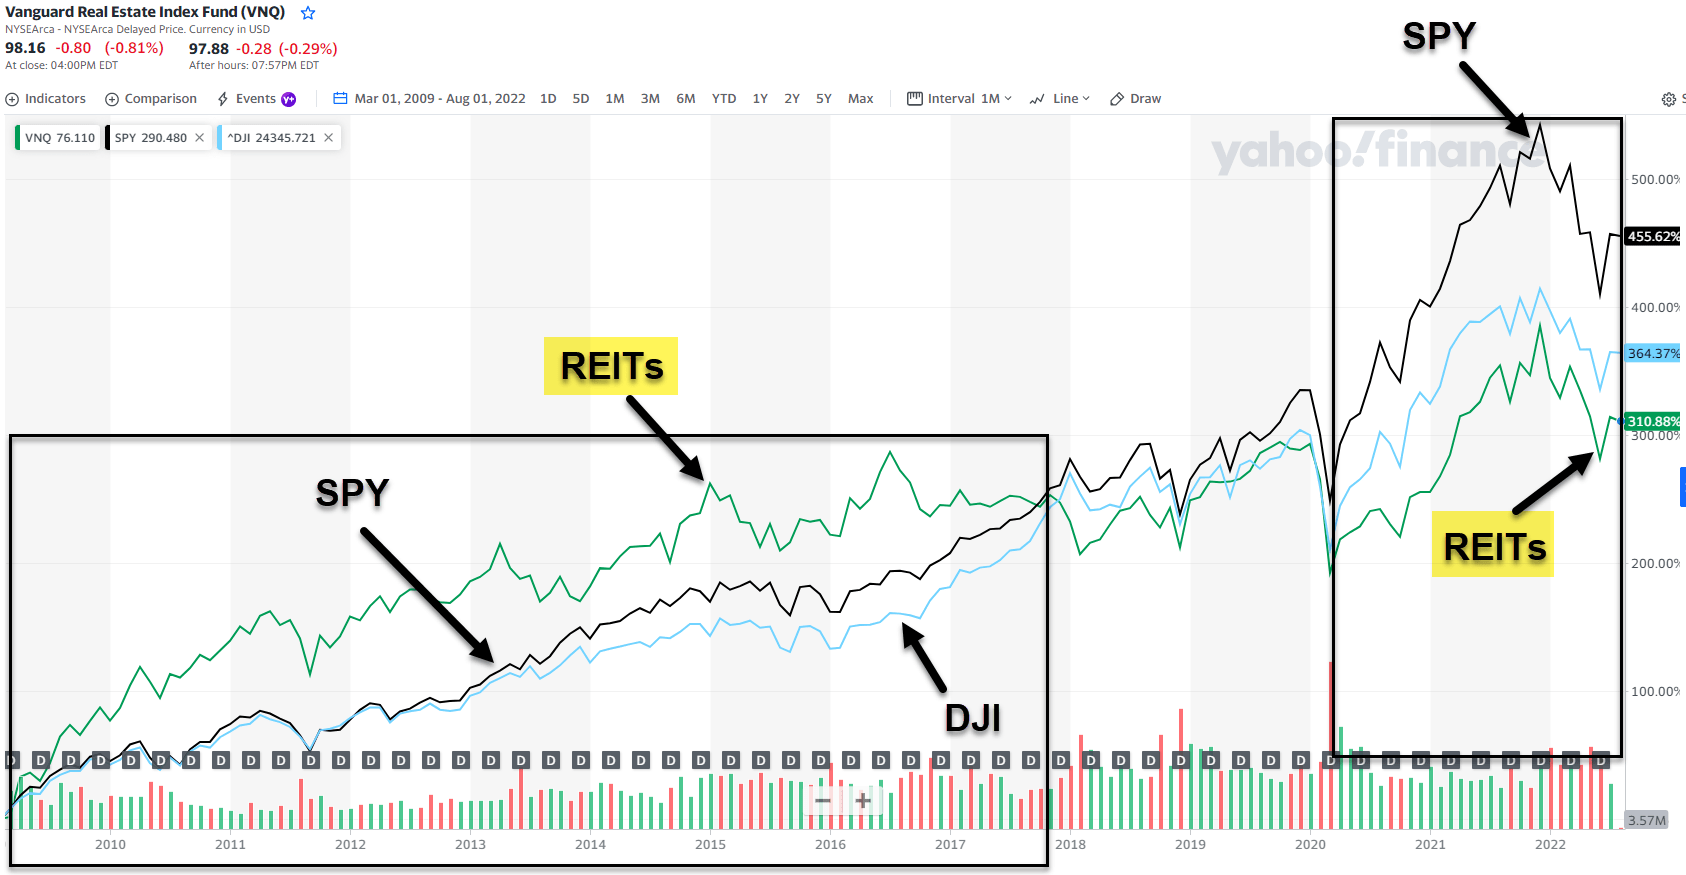
Yet as you can see (above), coming out of the Great Recession in 2009, REITs outperformed, generating solid returns for investors. Though since then, they’ve underperformed.
Although I’m no expert in market timing – nobody is – it’s very clear to me that REITs were well-positioned to grow prior to Covid-19. And they’ve become extremely more disciplined as a result of the tough times in 2008-2009.
Just like me, by the way.
In my book, The Intelligent REIT Investor Guide, I explain that:
“REIT investors became acutely aware of those risks in the Great Recession. During that period, over-leveraged entities were forced to sell properties whose values had dropped below the outstanding loan balance, often at deep fire-sale discounts. They then had to recapitalize and raise equity under very difficult market conditions.”
That kind of potential explains one of the important elements of our risk management practices at iREIT on Alpha – to examine balance sheet risk. As I also explain:
“Prudent financing strategy includes a firm commitment to maintain low leverage, mitigate refinancing risk by matching debt and asset maturity, rely on unsecured debt as a general rule, and manage interest rate risk using fixed-rate debt.”
I can’t stress how important that is.
Solid-as-a-Rock REIT
It should be no surprise to you that many of our core positions in the Durable Income Portfolio have performed extremely well during the pandemic simply because we’re overweight on best-in-breed REITs.
So what does a strong REIT balance sheet look like?
To answer this, investors should first look at two important ratios:
- There should only be a modest amount of debt relative to its total market cap, the total market value of its assets, or its earnings before interest, taxes, depreciation, and amortization (EBITDA).
- There should be strong coverage of the interest payments on that debt and other fixed charges from operating cash flows.
One of the most important factors we look at when analyzing REITs – and business development companies (“BDCs”), master limited partnerships (“MLPs”), and C-corps – is a relatively safe and growing dividend. And to analyze that safety, we use payout ratios.
Again, citing my book:
“Maintaining a modest payout ratio is good policy for two reasons: taking advantage of opportunities that come up and insuring against pitfalls.
“While REITs legally can’t keep too much of their money, they should be saving up some amount of it to properly handle life’s twists and turns, both positive and negative.
“If they’re paying out too much in dividends, that means they’re not in good shape to handle whatever’s around the next corner.”
Knowing that, let’s see what we can see…
The Dividend Champions
As I referenced earlier, most REITs were forced to cut their dividend during the Great Recession, yet there were a handful of companies that made it through and continued to boost their dividends.
In this article I will focus on the “Dividend Champions” or what Justin Law describes as the dividend-paying stocks that were able to grow their dividend for 25 years in a row or more.
Wide Moat Research 
Our first dividend champion is W. P. Carey Inc. (WPC), a net lease REIT that has paid and increased dividends for 25 years in a row. This stalwart REIT recently announced Q2-22 earnings and is hitting all-cylinders: AFFO/sh was $1.31 (+3.1% y/y) above consensus of $1.28/sh driven by lower-than-expected property expenses and lower interest expense.
WPC increased its initial guidance for FY2022, which now includes the impact from the CPA:18 merger, that just closed ($2B of assets after dispositions); AFFO increased +0.4% to $5.22-5.30 ($5.26 midpoint).
WPC’s Same-Store growth reached new highs of +3.0% contractual annualized base rent (“ABR”), +3.3% comprehensive, with the latter bolstered by higher retail performance. WPC is one our top iREIT picks given its defensive triple-net leases and solid CPI bumps (57.8% of leases CPI-linked, including 37.0% uncapped).
FAST Graphs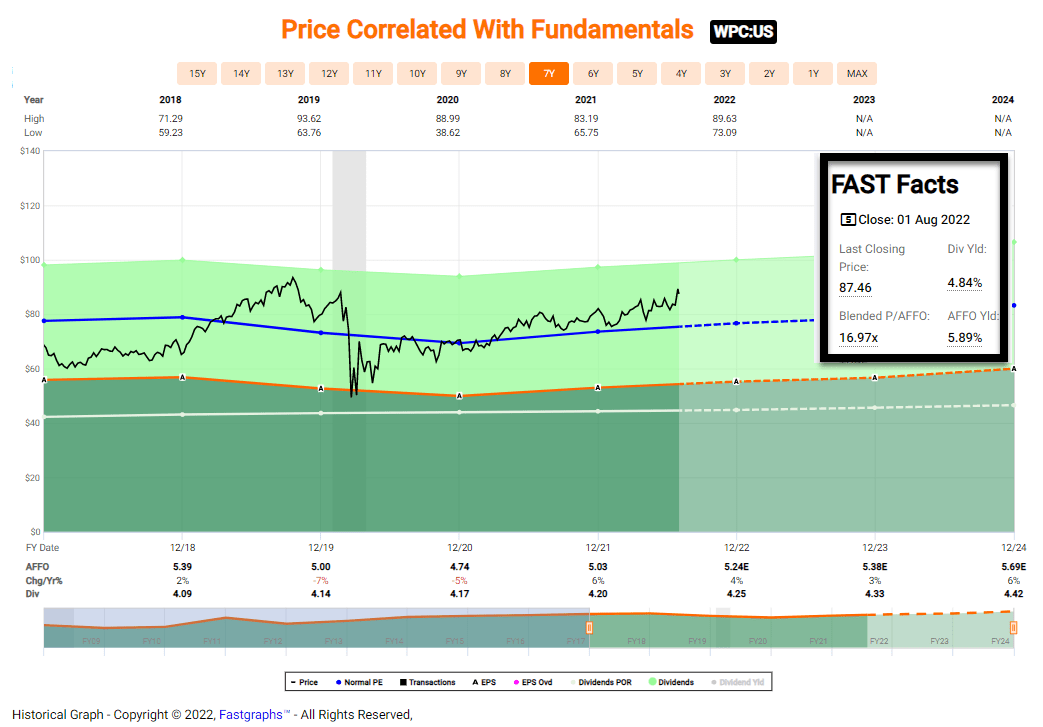
As you can see (above), WPC is trading above normal value ranges (16.9x vs the normal range of 14.6x), and our buy below target is $80.00 per share (now trading at $87.46 per share). We maintain a Hold. As you can see below, WPC has returned 13.2% annually since January 2010.
FAST Graphs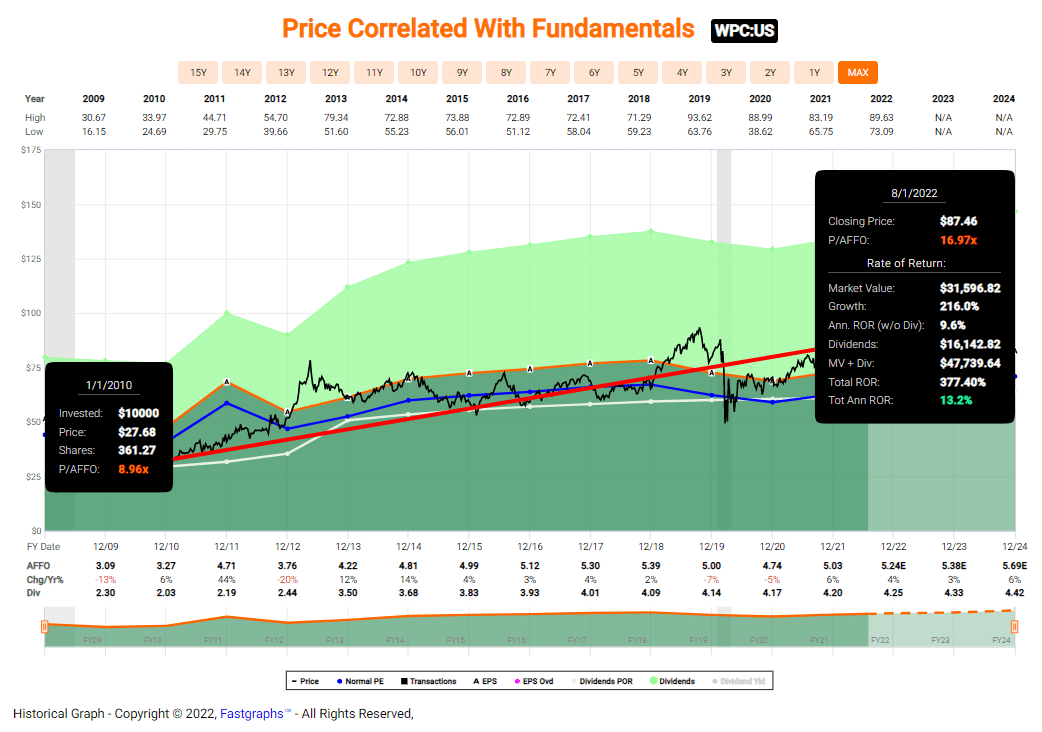
Essex Property Trust, Inc. (ESS) is an S&P 500 Company that manages multifamily apartment communities located in supply-constrained markets and concentrated along the West Coast, including Southern California, the San Francisco Bay Area, and the Seattle metropolitan area. The company has paid an increased dividends for 28 years in a row.
In Q2-22 ESS reported impressive results beating consensus by $0.14/sh driven by +12.7% SS Rev and for the second straight month, the company raised FY22 guidance by $0.29/share (+2%), due to return-to-office trends in its tech-heavy markets.
ESS’s blended lease rates grew +15.4% in Q2-22 although decelerated to +11.8% in July, lower than peers. In Q2-22 ESS repurchased 219K shares for $60.8M ($277.68/sh) with $153.6M remaining under its stock repurchase plan. It currently has $1.3B in available liquidity, while its leverage decreased by -30 bps to 5.8x net debt/adjusted EBITDAre.
FAST Graphs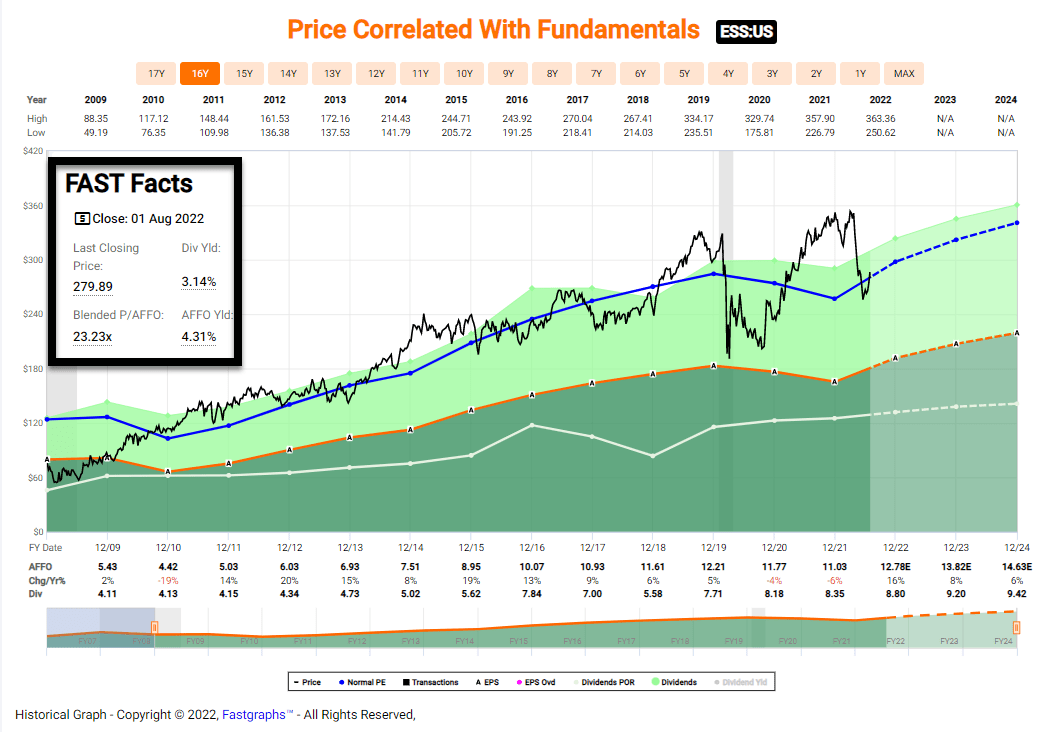
As seen above, ESS is trading at $279.89/sh, a notch above our buy below target of $275.00. This puts the company as a Hold at iREIT. As seen below, ESS has returned 12.2% annually since January 2010.
FAST Graphs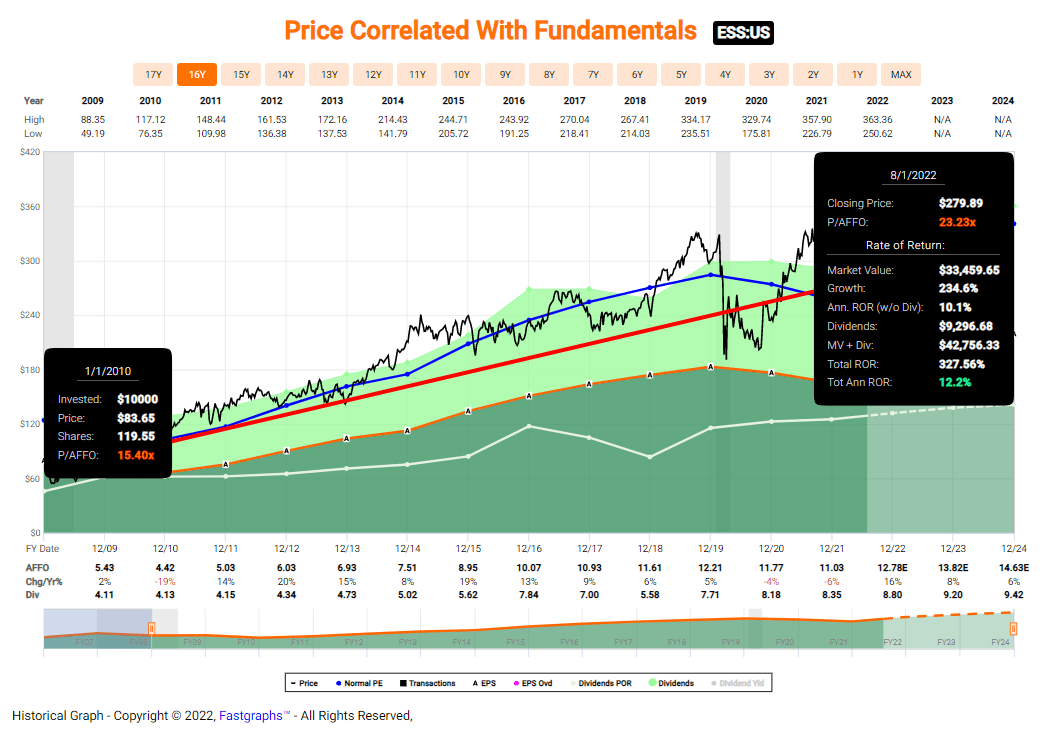
Realty Income Corporation (O) is a net lease REIT (and another S&P 500 company) that owns nearly 11,000 properties in the U.S. and Europe. The company has increased its dividend for over 29 years in a row.
The company plans to release its Q2-22 operating results after the close on August 3rd and will host its conference call on August 4th (at 11:30 PT).
FAST Graphs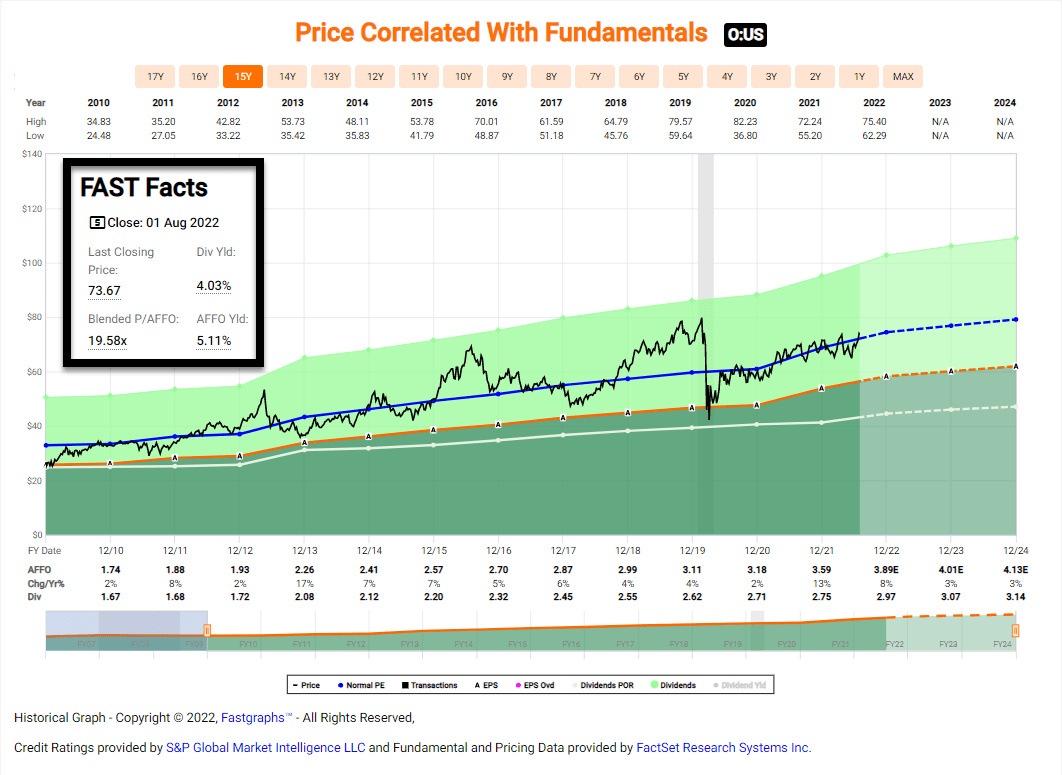
As see above, Realty Income is trading at $73.67, which is around 5% above our buy below target price. The dividend yield is 4.0%, and analysts are forecasting AFFO to grow by 8% in 2022 and 3% in 2023. We maintain a Hold at this time. As seen below, shares have returned 11.8% annually since January 2010.
FAST Graphs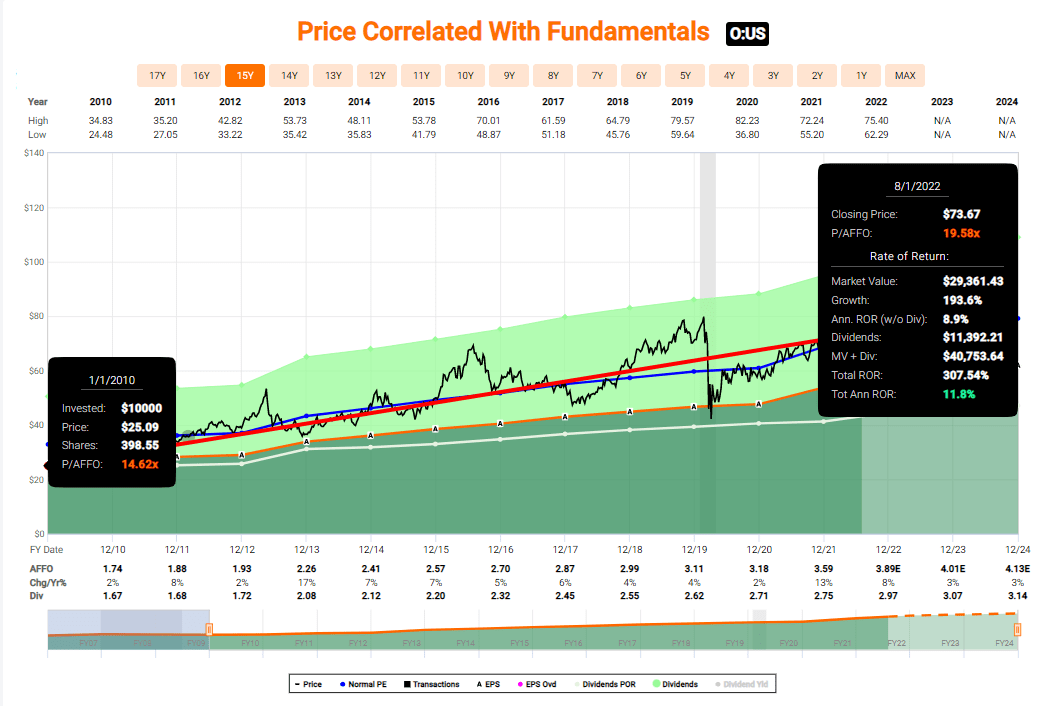
National Retail Properties, Inc. (NNN) is a net lease REIT that owns 3,271 single-tenant properties across 48 states, that are leased out to over 370 different tenants, as of Q1 2022.
The stable portfolio has helped fund a very strong dividend for the company. Over the years, investors have enjoyed 32 CONSECUTIVE years of dividend growth. This month we should hear an announcement on a new increase making it 33 consecutive months.
In terms of safety, the dividend is well-covered with an AFFO payout ratio of only 68% in Q1-22 (as per REIT/BASE). This is incredible coverage and further adds to the safety of NNN especially if we do dip into a recession.
FAST Graphs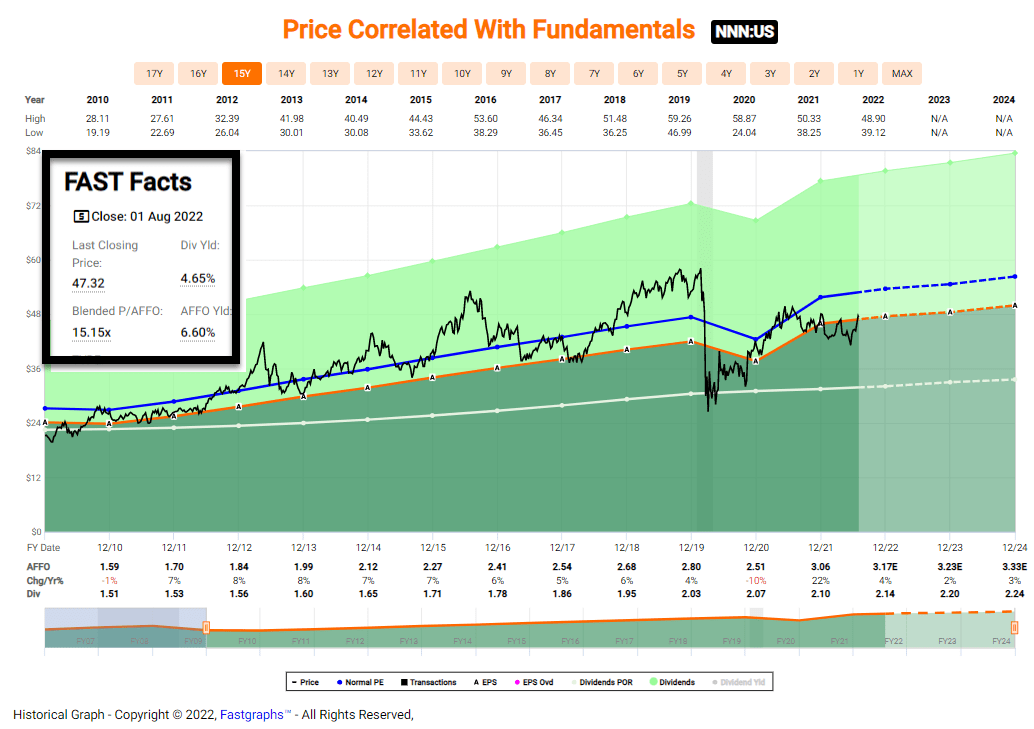
As seen above, NNN is now trading at $47.32 with a P/AFFO multiple 15.2x (normal range is 16.9x). The dividend yield is now 4.7% and shares are trading at a slight discount to our buy below target of $48.00/sh. Since January 2020 shares have returned an average of 9.9% annually.
FAST Graphs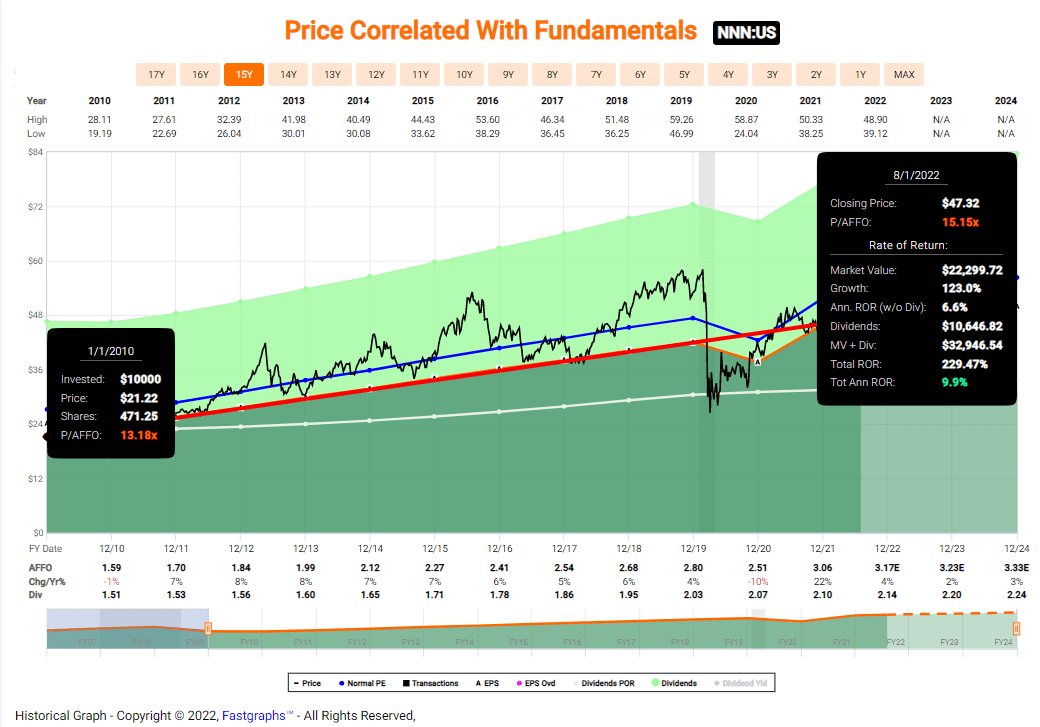
Federal Realty Investment Trust (FRT) is a shopping center REIT that has the longest dividend record in the REIT industry, coming in at a full 54 years of increasing, annual dividends.
The company has proven that it cannot only retain its momentum during downturns – but it can actually grow significantly even during difficult times, such as the financial crisis and COVID.
While things haven’t completely recovered, the combination of historical and forecasts tells us only one possible outcome according to the company – reversion and return to growth.
Federal Realty has proven that the demographics that geographically surround their properties are much better during downturns.
So even if FRT actually suffered more during pandemic shutdowns – because their properties were often mandated to be shut down, which also impacted these aforementioned lifestyle tenants, the company views this as unlikely to continue.
The numbers certainly support this forecast – because the occupancy numbers and trends hardly seem negatively impacted to any extensive degree.
FAST Graphs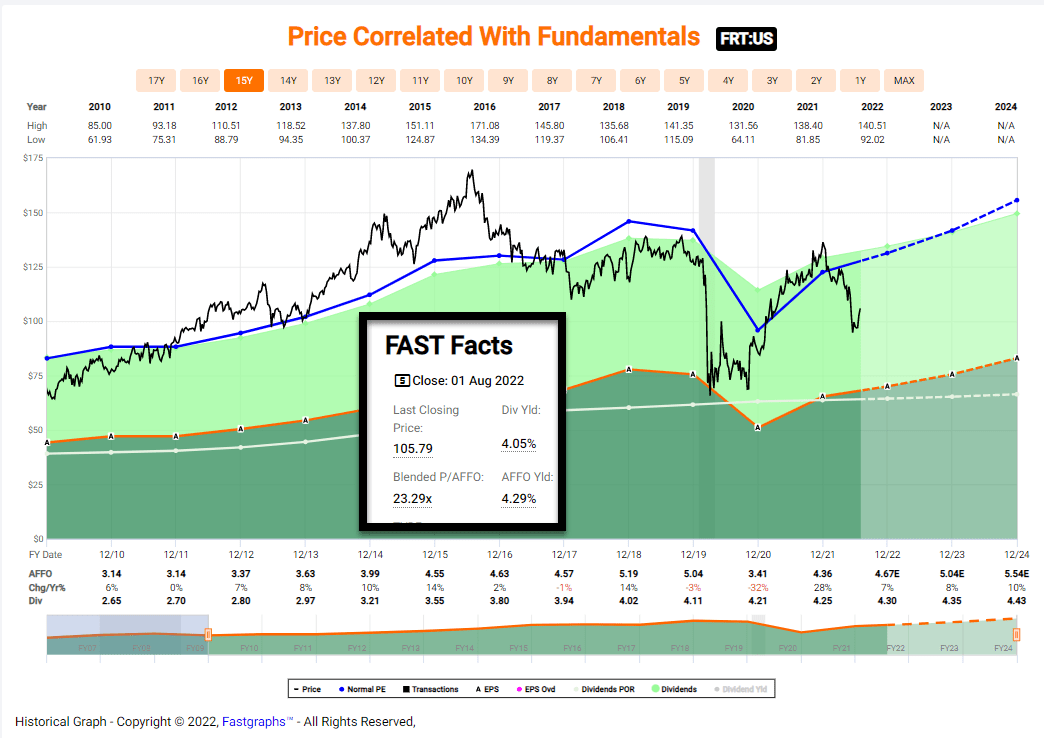
As you can see (above), Federal Realty s trading at $105.79 with a P/AFFO of 22.3x (normal range is 28.1), well below normal valuation. The dividend yield is 4.1% and analysts are forecasting growth of 7% in 2022 and 8% in 2023. We’re super bullish with this “Dividend King” and this REIT remains one of our top picks. Since January 2010 shares have returned 6.6% annually.
FAST Graphs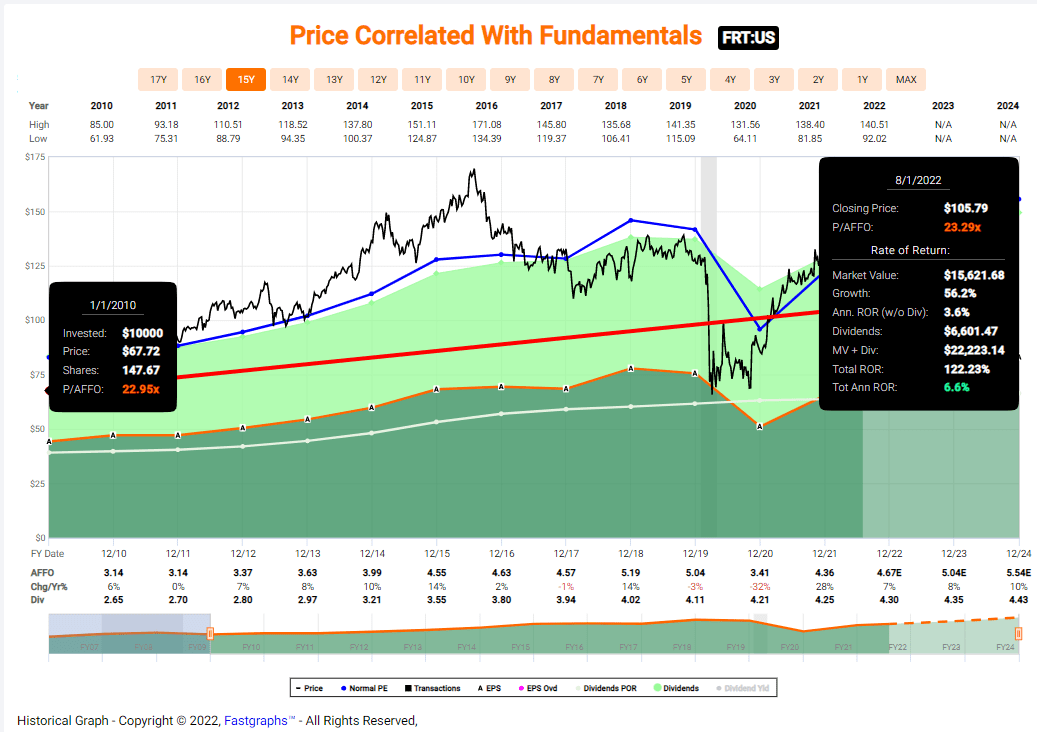
Nothing to Fear
You see now, there’s nothing to fear when it comes to investing in REITs, especially these five REITs that have paid and increased dividend for at least 25 years in a row.
iREIT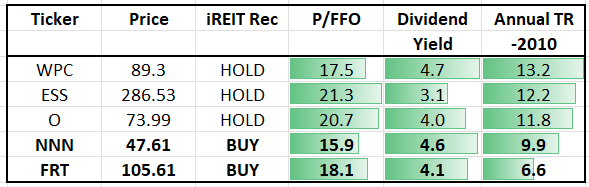
Stay tuned for “The Fearless Investor 2.0” as I examine the best REITs to buy that have paid and increased dividends from 10-25 years in a row. Never forget,
“The safest dividend is the one that’s just been raised.”
Happy REIT Investing!
Be the first to comment